Exhibit 99.2
South Plains Financial First Quarter 2026 Earnings Presentation April 28,
2026
Safe Harbor Statement and Other Disclosures FORWARD-LOOKING STATEMENTS This
presentation contains, and future oral and written statements of South Plains Financial, Inc. (“South Plains”, “SPFI”, or the “Company”) and City Bank (“City Bank” or the “Bank”) may contain, statements about future events that constitute
forward-looking statements within the meaning of the Private Securities Litigation Reform Act of 1995. These forward-looking statements reflect South Plains’ current views with respect to future events and South Plains’ financial performance.
Any statements about South Plains’ expectations, beliefs, plans, predictions, forecasts, objectives, assumptions or future events or performance are not historical facts and may be forward-looking. These statements are often, but not always,
made through the use of words or phrases such as “anticipate,” “believes,” “can,” “could,” “may,” “predicts,” “potential,” “should,” “will,” “estimate,” “plans,” “projects,” “continuing,” “ongoing,” “expects,” “intends” and similar words or
phrases. Forward-looking statements include, but are not limited to: (i) projections and estimates of revenues, expenses, income or loss, earnings or loss per share, and other financial items, (ii) statements of plans, objectives and
expectations of South Plains or its management, (iii) statements of future economic performance, and (iv) statements of assumptions underlying such statements. Forward-looking statements should not be relied on because they involve known and
unknown risks, uncertainties and other factors, some of which are beyond the control of South Plains and City Bank. These risks, uncertainties and other factors may cause the actual results, performance, and achievements of South Plains and
City Bank to be materially different from the anticipated future results, performance or achievements expressed in, or implied by, the forward-looking statements. Factors that could cause such differences include, but are not limited to, the
impact on us and our customers of a decline in general economic conditions and any regulatory responses thereto; slower economic growth rates or potential recession in the United States and our market areas uncertainty or perceived
instability in the banking industry as a whole; increased competition for deposits in our market areas among traditional and nontraditional financial services companies, and related changes in deposit customer behavior; the impact of changes
in market interest rates, whether due to a continuation of the elevated interest rate environment or further reductions in interest rates and a resulting decline in net interest income; the lingering inflationary pressures, and the risk of
the resurgence of elevated levels of inflation, in the United States and our market areas; the uncertain impacts of current and future monetary policies of the Board of Governors of the Federal Reserve System; changes in unemployment rates in
the United States and our market areas; adverse changes in customer spending, borrowing and savings habits; declines in commercial real estate values and prices; a deterioration of the credit rating for U.S. long-term sovereign debt or the
impact of uncertain or changing political conditions, including federal government shutdowns and uncertainty regarding United States fiscal debt, deficit and budget matters; cyber incidents or other failures, disruptions or breaches of our
operational or security systems or infrastructure, or those of our third-party vendors or other service providers, including as a result of cyber-attacks; severe weather, natural disasters, military conflicts (including the conflicts in the
Middle East, the possible expansion of such conflicts and potential geopolitical and economic consequences), acts of terrorism, geopolitical instability, domestic civil unrest or other external events, including as a result of the impact of
the policies of the current U.S. presidential administration or Congress; the impacts of tariffs, sanctions, and other trade policies of the United States and its global trading counterparts and the resulting impact on the Company and its
customers; competition and market expansion opportunities; changes in non-interest expenditures or in the anticipated benefits of such expenditures; the risks related to the development, implementation, use and management of emerging
technologies, including artificial intelligence and machine learning; potential costs related to the impacts of climate change; current or future litigation, regulatory examinations or other legal and/or regulatory actions; our ability to
recognize the expected benefits and synergies of our completed acquisitions; changes in accounting principles and standards, including those related to loan loss recognition under the current expected credit loss, or CECL, methodology; and
changes in applicable laws regulations, or policies in the United States. Due to these and other possible uncertainties and risks, South Plains can give no assurance that the results contemplated in the forward-looking statements will be
realized and readers are cautioned not to place undue reliance on the forward-looking statements contained in this presentation. Additional information regarding these factors and uncertainties to which South Plains’ business and future
financial performance are subject is contained in South Plains’ most recent Annual Report on Form 10-K and Quarterly Reports on Form 10-Q on file with the U.S. Securities and Exchange Commission (the “SEC”), including the sections entitled
"Risk Factors" and "Management's Discussion and Analysis of Financial Condition and Results of Operations“ of such documents, and other documents South Plains files or furnishes with the SEC from time to time, which are available on the SEC’s
website, www.sec.gov. Further, any forward-looking statement speaks only as of the date on which it is made and South Plains undertakes no obligation to update or revise any forward-looking statement to reflect events or circumstances after
the date on which the statement is made or to reflect the occurrence of unanticipated events, except as required by applicable law. All forward-looking statements, express or implied, herein are qualified in their entirety by this cautionary
statement. NON-GAAP FINANCIAL MEASURES Management believes that certain non-GAAP performance measures used in this presentation provide meaningful information about underlying trends in its business and operations and provide both
management and investors a more complete understanding of the Company’s financial position and performance. Non-GAAP financial measures should be viewed in addition to, and not as an alternative for, SPFI’s reported results prepared in
accordance with GAAP. Non-GAAP financial measures have limitations as analytical tools, and investors should not consider them in isolation or as a substitute for analysis of the results or financial condition of the Company as reported under
GAAP. Numbers in this presentation may not sum due to rounding. 2

Today’s Speakers Curtis C. Griffith
Chairman & Chief Executive Officer Elected to the board of directors of First State Bank of Morton, Texas, in 1972 and employed by it in 1979 Elected Chairman of the First State Bank of Morton board in 1984 Chairman of the Board of
City Bank and the Company since 1993 Steven B. Crockett
Chief Financial Officer & Treasurer Appointed Chief Financial Officer in 2015 Previously Controller of City Bank and the Company for 14 and 5 years respectively Began career in public accounting in 1994 by serving for seven years with
a local firm in Lubbock, Texas Cory T. Newsom
President Entire banking career with the Company focused on lending and operations Appointed President and Chief Executive Officer of the Bank in 2008 Joined the Board in 2008 3
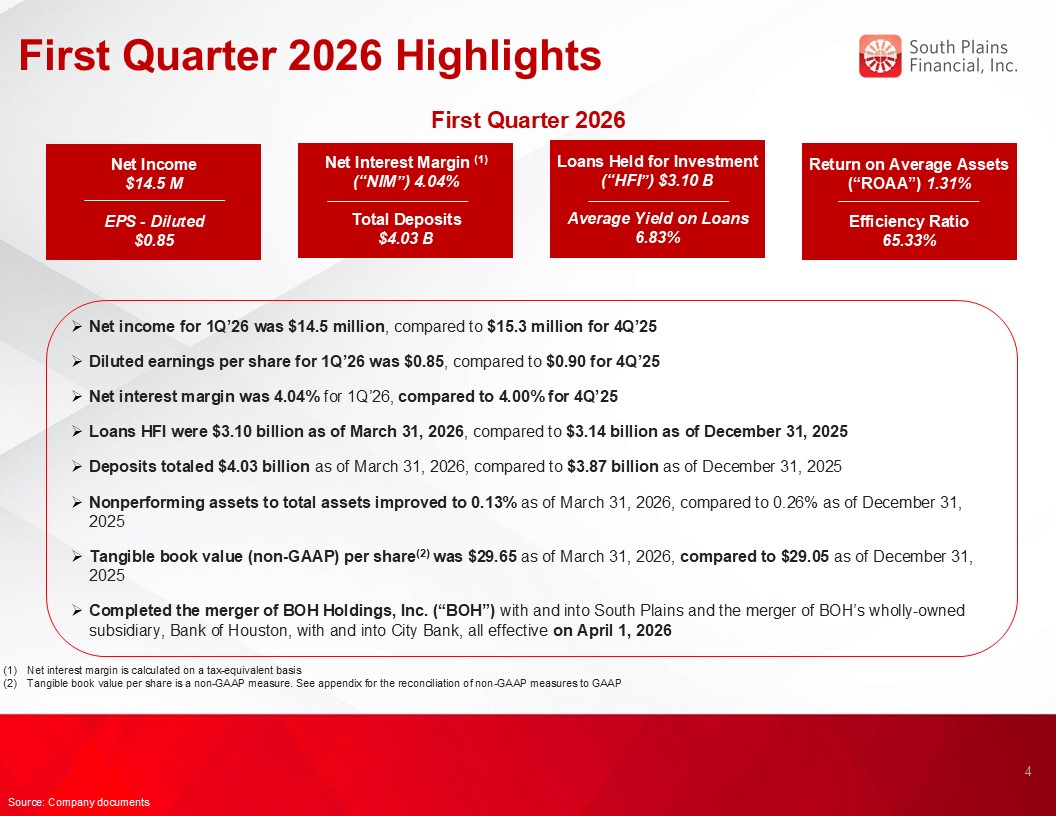
First Quarter 2026 Highlights Net income for 1Q’26 was $14.5 million, compared
to $15.3 million for 4Q’25 Diluted earnings per share for 1Q’26 was $0.85, compared to $0.90 for 4Q’25 Net interest margin was 4.04% for 1Q’26, compared to 4.00% for 4Q’25 Loans HFI were $3.10 billion as of March 31, 2026, compared to
$3.14 billion as of December 31, 2025 Deposits totaled $4.03 billion as of March 31, 2026, compared to $3.87 billion as of December 31, 2025 Nonperforming assets to total assets improved to 0.13% as of March 31, 2026, compared to 0.26% as
of December 31, 2025 Tangible book value (non-GAAP) per share(2) was $29.65 as of March 31, 2026, compared to $29.05 as of December 31, 2025 Completed the merger of BOH Holdings, Inc. (“BOH”) with and into South Plains and the merger of
BOH’s wholly-owned subsidiary, Bank of Houston, with and into City Bank, all effective on April 1, 2026 4 Source: Company documents Net interest margin is calculated on a tax-equivalent basis Tangible book value per share is a non-GAAP
measure. See appendix for the reconciliation of non-GAAP measures to GAAP Loans Held for Investment (“HFI”) $3.10 B Average Yield on Loans 6.83% Net Income $14.5 M EPS - Diluted $0.85 Net Interest Margin (1) (“NIM”) 4.04% Total
Deposits $4.03 B Return on Average Assets (“ROAA”) 1.31% Efficiency Ratio 65.33% First Quarter 2026
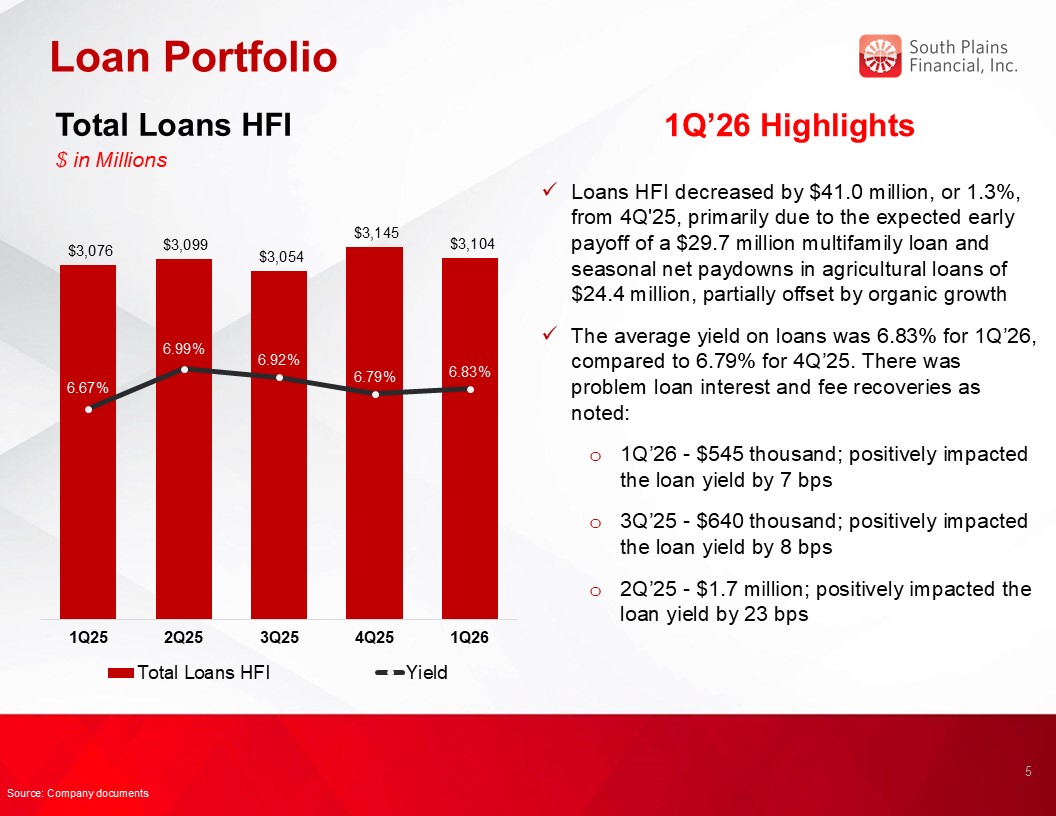
Loan Portfolio 1Q’26 Highlights Loans HFI decreased by $41.0 million, or 1.3%,
from 4Q'25, primarily due to the expected early payoff of a $29.7 million multifamily loan and seasonal net paydowns in agricultural loans of $24.4 million, partially offset by organic growth The average yield on loans was 6.83% for 1Q’26,
compared to 6.79% for 4Q’25. There was problem loan interest and fee recoveries as noted: 1Q’26 - $545 thousand; positively impacted the loan yield by 7 bps 3Q’25 - $640 thousand; positively impacted the loan yield by 8 bps 2Q’25 - $1.7
million; positively impacted the loan yield by 23 bps Total Loans HFI $ in Millions 5 Source: Company documents
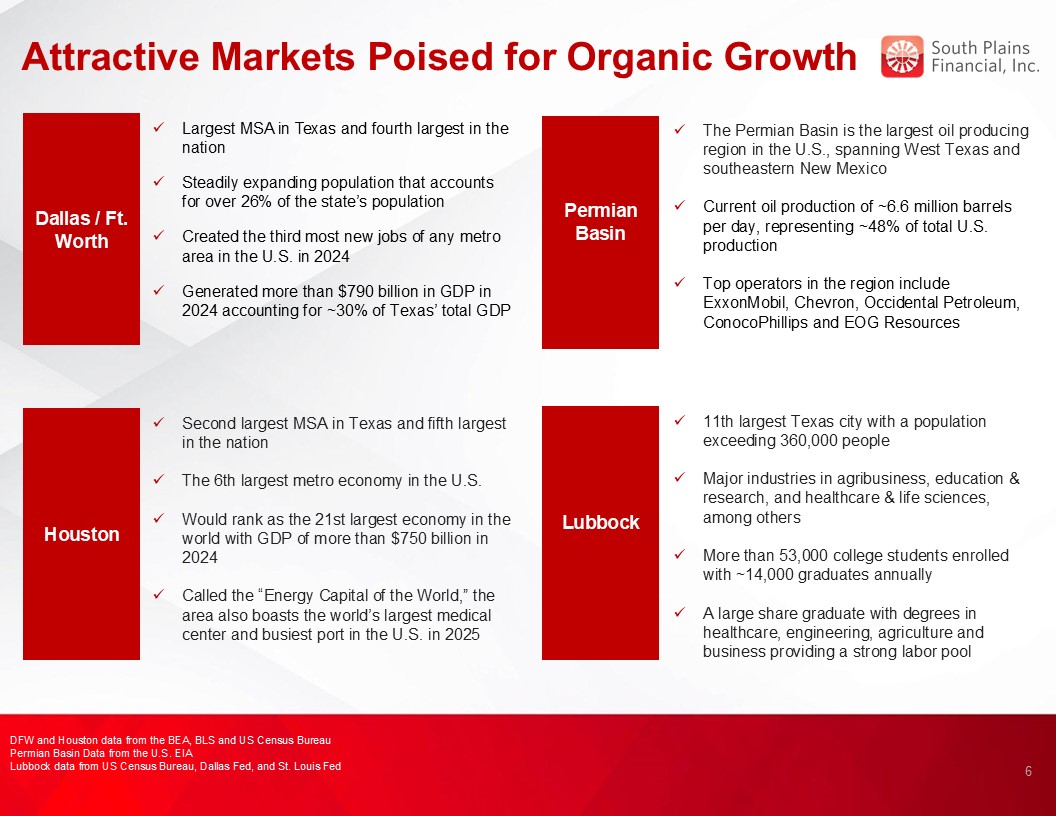
Attractive Markets Poised for Organic Growth Permian Basin Basin Dallas / Ft.
Worth The Permian Basin is the largest oil producing region in the U.S., spanning West Texas and southeastern New Mexico Current oil production of ~6.6 million barrels per day, representing ~48% of total U.S. production Top operators in
the region include ExxonMobil, Chevron, Occidental Petroleum, ConocoPhillips and EOG Resources Largest MSA in Texas and fourth largest in the nation Steadily expanding population that accounts for over 26% of the state’s population Created
the third most new jobs of any metro area in the U.S. in 2024 Generated more than $790 billion in GDP in 2024 accounting for ~30% of Texas’ total GDP Houston Second largest MSA in Texas and fifth largest in the nation The 6th largest
metro economy in the U.S. Would rank as the 21st largest economy in the world with GDP of more than $750 billion in 2024 Called the “Energy Capital of the World,” the area also boasts the world’s largest medical center and busiest port in
the U.S. in 2025 Lubbock Basin 11th largest Texas city with a population exceeding 360,000 people Major industries in agribusiness, education & research, and healthcare & life sciences, among others More than 53,000 college
students enrolled with ~14,000 graduates annually A large share graduate with degrees in healthcare, engineering, agriculture and business providing a strong labor pool 6 DFW and Houston data from the BEA, BLS and US Census
Bureau Permian Basin Data from the U.S. EIA Lubbock data from US Census Bureau, Dallas Fed, and St. Louis Fed
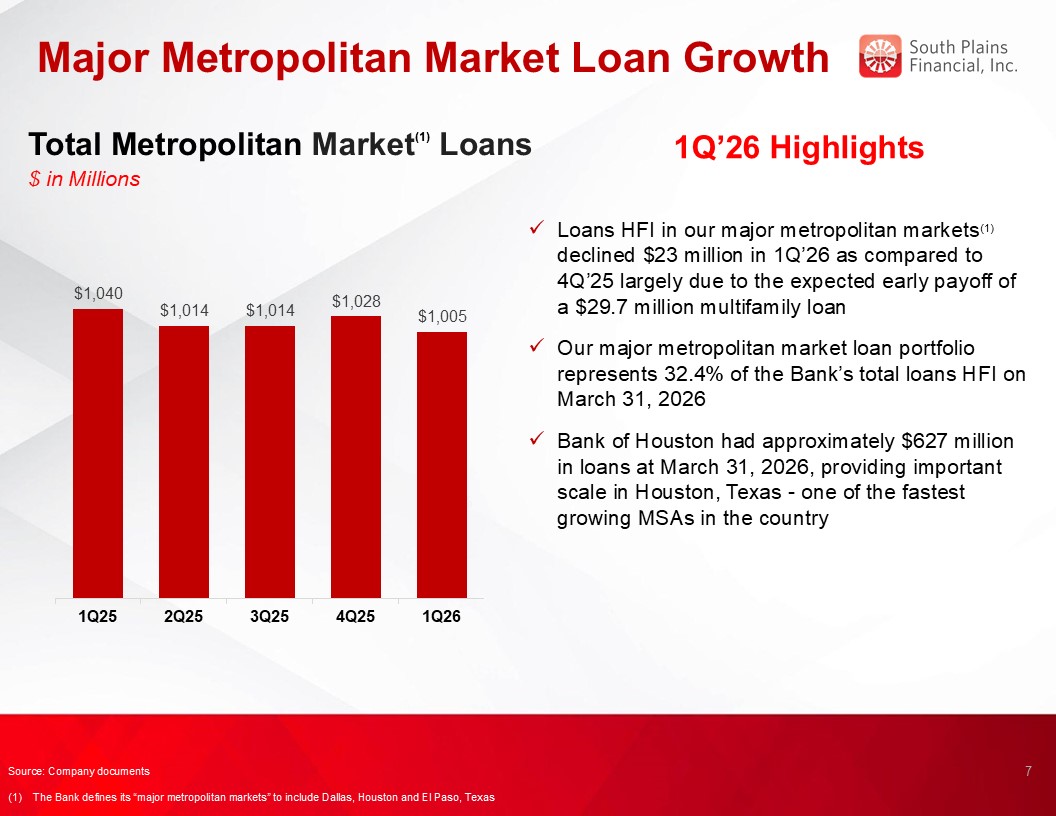
Major Metropolitan Market Loan Growth 1Q’26 Highlights Loans HFI in our major
metropolitan markets(1) declined $23 million in 1Q’26 as compared to 4Q’25 largely due to the expected early payoff of a $29.7 million multifamily loan Our major metropolitan market loan portfolio represents 32.4% of the Bank’s total loans
HFI on March 31, 2026 Bank of Houston had approximately $627 million in loans at March 31, 2026, providing important scale in Houston, Texas - one of the fastest growing MSAs in the country Total Metropolitan Market(1) Loans $ in
Millions 7 5.00% Source: Company documents (1) The Bank defines its “major metropolitan markets” to include Dallas, Houston and El Paso, Texas
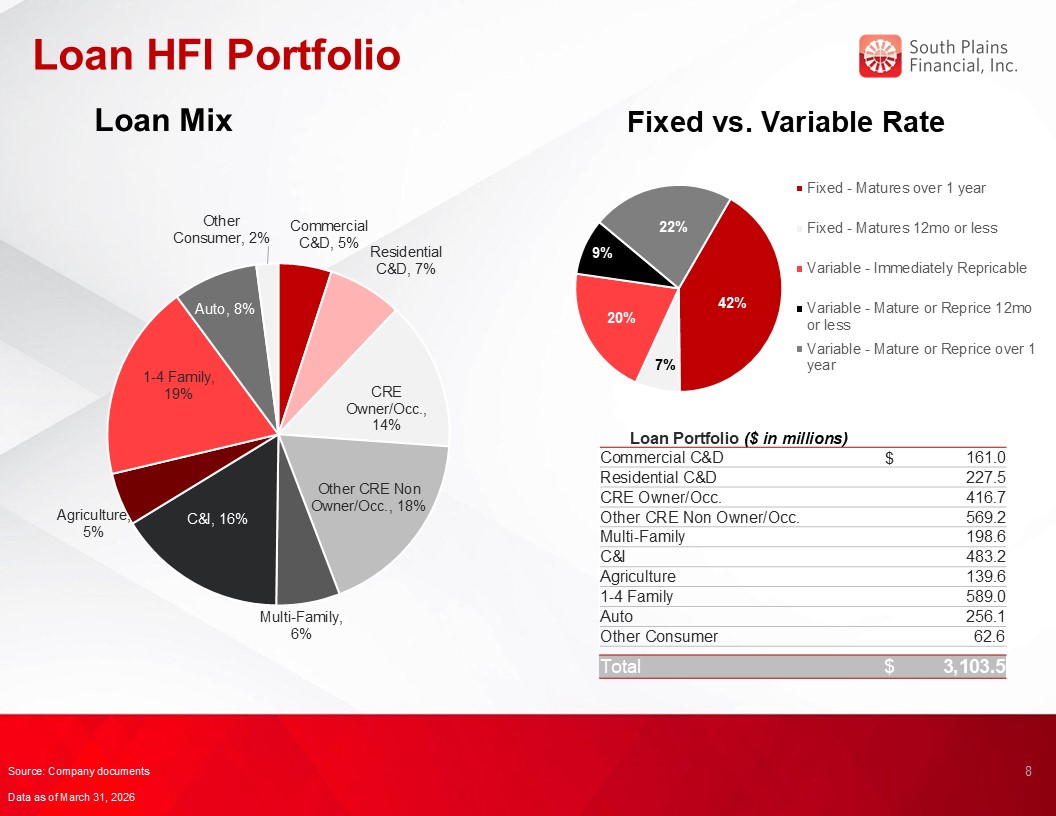
Loan HFI Portfolio Loan Mix Loan Portfolio ($ in millions) Commercial
C&D $ 161.0 Residential C&D 227.5 CRE Owner/Occ. 416.7 Other CRE Non Owner/Occ. 569.2 Multi-Family 198.6 C&I 483.2 Agriculture 139.6 1-4 Family 589.0 Auto 256.1 Other
Consumer 62.6 Total $ 3,103.5 Fixed vs. Variable Rate 8 Source: Company documents Data as of March 31, 2026
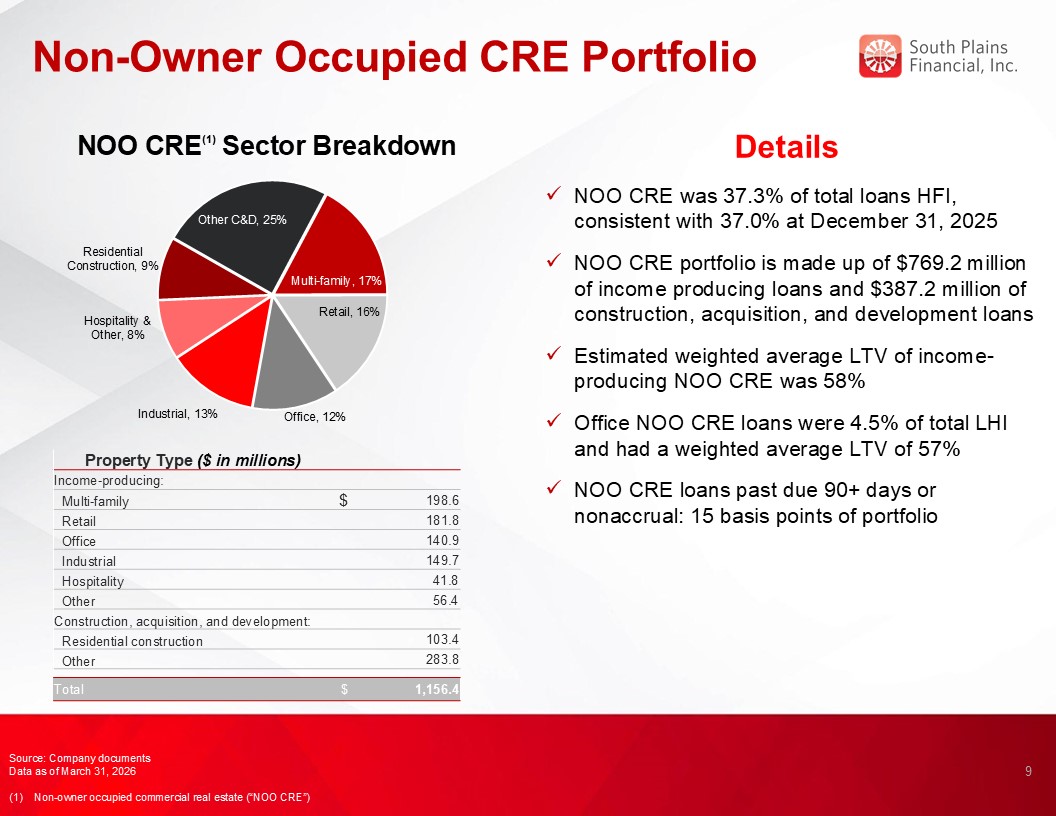
Non-Owner Occupied CRE Portfolio 9 Details NOO CRE was 37.3% of total loans
HFI, consistent with 37.0% at December 31, 2025 NOO CRE portfolio is made up of $769.2 million of income producing loans and $387.2 million of construction, acquisition, and development loans Estimated weighted average LTV of
income-producing NOO CRE was 58% Office NOO CRE loans were 4.5% of total LHI and had a weighted average LTV of 57% NOO CRE loans past due 90+ days or nonaccrual: 15 basis points of portfolio NOO CRE(1) Sector Breakdown Source: Company
documents Data as of March 31, 2026 (1) Non-owner occupied commercial real estate (“NOO CRE”) Property Type ($ in millions) Income-producing: Multi-family $ 198.6 Retail 181.8 Office 140.9 Industrial 149.7
Hospitality 41.8 Other 56.4 Construction, acquisition, and development: Residential construction 103.4 Other 283.8 Total $ 1,156.4
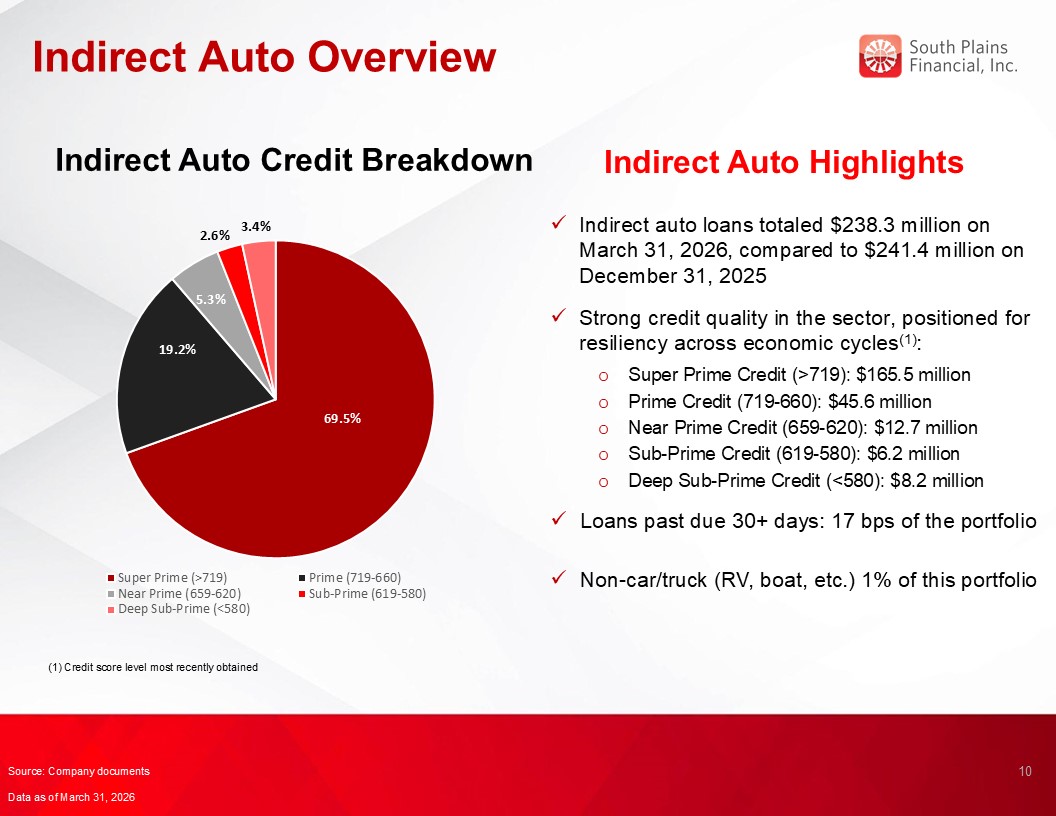
Indirect Auto Overview Indirect Auto Highlights Indirect auto loans totaled
$238.3 million on March 31, 2026, compared to $241.4 million on December 31, 2025 Strong credit quality in the sector, positioned for resiliency across economic cycles(1): Super Prime Credit (>719): $165.5 million Prime Credit
(719-660): $45.6 million Near Prime Credit (659-620): $12.7 million Sub-Prime Credit (619-580): $6.2 million Deep Sub-Prime Credit (<580): $8.2 million Loans past due 30+ days: 17 bps of the portfolio Non-car/truck (RV, boat, etc.) 1%
of this portfolio Indirect Auto Credit Breakdown 10 Source: Company documents Data as of March 31, 2026 (1) Credit score level most recently obtained
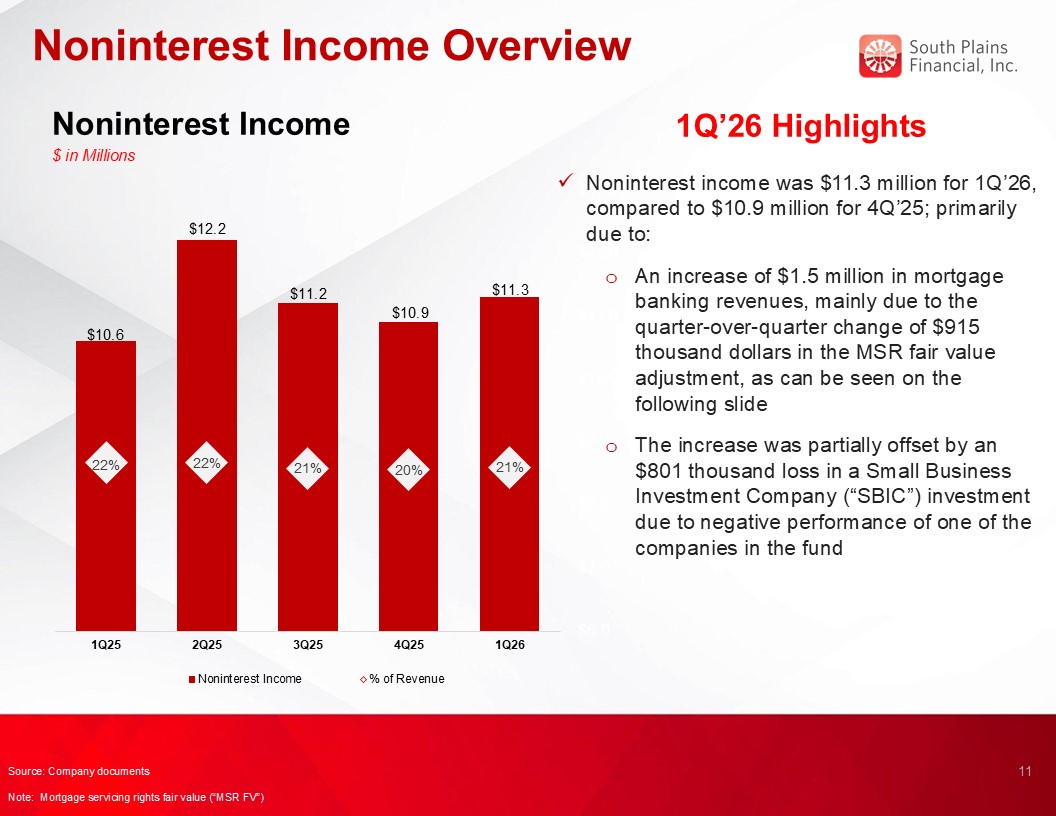
Noninterest Income Overview Noninterest Income $ in Millions 1Q’26
Highlights Noninterest income was $11.3 million for 1Q’26, compared to $10.9 million for 4Q’25; primarily due to: An increase of $1.5 million in mortgage banking revenues, mainly due to the quarter-over-quarter change of $915 thousand
dollars in the MSR fair value adjustment, as can be seen on the following slide The increase was partially offset by an $801 thousand loss in a Small Business Investment Company (“SBIC”) investment due to negative performance of one of the
companies in the fund 11 Source: Company documents Note: Mortgage servicing rights fair value (“MSR FV”)
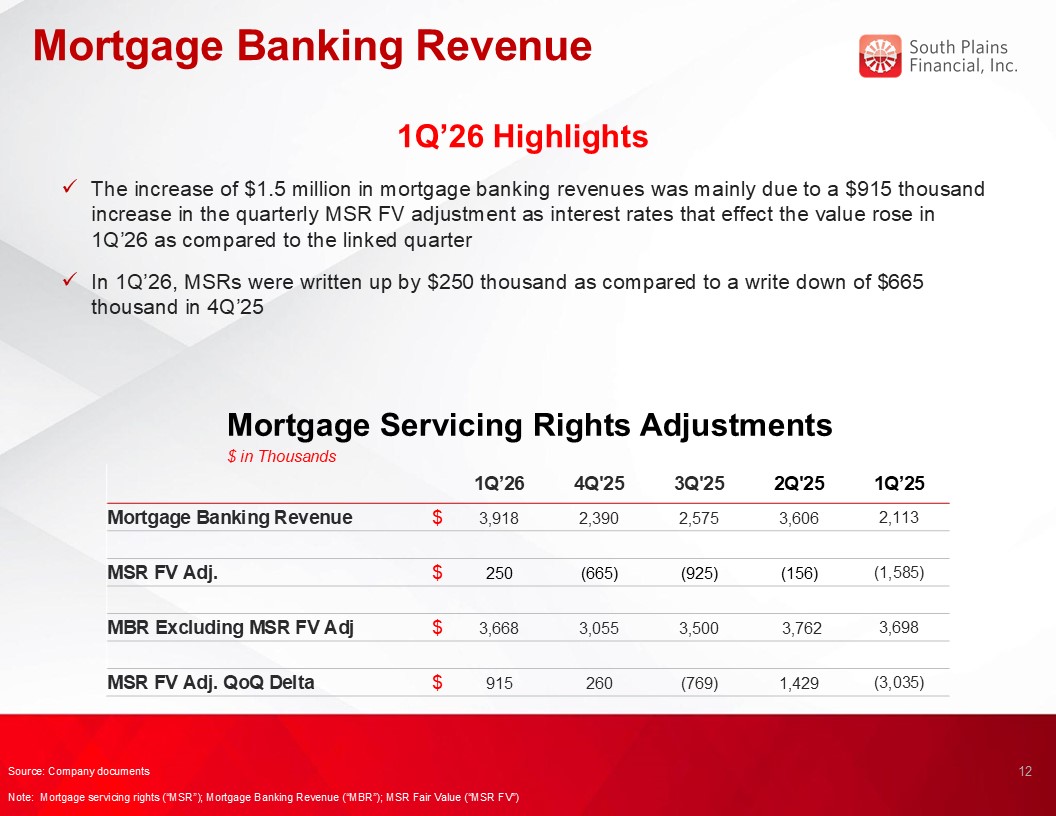
Mortgage Banking Revenue Mortgage Servicing Rights Adjustments $ in
Thousands 1Q’26 Highlights The increase of $1.5 million in mortgage banking revenues was mainly due to a $915 thousand increase in the quarterly MSR FV adjustment as interest rates that effect the value rose in 1Q’26 as compared to the
linked quarter In 1Q’26, MSRs were written up by $250 thousand as compared to a write down of $665 thousand in 4Q’25 12 Source: Company documents Note: Mortgage servicing rights (“MSR”); Mortgage Banking Revenue (“MBR”); MSR Fair Value
(“MSR FV”) 1Q’26 4Q'25 3Q'25 2Q'25 1Q’25 Mortgage Banking Revenue $ 3,918 2,390 2,575 3,606 2,113 MSR FV Adj. $ 250 (665) (925) (156) (1,585) MBR Excluding MSR FV
Adj $ 3,668 3,055 3,500 3,762 3,698 MSR FV Adj. QoQ Delta $ 915 260 (769) 1,429 (3,035)
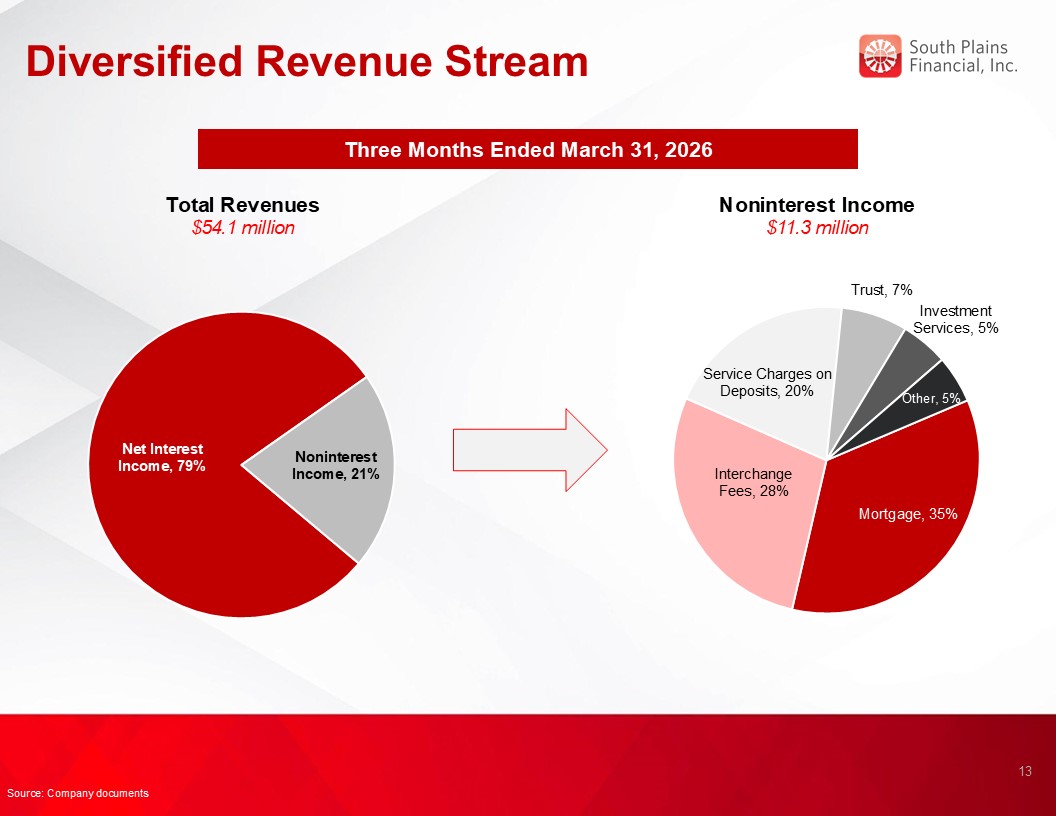
Diversified Revenue Stream Three Months Ended March 31, 2026 Total
Revenues $54.1 million Noninterest Income $11.3 million 13 Source: Company documents
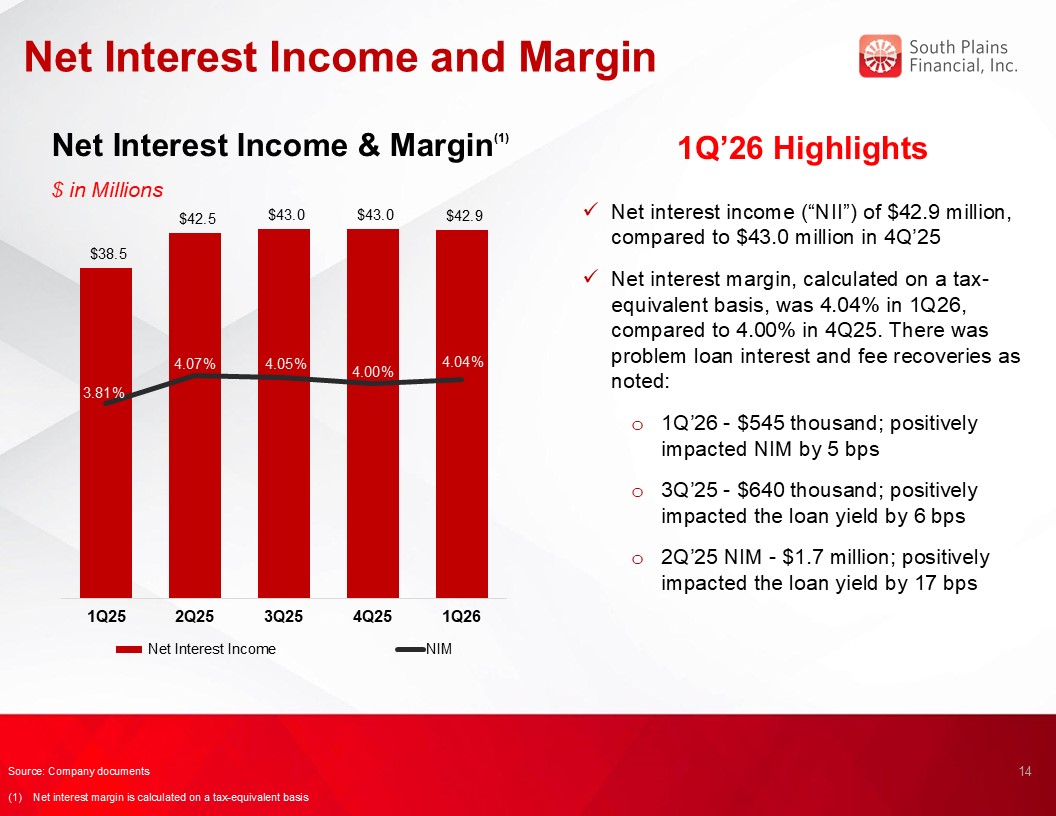
Net Interest Income and Margin Net Interest Income & Margin(1) $ in
Millions 1Q’26 Highlights Net interest income (“NII”) of $42.9 million, compared to $43.0 million in 4Q’25 Net interest margin, calculated on a tax-equivalent basis, was 4.04% in 1Q26, compared to 4.00% in 4Q25. There was problem loan
interest and fee recoveries as noted: 1Q’26 - $545 thousand; positively impacted NIM by 5 bps 3Q’25 - $640 thousand; positively impacted the loan yield by 6 bps 2Q’25 NIM - $1.7 million; positively impacted the loan yield by 17
bps 14 3.54% Source: Company documents (1) Net interest margin is calculated on a tax-equivalent basis
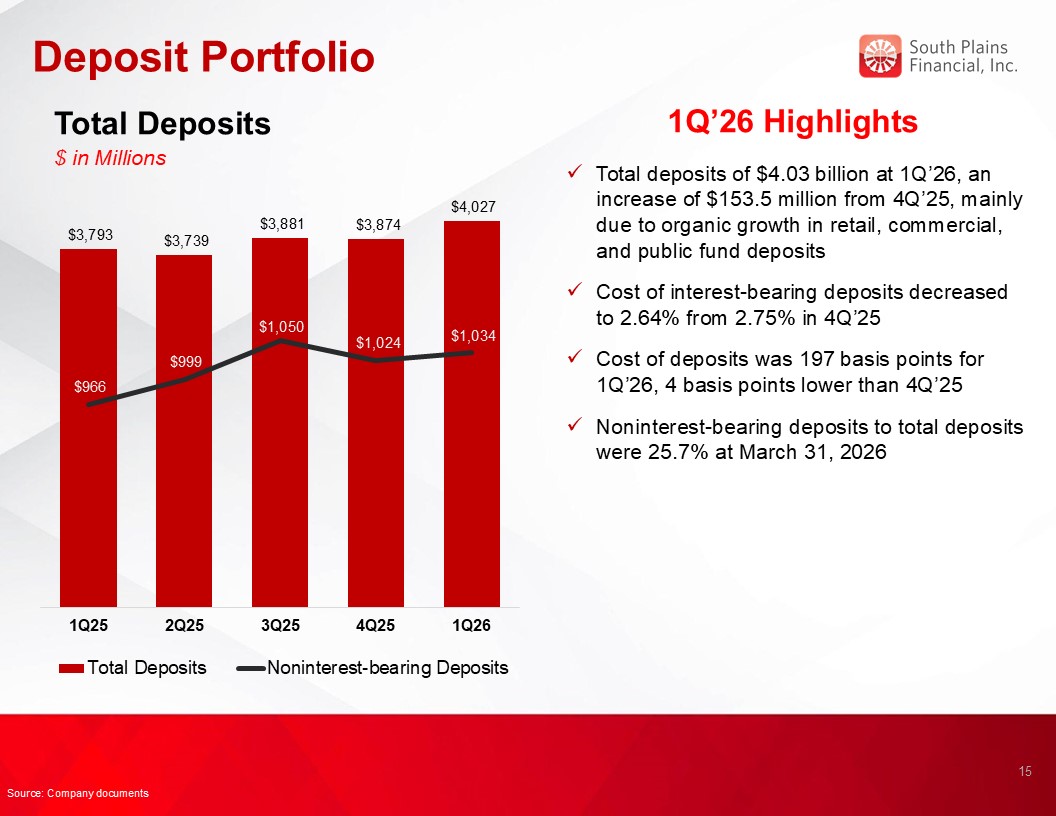
Deposit Portfolio Total Deposits $ in Millions 1Q’26 Highlights Total
deposits of $4.03 billion at 1Q’26, an increase of $153.5 million from 4Q’25, mainly due to organic growth in retail, commercial, and public fund deposits Cost of interest-bearing deposits decreased to 2.64% from 2.75% in 4Q’25 Cost of
deposits was 197 basis points for 1Q’26, 4 basis points lower than 4Q’25 Noninterest-bearing deposits to total deposits were 25.7% at March 31, 2026 15 Source: Company documents
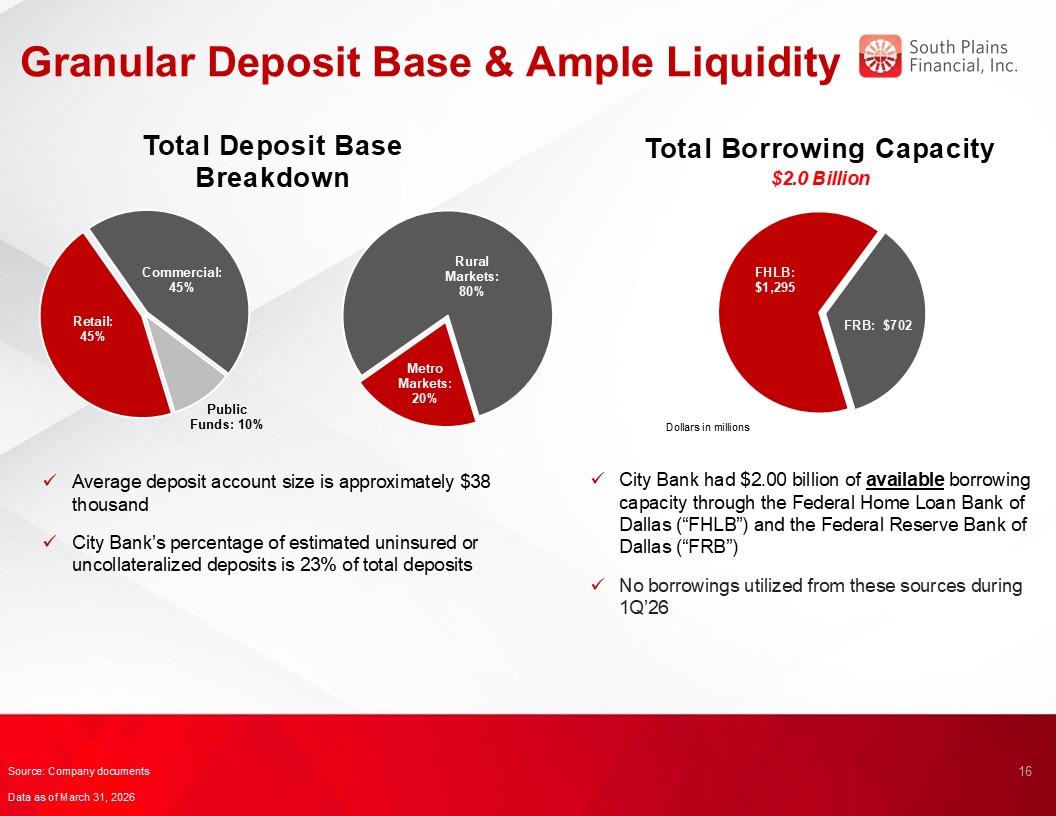
Granular Deposit Base & Ample Liquidity Total Borrowing Capacity $2.0
Billion 16 Total Deposit Base Breakdown Average deposit account size is approximately $38 thousand City Bank’s percentage of estimated uninsured or uncollateralized deposits is 23% of total deposits City Bank had $2.00 billion of
available borrowing capacity through the Federal Home Loan Bank of Dallas (“FHLB”) and the Federal Reserve Bank of Dallas (“FRB”) No borrowings utilized from these sources during 1Q’26 Source: Company documents Data as of March 31, 2026
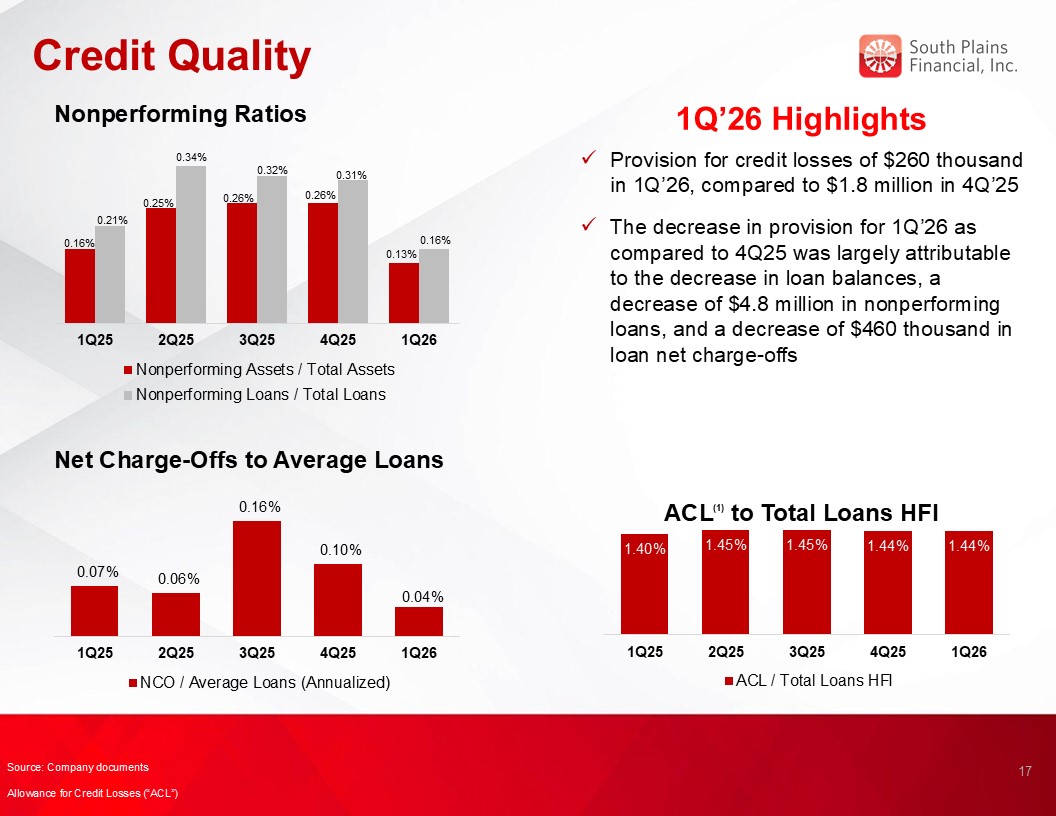
Credit Quality 1Q’26 Highlights Nonperforming Ratios Net Charge-Offs to
Average Loans ACL(1) to Total Loans HFI 17 Provision for credit losses of $260 thousand in 1Q’26, compared to $1.8 million in 4Q’25 The decrease in provision for 1Q’26 as compared to 4Q25 was largely attributable to the decrease in loan
balances, a decrease of $4.8 million in nonperforming loans, and a decrease of $460 thousand in loan net charge-offs Source: Company documents Allowance for Credit Losses (“ACL”)
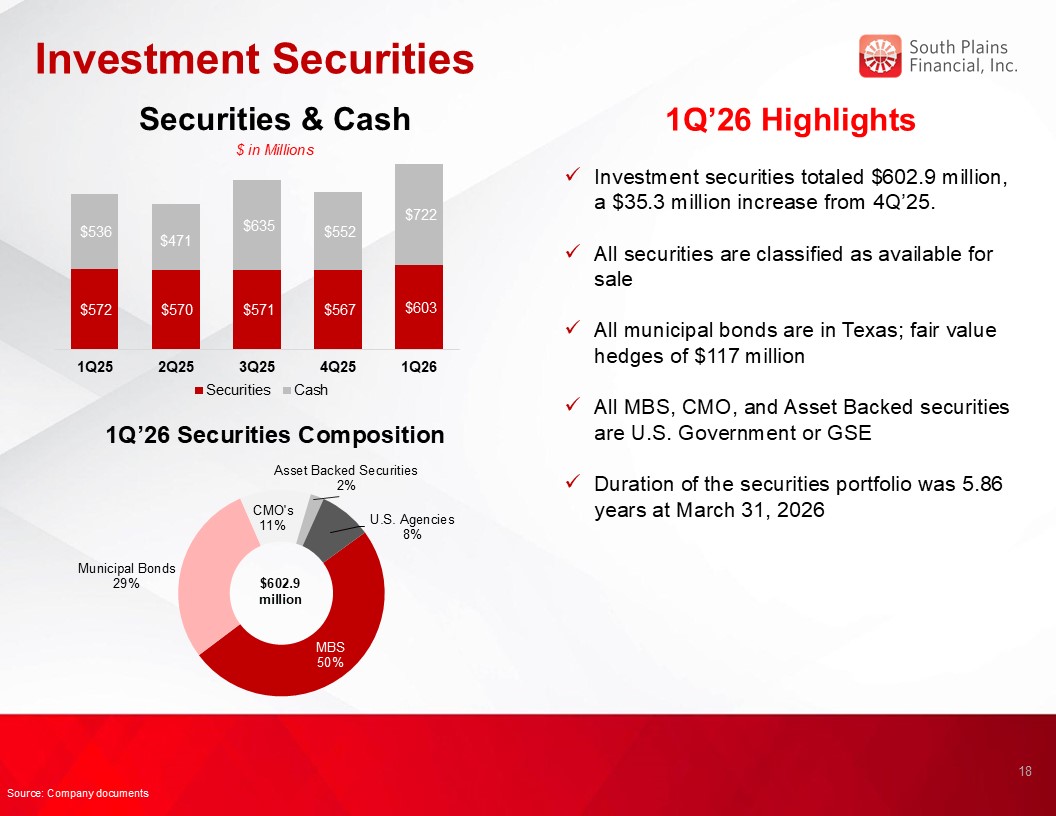
Investment Securities 1Q’26 Highlights Investment securities totaled $602.9
million, a $35.3 million increase from 4Q’25. All securities are classified as available for sale All municipal bonds are in Texas; fair value hedges of $117 million All MBS, CMO, and Asset Backed securities are U.S. Government or
GSE Duration of the securities portfolio was 5.86 years at March 31, 2026 1Q’26 Securities Composition $602.9 million Securities & Cash $ in Millions 18 Source: Company documents
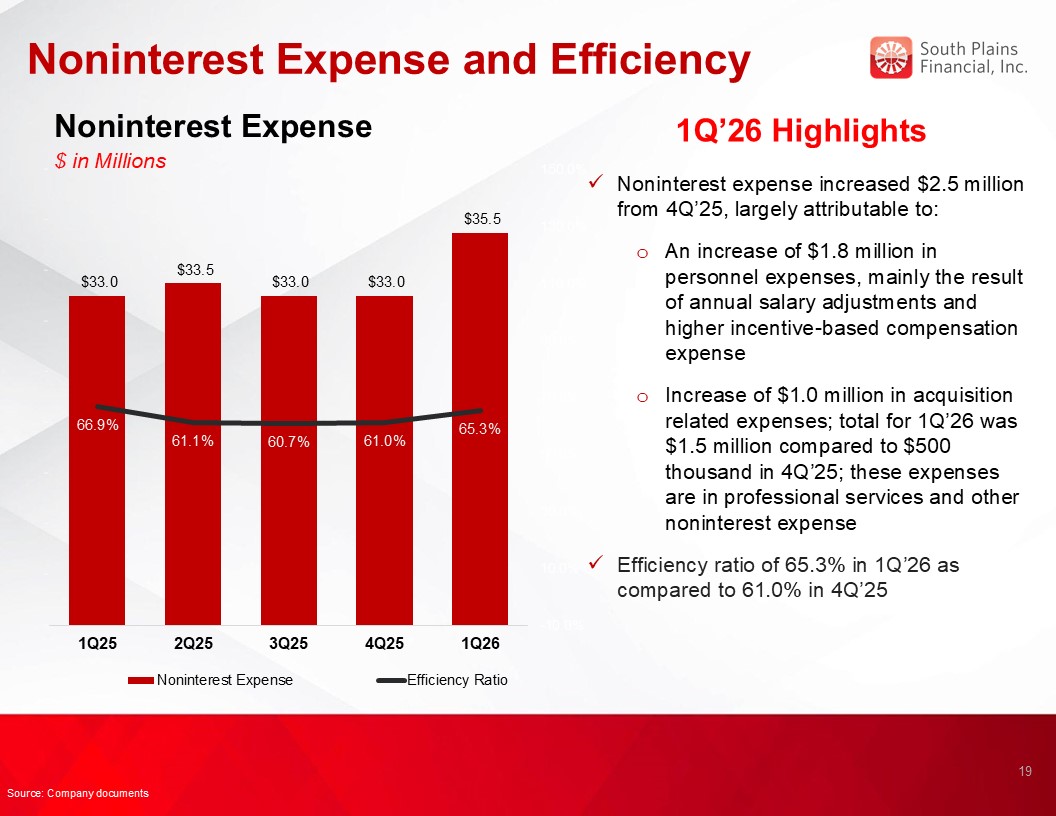
Noninterest Expense and Efficiency Noninterest Expense $ in Millions 1Q’26
Highlights Noninterest expense increased $2.5 million from 4Q’25, largely attributable to: An increase of $1.8 million in personnel expenses, mainly the result of annual salary adjustments and higher incentive-based compensation
expense Increase of $1.0 million in acquisition related expenses; total for 1Q’26 was $1.5 million compared to $500 thousand in 4Q’25; these expenses are in professional services and other noninterest expense Efficiency ratio of 65.3% in
1Q’26 as compared to 61.0% in 4Q’25 19 Source: Company documents
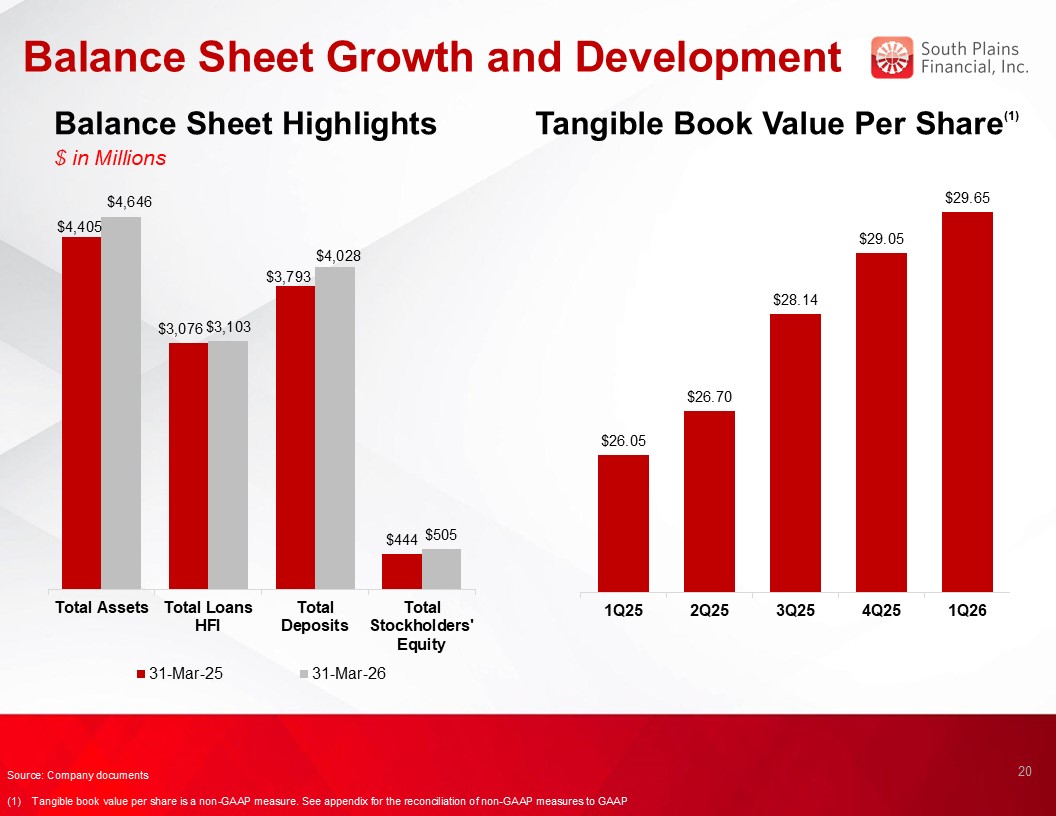
Balance Sheet Growth and Development Balance Sheet Highlights $ in
Millions Tangible Book Value Per Share(1) 20 Source: Company documents (1) Tangible book value per share is a non-GAAP measure. See appendix for the reconciliation of non-GAAP measures to GAAP
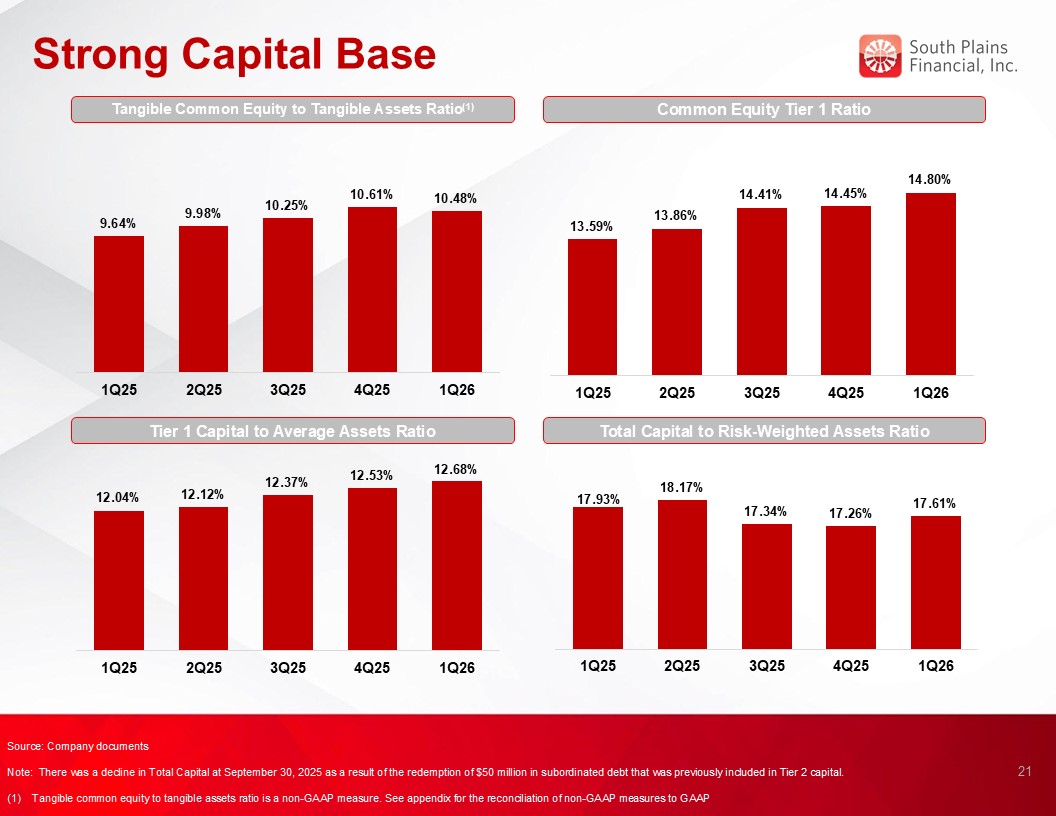
Strong Capital Base Common Equity Tier 1 Ratio Tier 1 Capital to Average
Assets Ratio Total Capital to Risk-Weighted Assets Ratio 21 Source: Company documents Note: There was a decline in Total Capital at September 30, 2025 as a result of the redemption of $50 million in subordinated debt that was previously
included in Tier 2 capital. (1) Tangible common equity to tangible assets ratio is a non-GAAP measure. See appendix for the reconciliation of non-GAAP measures to GAAP Tangible Common Equity to Tangible Assets Ratio(1)
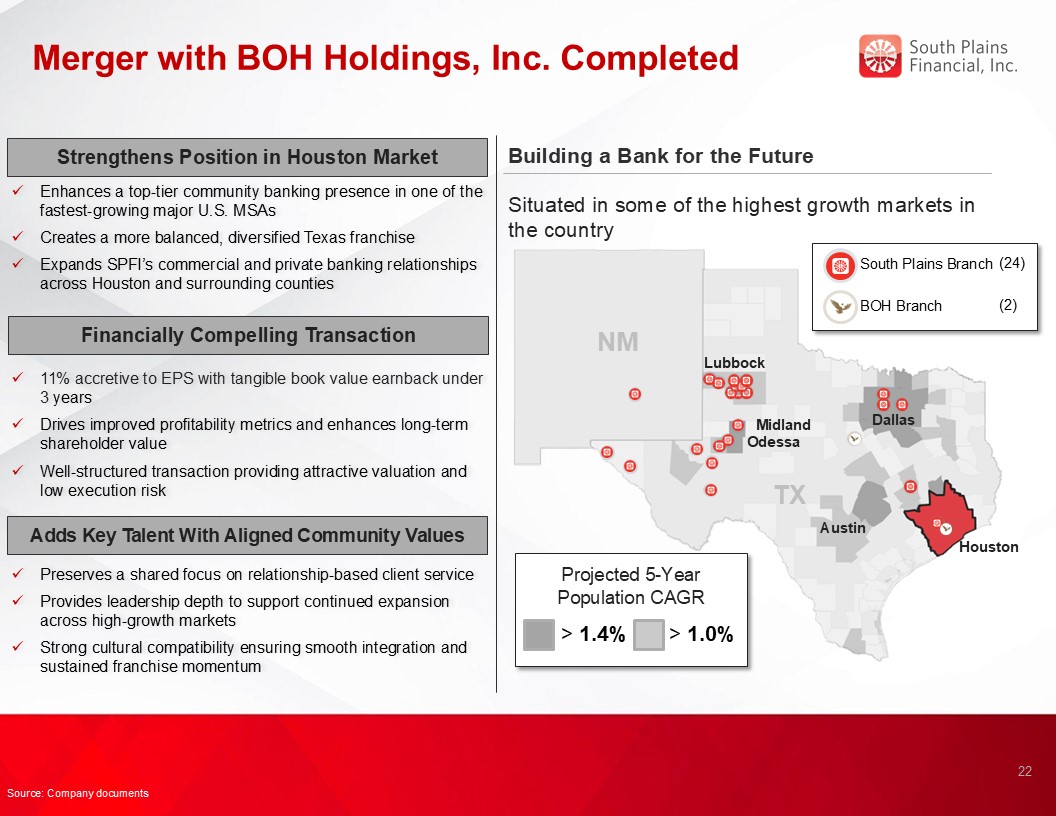
Merger with BOH Holdings, Inc. Completed Building a Bank for the
Future Houston Odessa Austin Midland > 1.4% Situated in some of the highest growth markets in the country Projected 5-Year Population CAGR > 1.0% TX NM Lubbock Dallas South Plains Branch (24) BOH
Branch (2) 22 Strengthens Position in Houston Market Enhances a top-tier community banking presence in one of the fastest-growing major U.S. MSAs Creates a more balanced, diversified Texas franchise Expands SPFI’s commercial and private
banking relationships across Houston and surrounding counties 11% accretive to EPS with tangible book value earnback under 3 years Drives improved profitability metrics and enhances long-term shareholder value Well-structured transaction
providing attractive valuation and low execution risk Financially Compelling Transaction Preserves a shared focus on relationship-based client service Provides leadership depth to support continued expansion across high-growth
markets Strong cultural compatibility ensuring smooth integration and sustained franchise momentum Adds Key Talent With Aligned Community Values Source: Company documents
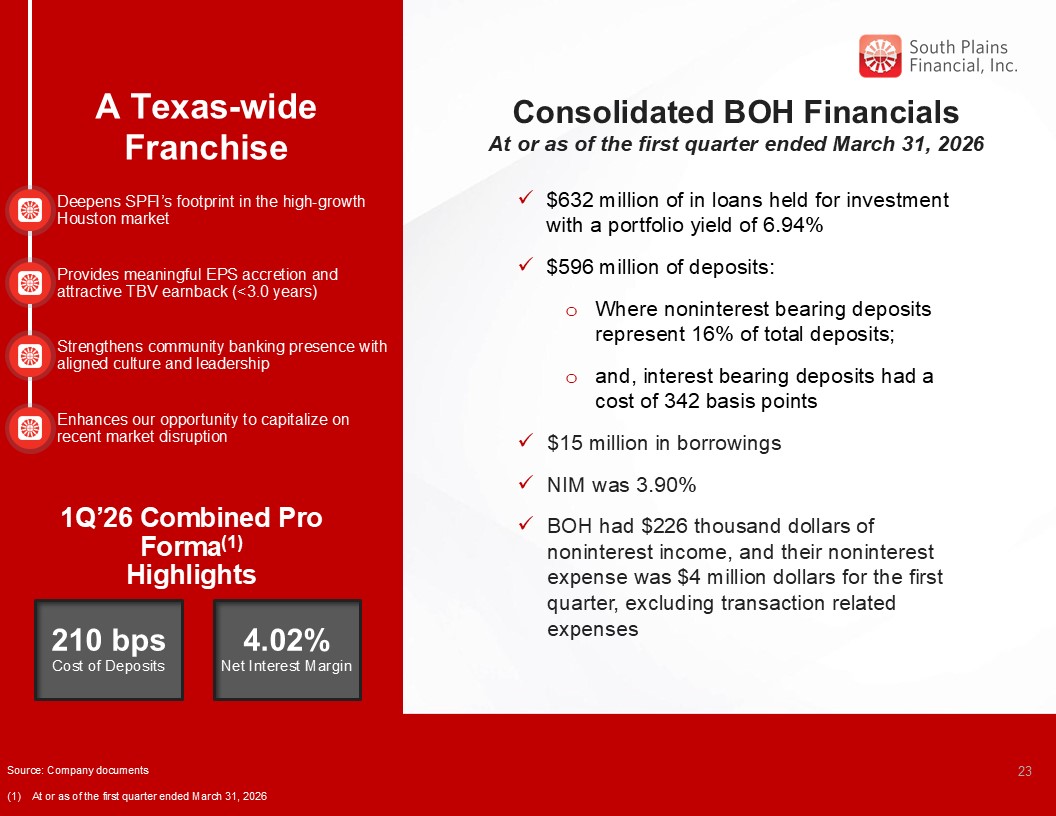
A Texas-wide Franchise 1Q’26 Combined Pro Forma(1) Highlights 210 bps Cost
of Deposits 4.02% Net Interest Margin Deepens SPFI’s footprint in the high-growth Houston market Provides meaningful EPS accretion and attractive TBV earnback (<3.0 years) Strengthens community banking presence with aligned culture
and leadership Consolidated BOH Financials At or as of the first quarter ended March 31, 2026 Enhances our opportunity to capitalize on recent market disruption 23 $632 million of in loans held for investment with a portfolio yield of
6.94% $596 million of deposits: Where noninterest bearing deposits represent 16% of total deposits; and, interest bearing deposits had a cost of 342 basis points $15 million in borrowings NIM was 3.90% BOH had $226 thousand dollars of
noninterest income, and their noninterest expense was $4 million dollars for the first quarter, excluding transaction related expenses Source: Company documents (1) At or as of the first quarter ended March 31, 2026
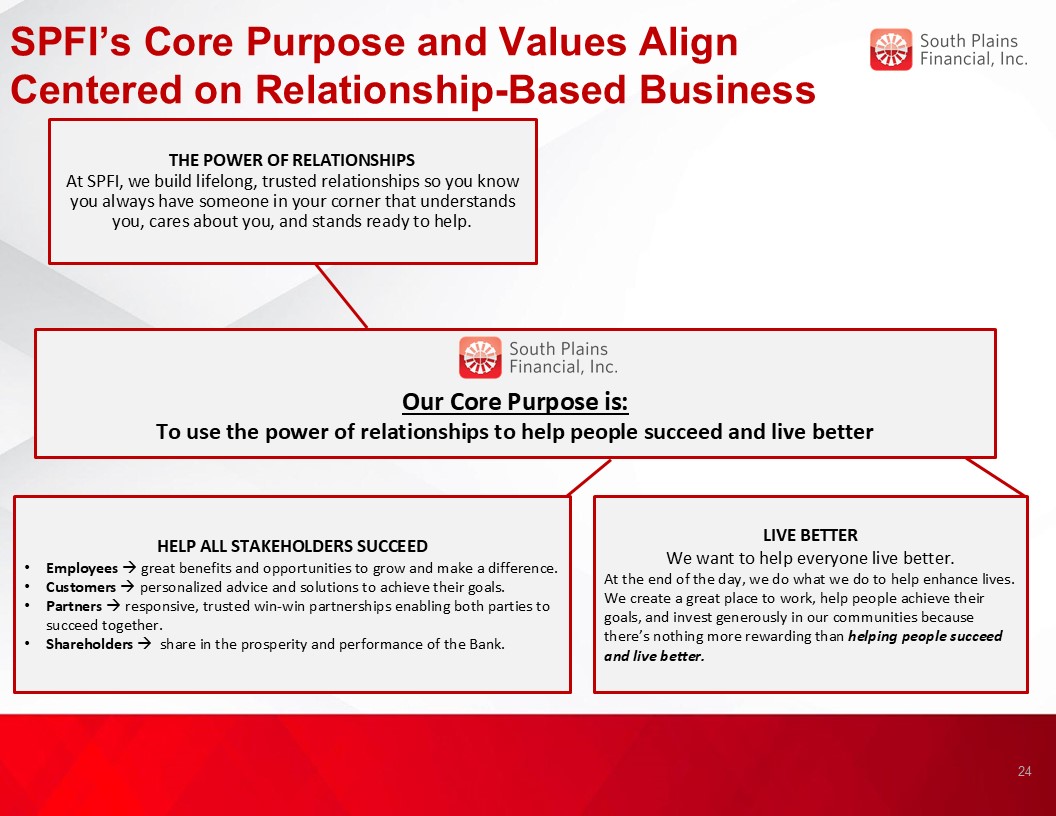
SPFI’s Core Purpose and Values Align Centered on Relationship-Based
Business Our Core Purpose is: To use the power of relationships to help people succeed and live better HELP ALL STAKEHOLDERS SUCCEED Employees great benefits and opportunities to grow and make a difference. Customers personalized
advice and solutions to achieve their goals. Partners responsive, trusted win-win partnerships enabling both parties to succeed together. Shareholders share in the prosperity and performance of the Bank. THE POWER OF RELATIONSHIPS At
SPFI, we build lifelong, trusted relationships so you know you always have someone in your corner that understands you, cares about you, and stands ready to help. LIVE BETTER We want to help everyone live better. At the end of the day,
we do what we do to help enhance lives. We create a great place to work, help people achieve their goals, and invest generously in our communities because there’s nothing more rewarding than helping people succeed and live better. 24

Appendix 25
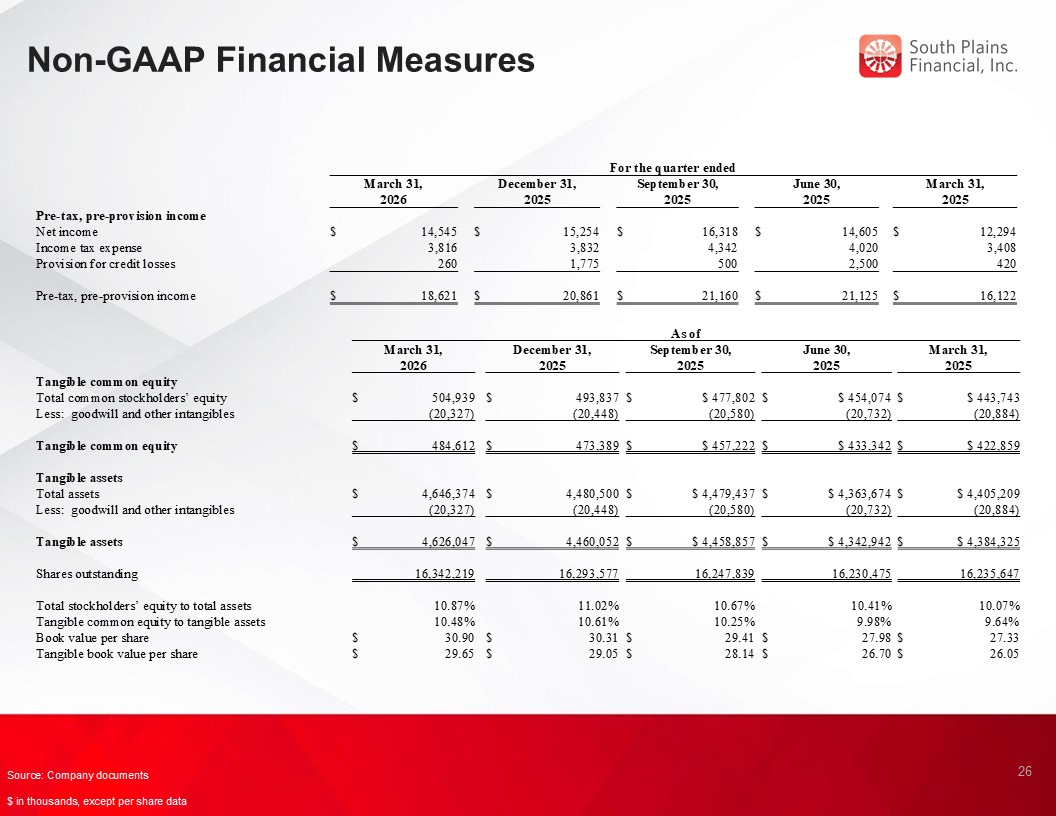
Non-GAAP Financial Measures 26 Source: Company documents $ in thousands,
except per share data For the quarter ended March 31, 2026 December 31, 2025 September 30, 2025 June 30, 2025 March 31, 2025 Pre-tax, pre-provision income Net
income $ 14,545 $ 15,254 $ 16,318 $ 14,605 $ 12,294 Income tax expense 3,816 3,832 4,342 4,020 3,408 Provision for credit losses 260 1,775 500 2,500 420 Pre-tax, pre-provision
income $ 18,621 $ 20,861 $ 21,160 $ 21,125 $ 16,122 As of March 31, 2026 December 31, 2025 September 30, 2025 June 30, 2025 March 31, 2025 Tangible common equity
Total common stockholders’ equity $ 504,939 $ 493,837 $ $ 477,802 $ $ 454,074 $ $ 443,743 Less: goodwill and other intangibles (20,327) (20,448) (20,580) (20,732) (20,884)
Tangible common equity $ 484,612 $ 473,389 $ $ 457,222 $ $ 433,342 $ $ 422,859 Tangible assets
Total assets $ 4,646,374 $ 4,480,500 $ $ 4,479,437 $ $ 4,363,674 $ $ 4,405,209 Less: goodwill and other intangibles (20,327) (20,448) (20,580) (20,732) (20,884)
Tangible assets $ 4,626,047 $ 4,460,052 $ $ 4,458,857 $ $ 4,342,942 $ $ 4,384,325 Shares outstanding 16,342,219 16,293,577
16,247,839 16,230,475 16,235,647 Total stockholders’ equity to total assets 10.87% 11.02% 10.67% 10.41% 10.07% Tangible common equity to tangible assets 10.48%
10.61% 10.25% 9.98% 9.64% Book value per share $ 30.90 $ 30.31 $ 29.41 $ 27.98 $ 27.33 Tangible book value per share $ 29.65 $ 29.05 $ 28.14 $ 26.70 $ 26.05