Pay vs Performance Disclosure - USD ($)
Dec. 31, 2025
Dec. 31, 2024
Dec. 31, 2023
PAY VERSUS PERFORMANCE
As required by Section 953(a) of the Dodd-Frank Wall Street Reform and Consumer Protection Act of 2010, and Item 402(v) of Regulation S-K, which was adopted by the SEC in 2022, we are providing the following information regarding the relationship between “compensation actually paid” (“CAP”) to our principal executive officer (“PEO”) and non-PEO Named Executive Officers (“NEOs”) and certain financial performance of the Company for the fiscal years listed below.
Fiscal Year | Summary Compensation Table Total for PEO(1) | CompensationActually Paid to PEO(1) | Average Summary Compensation Table Total for Non-PEO NEOs(2) | Average Compensation Actually Paid to Non-PEO NEOs(2) | Value of Initial Fixed $100 Investment Based On Total Stockholder Return(3) | Net Loss(4) | ||||||||||||
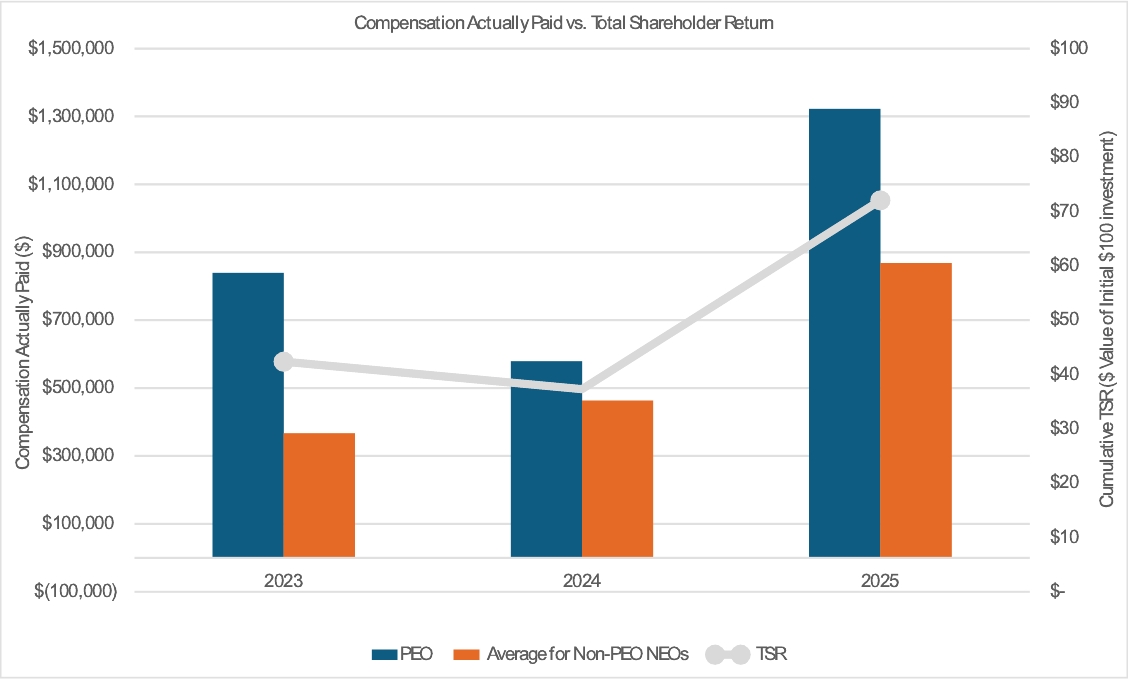
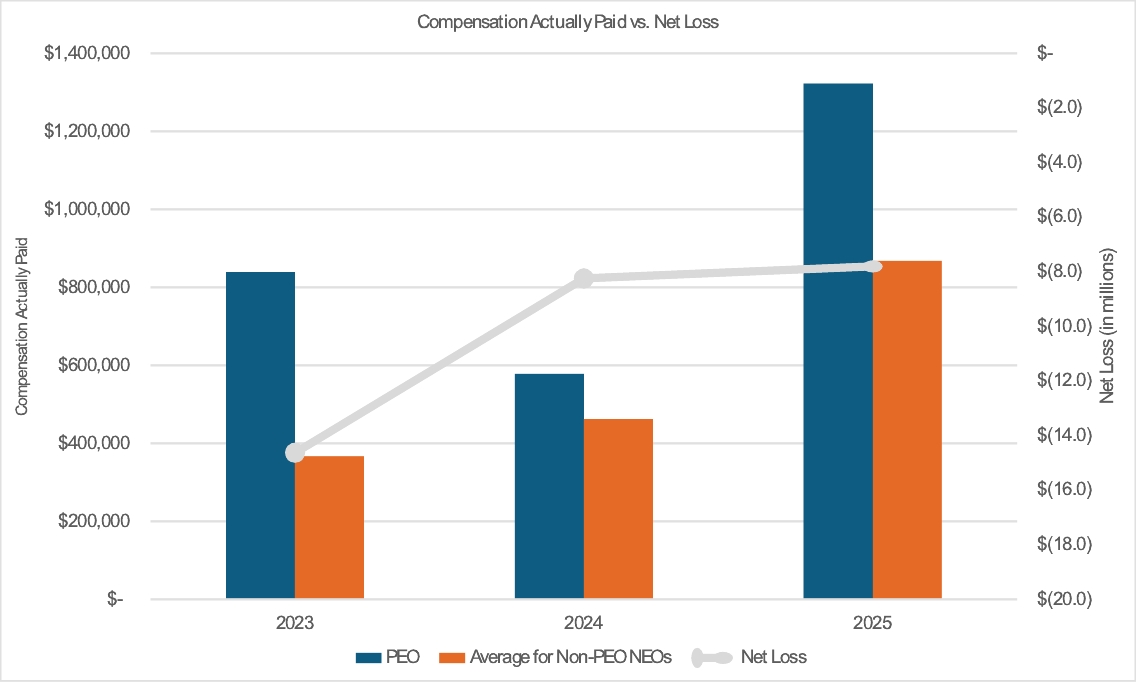
2025 | $936,439 | $1,322,390 | $651,732 | $943,393 | $72 | $(7,800,555) | ||||||||||||
2024 | $578,376 | $578,376 | $460,079 | $462,745 | $37 | $(8,241,501) | ||||||||||||
2023 | $839,398 | $839,398 | $367,075 | $367,075 | $42 | $(14,626,683) | ||||||||||||
(1) | Amounts reported for our Chief Executive Officer, Brian Carrico. |
(2) | Amounts represent (i) the average of our Chief Financial Officer, Tim Henrichs, Chief Regulatory Officer, Dr. Thomas Carrico, and Chief Medical Officer, Dr. Adrian Miranda, for fiscal years 2025 and 2024 and (ii) the average of our Chief Regulatory Officer, Dr. Thomas Carrico and Chief Medical Officer, Dr. Adrian Miranda, for fiscal year 2023. Mr. Henrichs’ employment began on February 5, 2024. |
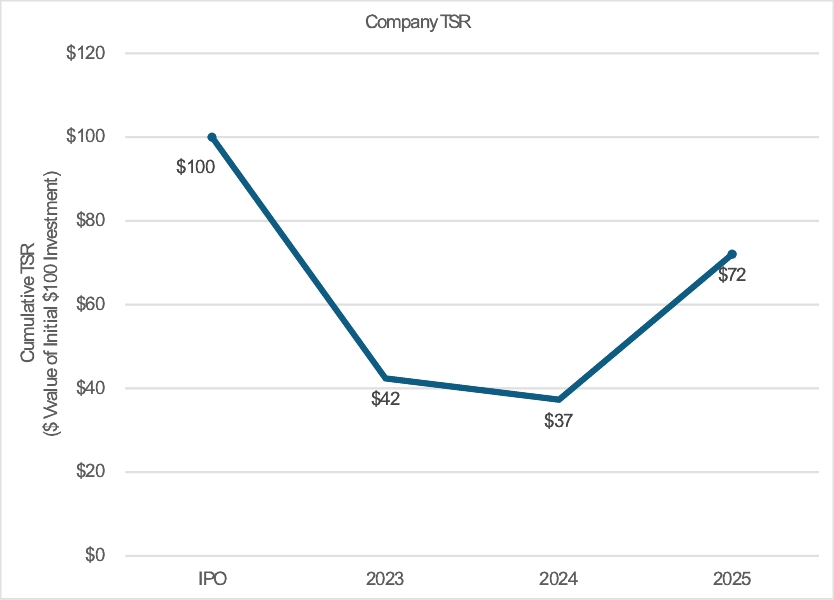
(3) | The amount in fiscal year 2023 represents the total stockholder return from August 9, 2023, our first day of trading as a public company, through the last day of trading in the fiscal year. |
(4) | Amount represents our net loss as reported in our Annual Report on Form 10-K. |
2025 | 2024 | 2023 | ||||||||||||||||
PEO | Other Non-PEO NEOs (Average) | PEO | Other Non-PEO NEOs (Average) | PEO | Other Non-PEO NEOs (Average) | |||||||||||||
Summary Compensation Table Total | $936,439 | $651,732 | $578,376 | $460,079 | $839,398 | $367,075 | ||||||||||||
Less: Grant Date Fair Value of Equity Awards Granted in Fiscal Year | (388,841) | (222,043) | -— | (75,667) | — | — | ||||||||||||
Plus: Fair Value at Fiscal Year End of Outstanding and Unvested Equity Awards Granted in the Fiscal Year | 774,792 | 438,037 | — | 78,333 | — | — | ||||||||||||
Plus: Change in Fair Value of Outstanding and Unvested Equity Awards Granted in Prior Fiscal Years | — | 75,667 | — | — | — | — | ||||||||||||
Plus: Fair Value as of the Vesting Date of Equity Awards Granted and Vested in the Fiscal Year | — | — | — | — | — | — | ||||||||||||
Plus: Change in Fair Value of Equity Awards Granted in Prior Fiscal Years that Vested in the Fiscal Year | — | — | — | — | — | — | ||||||||||||
Less: Fair Value as of Prior Fiscal Year End of Equity Awards Granted in Prior Fiscal Years that Failed to Meet Vesting Conditions in the Fiscal Year | — | — | — | — | — | — | ||||||||||||
2025 | 2024 | 2023 | ||||||||||||||||
PEO | Other Non-PEO NEOs (Average) | PEO | Other Non-PEO NEOs (Average) | PEO | Other Non-PEO NEOs (Average) | |||||||||||||
Plus: Value of Dividends or Other Earnings Paid on Equity Awards Not Otherwise Reflected in Total Compensation | — | — | — | — | — | — | ||||||||||||
Compensation Actually Paid | $1,322,390 | $943,393 | $578,376 | $462,745 | $839,398 | $367,075 | ||||||||||||
(1) | Amounts reported for our Chief Executive Officer, Brian Carrico. |
(2) | Amounts represent (i) the average of our Chief Financial Officer, Tim Henrichs, Chief Regulatory Officer, Dr. Thomas Carrico, and Chief Medical Officer, Dr. Adrian Miranda, for fiscal years 2025 and 2024 and (ii) the average of our Chief Regulatory Officer, Dr. Thomas Carrico and Chief Medical Officer, Dr. Adrian Miranda, for fiscal year 2023. Mr. Henrichs’ employment began on February 5, 2024. |
2025 | 2024 | 2023 | ||||||||||||||||
PEO | Other Non-PEO NEOs (Average) | PEO | Other Non-PEO NEOs (Average) | PEO | Other Non-PEO NEOs (Average) | |||||||||||||
Summary Compensation Table Total | $936,439 | $651,732 | $578,376 | $460,079 | $839,398 | $367,075 | ||||||||||||
Less: Grant Date Fair Value of Equity Awards Granted in Fiscal Year | (388,841) | (222,043) | -— | (75,667) | — | — | ||||||||||||
Plus: Fair Value at Fiscal Year End of Outstanding and Unvested Equity Awards Granted in the Fiscal Year | 774,792 | 438,037 | — | 78,333 | — | — | ||||||||||||
Plus: Change in Fair Value of Outstanding and Unvested Equity Awards Granted in Prior Fiscal Years | — | 75,667 | — | — | — | — | ||||||||||||
Plus: Fair Value as of the Vesting Date of Equity Awards Granted and Vested in the Fiscal Year | — | — | — | — | — | — | ||||||||||||
Plus: Change in Fair Value of Equity Awards Granted in Prior Fiscal Years that Vested in the Fiscal Year | — | — | — | — | — | — | ||||||||||||
Less: Fair Value as of Prior Fiscal Year End of Equity Awards Granted in Prior Fiscal Years that Failed to Meet Vesting Conditions in the Fiscal Year | — | — | — | — | — | — | ||||||||||||
2025 | 2024 | 2023 | ||||||||||||||||
PEO | Other Non-PEO NEOs (Average) | PEO | Other Non-PEO NEOs (Average) | PEO | Other Non-PEO NEOs (Average) | |||||||||||||
Plus: Value of Dividends or Other Earnings Paid on Equity Awards Not Otherwise Reflected in Total Compensation | — | — | — | — | — | — | ||||||||||||
Compensation Actually Paid | $1,322,390 | $943,393 | $578,376 | $462,745 | $839,398 | $367,075 | ||||||||||||
2025 | 2024 | 2023 | ||||||||||||||||
PEO | Other Non-PEO NEOs (Average) | PEO | Other Non-PEO NEOs (Average) | PEO | Other Non-PEO NEOs (Average) | |||||||||||||
Summary Compensation Table Total | $936,439 | $651,732 | $578,376 | $460,079 | $839,398 | $367,075 | ||||||||||||
Less: Grant Date Fair Value of Equity Awards Granted in Fiscal Year | (388,841) | (222,043) | -— | (75,667) | — | — | ||||||||||||
Plus: Fair Value at Fiscal Year End of Outstanding and Unvested Equity Awards Granted in the Fiscal Year | 774,792 | 438,037 | — | 78,333 | — | — | ||||||||||||
Plus: Change in Fair Value of Outstanding and Unvested Equity Awards Granted in Prior Fiscal Years | — | 75,667 | — | — | — | — | ||||||||||||
Plus: Fair Value as of the Vesting Date of Equity Awards Granted and Vested in the Fiscal Year | — | — | — | — | — | — | ||||||||||||
Plus: Change in Fair Value of Equity Awards Granted in Prior Fiscal Years that Vested in the Fiscal Year | — | — | — | — | — | — | ||||||||||||
Less: Fair Value as of Prior Fiscal Year End of Equity Awards Granted in Prior Fiscal Years that Failed to Meet Vesting Conditions in the Fiscal Year | — | — | — | — | — | — | ||||||||||||
2025 | 2024 | 2023 | ||||||||||||||||
PEO | Other Non-PEO NEOs (Average) | PEO | Other Non-PEO NEOs (Average) | PEO | Other Non-PEO NEOs (Average) | |||||||||||||
Plus: Value of Dividends or Other Earnings Paid on Equity Awards Not Otherwise Reflected in Total Compensation | — | — | — | — | — | — | ||||||||||||
Compensation Actually Paid | $1,322,390 | $943,393 | $578,376 | $462,745 | $839,398 | $367,075 | ||||||||||||
The illustration below compares our cumulative TSR over the period from our initial public offering date to December 31, 2025.