Pay vs Performance Disclosure - USD ($)
Sep. 10, 2025
Dec. 31, 2022
Dec. 31, 2025
Aug. 15, 2025
Nov. 30, 2022
Dec. 31, 2025
Dec. 31, 2024
Dec. 31, 2023
Dec. 31, 2022
Dec. 31, 2021
Pay Versus Performance
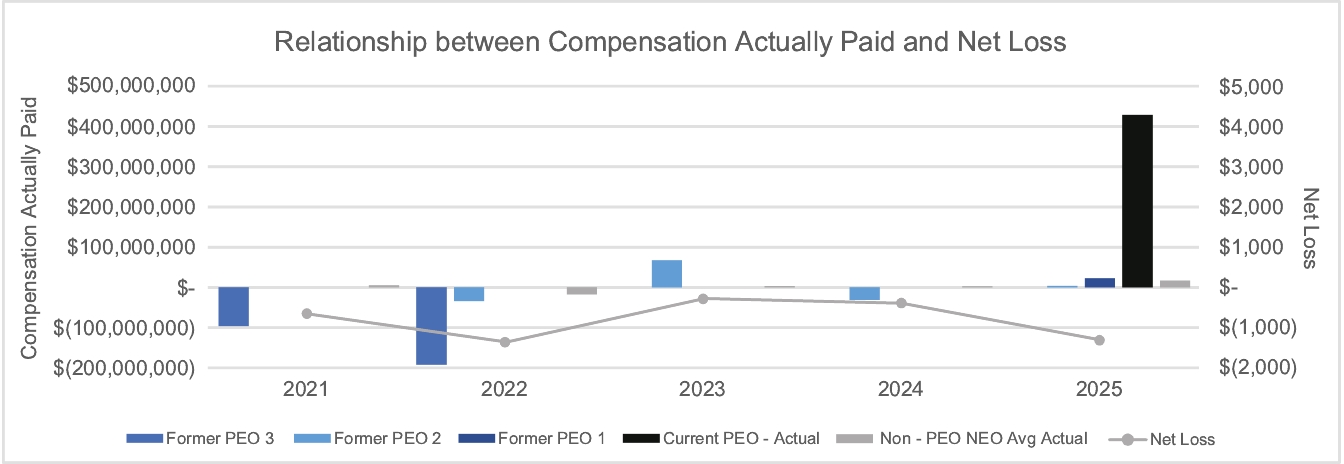
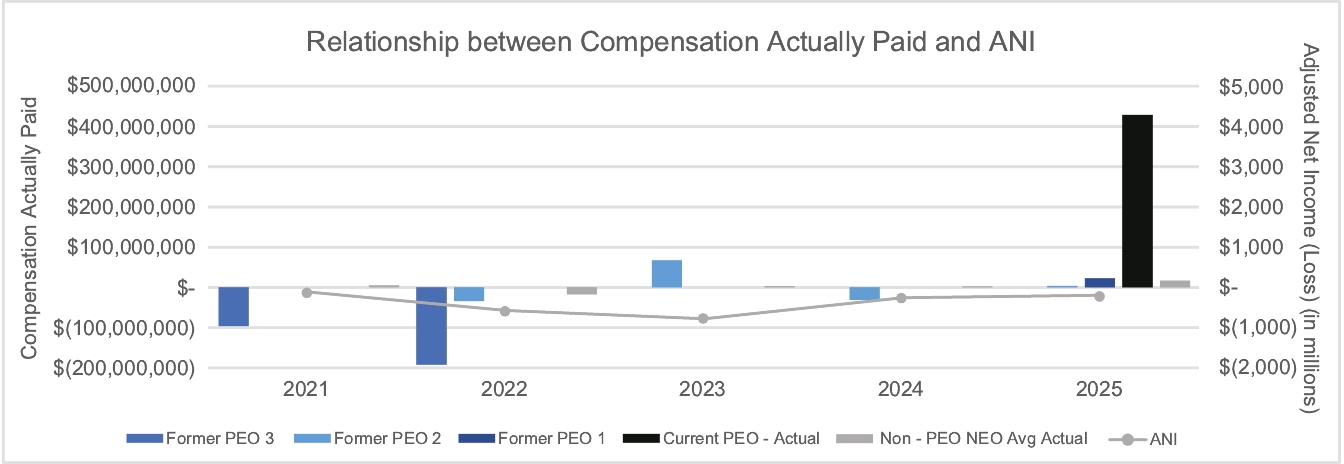
As required by Section 953(a) of the Dodd-Frank Wall Street Reform and Consumer Protection Act, and Item 402(v) of Regulation S-K (the “PvP Rules”), we are providing: (1) tabular compensation and performance disclosure for our fiscal years 2021, 2022, 2023, 2024 and 2025 and (2) additional disclosure relative to the relationship between the “Compensation Actually Paid” (“CAP”) set forth in the Pay versus Performance Table and the Company’s and the Peer Group Total Stockholder Return (“TSR”), in each case over our fiscal years 2021, 2022, 2023, 2024, and 2025. For further information concerning our pay-for-performance philosophy and how we align executive compensation with our performance, see “Compensation Discussion and Analysis” in this proxy and in our proxy statements filed in 2022, 2023, 2024 and 2025.
In the below pay versus performance table, we provide information about compensation of our NEOs for each of the last five fiscal years (the “Covered Years”). Additionally, we provide information about the results for certain financial performance measures during the Covered Years. Although the PvP Rules require us to disclose “compensation actually paid,” these amounts do not necessarily reflect compensation that our NEOs actually earned in the Covered Years. Instead, “compensation actually paid” reflects a calculation computed in accordance with the PvP Rules, including adjusted values to unvested and vested equity awards during the Covered Years based on either year-end or vesting date stock prices and various accounting valuation assumptions. “Compensation actually paid” generally fluctuates due to stock price performance.
Pay Versus Performance | ||||||||||||||||||||||||||||||||||||||||||||
Year | Summary Compensation Table Total to PEO (2) | Compensation Actually Paid to (Lost by) PEO (3) | Summary Compensation Table Total to Former PEO 1 (2) | Compensation Actually Paid to (Lost by) Former PEO 1 (3) | Summary Compensation Table Total to Former PEO 2 (2) | Compensation Actually Paid to (Lost by) Former PEO 2 (3) | Summary Compensation Table Total to Former PEO 3 (2) | Compensation Actually Paid to (Lost by) Former PEO 3 (3) | Average Summary Compensation Table Total for Non-PEO NEOs (2) | Average Compensation Actually Paid for Non-PEO NEOs (4) | Value of Initial Fixed $100 Investment Based On | Net Income / (Loss) ($Millions) (7) | Adjusted Net Income / (Loss) ($Millions) (8) | |||||||||||||||||||||||||||||||
Opendoor Total Stockholder Return (5) | Peer Group Total Stockholder Return (6) | |||||||||||||||||||||||||||||||||||||||||||
2025 | 741,137,105 | 428,477,852 | 1,955,693 | 22,764,781 | $4,909,110 | $4,074,962 | N/A | N/A | $17,462,999 | $16,912,257 | $19 | $125 | $(1,300) | $(195) | ||||||||||||||||||||||||||||||
2024 | N/A | N/A | N/A | N/A | $750,500 | $(30,822,125) | N/A | N/A | $5,136,683 | $2,326,493 | $5 | $117 | $(392) | $(258) | ||||||||||||||||||||||||||||||
2023 | N/A | N/A | N/A | N/A | $17,566,265 | $67,087,377 | N/A | N/A | $838,011 | $3,103,004 | $14 | $104 | $(275) | $(778) | ||||||||||||||||||||||||||||||
2022 | N/A | N/A | N/A | N/A | $383,334 | $(33,760,155) | $325,000 | $(191,665,693) | $2,209,789 | $(16,981,618) | $4 | $77 | $(1,353) | $(574) | ||||||||||||||||||||||||||||||
2021 | N/A | N/A | N/A | N/A | N/A | N/A | $112,333,540 | $(95,777,677) | $24,302,144 | $5,199,835 | $47 | $112 | $(662) | $(116) | ||||||||||||||||||||||||||||||
(1) | Kaz Nejatian served as the Company’s Principal Executive Officer (our “PEO”) for the period September 10, 2025 to December 31, 2025. Shrisha Radhakrishna served as our PEO for the period August 15, 2025 to September 10, 2025 (“Former PEO 1”). Carrie Wheeler served as our PEO for the period January 1, 2025 to August 15, 2025, for the entirety of fiscal years 2023 and 2024 and from December 1 to December 31, 2022 (“Former PEO 2”). Our former PEO, Eric Wu, served as our PEO for the entirety of fiscal 2021 as well as January 1 to November 30, 2022 (“Former PEO 3”). The Company’s other NEOs (the “Non-PEO NEOs”) for the indicated fiscal years were as follows: |
• | 2025: Christina Schwartz, Lucas Matheson, Giang LeGrice, Selim Freiha, and Sydney Schaub; |
• | 2024: Selim Freiha, Sydney Schaub, Christina Schwartz, and Megan Meyer Toolson |
• | 2023: Christina Schwartz, Megan Meyer Toolson, Sydney Schaub, and Daniel Morillo |
• | 2022: Christina Schwartz, Sydney Schaub, Andrew Low Ah Kee, and Daniel Morillo |
• | 2021: Carrie Wheeler, Andrew Low Ah Kee, Daniel Morillo, Ian Wong, and Elizabeth Stevens |
(2) | Amounts reported in these columns represent (i) the total compensation reported in the Summary Compensation Table for the indicated fiscal year in the case of our PEO and each former PEO, and (ii) the average of the total compensation reported in the Summary Compensation Table for the Non-PEO NEOs in the indicated year for such years. |
(3) | Amounts reported in these columns represent the compensation actually paid to (lost by) our PEO and each former PEO for the indicated fiscal year, as calculated under Item 402(v) of Regulation S-K based on their total compensation reported in the Summary Compensation Table for the indicated fiscal years and adjusted as shown in the tables below: |
PEO | ||||||||
+/- | 2025 | |||||||
Summary Compensation Table - Total Compensation | $741,137,105 | |||||||
- | Grant Date Fair Value of Stock Awards and Option Awards Granted in Fiscal Year | $(741,130,175) | ||||||
+ | Fair Value at Fiscal Year End of Outstanding and Unvested Stock Awards and Option Awards Granted in Fiscal Year | $428,470,922 | ||||||
+ | Change in Fair Value of Outstanding and Unvested Stock Awards and Option Awards Granted in Prior Fiscal Years | $— | ||||||
+ | Fair Value at Vesting of Stock Awards and Option Awards Granted in Fiscal Year That Vested During Fiscal Year | $— | ||||||
+ | Change in Fair Value as of Vesting Date of Stock Awards and Option Awards Granted in Prior Fiscal Years For Which Applicable Vesting Conditions Were Satisfied During Fiscal Year | $— | ||||||
- | Fair Value as of Prior Fiscal Year End of Stock Awards and Option Awards Granted in Prior Fiscal Years That Failed to Meet Applicable Vesting Conditions During Fiscal Year | $— | ||||||
= | Compensation Actually Paid | $428,477,852 | ||||||
Former PEO 1 | ||||||||
+/- | 2025 | |||||||
Summary Compensation Table - Total Compensation | $1,955,693 | |||||||
- | Grant Date Fair Value of Stock Awards and Option Awards Granted in Fiscal Year | $(380,137) | ||||||
+ | Fair Value at Fiscal Year End of Outstanding and Unvested Stock Awards and Option Awards Granted in Fiscal Year | $— | ||||||
+ | Change in Fair Value of Outstanding and Unvested Stock Awards and Option Awards Granted in Prior Fiscal Years | $ 12,044,925 | ||||||
+ | Fair Value at Vesting of Stock Awards and Option Awards Granted in Fiscal Year That Vested During Fiscal Year | $— | ||||||
+ | Change in Fair Value as of Vesting Date of Stock Awards and Option Awards Granted in Prior Fiscal Years For Which Applicable Vesting Conditions Were Satisfied During Fiscal Year | $9,144,300 | ||||||
- | Fair Value as of Prior Fiscal Year End of Stock Awards and Option Awards Granted in Prior Fiscal Years That Failed to Meet Applicable Vesting Conditions During Fiscal Year | $— | ||||||
= | Compensation Actually Paid | $ 22,764,781 | ||||||
Former PEO 2 | |||||||||||||||||
+/- | 2022 | 2023 | 2024 | 2025 | |||||||||||||
Summary Compensation Table – Total Compensation | $383,334 | $17,566,265 | $750,500 | $4,909,110 | |||||||||||||
- | Grant Date Fair Value of Stock Awards and Option Awards Granted in Fiscal Year | $0 | $(16,566,265) | $0 | $(4,159,110) | ||||||||||||
+ | Fair Value at Fiscal Year End of Outstanding and Unvested Stock Awards and Option Awards Granted in Fiscal Year | $0 | $50,602,411 | $0 | $— | ||||||||||||
+ | Change in Fair Value of Outstanding and Unvested Stock Awards and Option Awards Granted in Prior Fiscal Years | $(25,998,352) | $3,349,687 | $(22,123,486) | $— | ||||||||||||
+ | Fair Value at Vesting of Stock Awards and Option Awards Granted in Fiscal Year That Vested During Fiscal Year | $0 | $10,589,231 | $0 | $2,481,000 | ||||||||||||
+ | Change in Fair Value as of Vesting Date of Stock Awards and Option Awards Granted in Prior Fiscal Years For Which Applicable Vesting Conditions Were Satisfied During Fiscal Year | $(8,145,137) | $1,546,048 | $(9,449,139) | $(1,207,592) | ||||||||||||
- | Fair Value as of Prior Fiscal Year End of Stock Awards and Option Awards Granted in Prior Fiscal Years That Failed to Meet Applicable Vesting Conditions During Fiscal Year | $0 | $0 | $0 | $2,051,554 | ||||||||||||
= | Compensation Actually Paid | $(33,760,155) | $67,087,377 | $(30,822,125) | $4,074,962 | ||||||||||||
Former PEO 3 | |||||||||||
+/- | 2021 | 2022 | |||||||||
Summary Compensation Table - Total Compensation | $112,333,540 | $325,000 | |||||||||
- | Grant Date Fair Value of Stock Awards and Option Awards Granted in Fiscal Year | $(111,598,143) | $0 | ||||||||
+ | Fair Value at Fiscal Year End of Outstanding and Unvested Stock Awards and Option Awards Granted in Fiscal Year | $64,558,478 | $0 | ||||||||
+ | Change in Fair Value of Outstanding and Unvested Stock Awards and Option Awards Granted in Prior Fiscal Years | $(165,137,966) | $(7,421,831) | ||||||||
+ | Fair Value at Vesting of Stock Awards and Option Awards Granted in Fiscal Year That Vested During Fiscal Year | $19,762,150 | $0 | ||||||||
+ | Change in Fair Value as of Vesting Date of Stock Awards and Option Awards Granted in Prior Fiscal Years For Which Applicable Vesting Conditions Were Satisfied During Fiscal Year | $(15,695,736) | $(14,858,822) | ||||||||
- | Fair Value as of Prior Fiscal Year End of Stock Awards and Option Awards Granted in Prior Fiscal Years That Failed to Meet Applicable Vesting Conditions During Fiscal Year | $0 | $(169,710,040) | ||||||||
= | Compensation Actually Paid | $(95,777,677) | $(191,665,693) | ||||||||
Equity Award values are calculated in accordance with FASB ASC Topic 718, and the valuation assumptions used to calculate fair values did not materially differ from those disclosed at the time of grant.
(4) | Amounts reported in this column represent the compensation actually paid to the Non-PEO NEOs in the indicated fiscal year, as calculated under Item 402(v) of Regulation S-K based on the average total compensation for such NEOs reported in the Summary Compensation Table for the indicated fiscal year and adjusted as shown in the table below: |
NEO Average | |||||||||||||||||||||||
+/- | 2021 | 2022 | 2023 | 2024 | 2025 | ||||||||||||||||||
Summary Compensation Table - Total Compensation | $24,302,144 | $2,209,789 | $838,011 | $5,136,683 | $17,462,999 | ||||||||||||||||||
- | Grant Date Fair Value of Stock Awards and Option Awards Granted in Fiscal Year | $(23,637,936) | $(1,551,351) | $0 | $(4,636,307) | $ (16,788,456) | |||||||||||||||||
+ | Fair Value at Fiscal Year End of Outstanding and Unvested Stock Awards and Option Awards Granted in Fiscal Year | $11,832,656 | $572,406 | $0 | $2,652,896 | $14,033,330 | |||||||||||||||||
+ | Change in Fair Value of Outstanding and Unvested Stock Awards and Option Awards Granted in Prior Fiscal Years | $(8,760,674) | $(14,604,217) | $1,721,801 | $(343,389) | $— | |||||||||||||||||
+ | Fair Value at Vesting of Stock Awards and Option Awards Granted in Fiscal Year That Vested During Fiscal Year | $5,537,345 | $20,842 | $0 | $388,801 | $315,565 | |||||||||||||||||
+ | Change in Fair Value as of Vesting Date of Stock Awards and Option Awards Granted in Prior Fiscal Years For Which Applicable Vesting Conditions Were Satisfied During Fiscal Year | $(3,354,547) | $(3,629,087) | $875,951 | $(872,191) | $2,736,620 | |||||||||||||||||
- | Fair Value as of Prior Fiscal Year End of Stock Awards and Option Awards Granted in Prior Fiscal Years That Failed to Meet Applicable Vesting Conditions During Fiscal Year | $719,153 | $0 | $332,759 | $0 | $(847,801) | |||||||||||||||||
= | Compensation Actually Paid | $5,199,835 | $(16,981,618) | $3,103,004 | $2,326,493 | $16,912,257 | |||||||||||||||||
(5) | Please see footnote 1 for the Non-PEO NEOs included in the average for each indicated fiscal year. Equity Award values are calculated in accordance with FASB ASC Topic 718, and the valuation assumptions used to calculate fair values did not materially differ from those disclosed at the time of grant. The fair value as of the last day of each fiscal year or the applicable vesting date is determined (a) for stock options, based on the Black-Scholes value as of the applicable date, (b) for TRSUs, based on the stock price as of the applicable date, (c) for PRSUs that are not tied to market conditions, based on the stock price as of the applicable date, as adjusted by the probability of achievement of the applicable performance objectives at the time of grant, and (d) for PRSUs that are tied to market conditions, a Monte Carlo simulation model, based on the assumptions set forth in Note 12, Share-Based Awards to the consolidated financial statements included in our 2025 Annual Report as of the applicable date. Pursuant to Item 402(v) of Regulation S-K, the comparison assumes $100 was invested in our Common Stock on December 31, 2020, which was the last trading day before the earliest fiscal year in the table, using the closing stock price on that date. Historic stock price performance is not necessarily indicative of future stock price performance. |
(6) | The TSR Peer Group is the Nasdaq Real Estate and Other Financial Services Index, which is the industry-specific index the Company uses in its Annual Report on Form 10-K. This calculation assumes that $100 was invested in this index on December 31, 2020 (aligned with the period used in footnote #5 above). |
(7) | Amounts reported in this column represent the Company’s net income (loss) for the indicated years as reported in our 2025 Annual Report, 2024 Annual Report and 2022 Annual Report. |
(8) | We chose ANI as our Company-selected measure because we use our Company’s annual ANI performance to determine annual bonuses paid to our NEOs. A detailed definition of ANI and full reconciliation of ANI to its most directly comparable GAAP financial measure are included in Annex A attached to this proxy statement. |
(1) | Kaz Nejatian served as the Company’s Principal Executive Officer (our “PEO”) for the period September 10, 2025 to December 31, 2025. Shrisha Radhakrishna served as our PEO for the period August 15, 2025 to September 10, 2025 (“Former PEO 1”). Carrie Wheeler served as our PEO for the period January 1, 2025 to August 15, 2025, for the entirety of fiscal years 2023 and 2024 and from December 1 to December 31, 2022 (“Former PEO 2”). Our former PEO, Eric Wu, served as our PEO for the entirety of fiscal 2021 as well as January 1 to November 30, 2022 (“Former PEO 3”). The Company’s other NEOs (the “Non-PEO NEOs”) for the indicated fiscal years were as follows: |
• | 2025: Christina Schwartz, Lucas Matheson, Giang LeGrice, Selim Freiha, and Sydney Schaub; |
• | 2024: Selim Freiha, Sydney Schaub, Christina Schwartz, and Megan Meyer Toolson |
• | 2023: Christina Schwartz, Megan Meyer Toolson, Sydney Schaub, and Daniel Morillo |
• | 2022: Christina Schwartz, Sydney Schaub, Andrew Low Ah Kee, and Daniel Morillo |
• | 2021: Carrie Wheeler, Andrew Low Ah Kee, Daniel Morillo, Ian Wong, and Elizabeth Stevens |
(6) | The TSR Peer Group is the Nasdaq Real Estate and Other Financial Services Index, which is the industry-specific index the Company uses in its Annual Report on Form 10-K. This calculation assumes that $100 was invested in this index on December 31, 2020 (aligned with the period used in footnote #5 above). |
(3) | Amounts reported in these columns represent the compensation actually paid to (lost by) our PEO and each former PEO for the indicated fiscal year, as calculated under Item 402(v) of Regulation S-K based on their total compensation reported in the Summary Compensation Table for the indicated fiscal years and adjusted as shown in the tables below: |
PEO | ||||||||
+/- | 2025 | |||||||
Summary Compensation Table - Total Compensation | $741,137,105 | |||||||
- | Grant Date Fair Value of Stock Awards and Option Awards Granted in Fiscal Year | $(741,130,175) | ||||||
+ | Fair Value at Fiscal Year End of Outstanding and Unvested Stock Awards and Option Awards Granted in Fiscal Year | $428,470,922 | ||||||
+ | Change in Fair Value of Outstanding and Unvested Stock Awards and Option Awards Granted in Prior Fiscal Years | $— | ||||||
+ | Fair Value at Vesting of Stock Awards and Option Awards Granted in Fiscal Year That Vested During Fiscal Year | $— | ||||||
+ | Change in Fair Value as of Vesting Date of Stock Awards and Option Awards Granted in Prior Fiscal Years For Which Applicable Vesting Conditions Were Satisfied During Fiscal Year | $— | ||||||
- | Fair Value as of Prior Fiscal Year End of Stock Awards and Option Awards Granted in Prior Fiscal Years That Failed to Meet Applicable Vesting Conditions During Fiscal Year | $— | ||||||
= | Compensation Actually Paid | $428,477,852 | ||||||
Former PEO 1 | ||||||||
+/- | 2025 | |||||||
Summary Compensation Table - Total Compensation | $1,955,693 | |||||||
- | Grant Date Fair Value of Stock Awards and Option Awards Granted in Fiscal Year | $(380,137) | ||||||
+ | Fair Value at Fiscal Year End of Outstanding and Unvested Stock Awards and Option Awards Granted in Fiscal Year | $— | ||||||
+ | Change in Fair Value of Outstanding and Unvested Stock Awards and Option Awards Granted in Prior Fiscal Years | $ 12,044,925 | ||||||
+ | Fair Value at Vesting of Stock Awards and Option Awards Granted in Fiscal Year That Vested During Fiscal Year | $— | ||||||
+ | Change in Fair Value as of Vesting Date of Stock Awards and Option Awards Granted in Prior Fiscal Years For Which Applicable Vesting Conditions Were Satisfied During Fiscal Year | $9,144,300 | ||||||
- | Fair Value as of Prior Fiscal Year End of Stock Awards and Option Awards Granted in Prior Fiscal Years That Failed to Meet Applicable Vesting Conditions During Fiscal Year | $— | ||||||
= | Compensation Actually Paid | $ 22,764,781 | ||||||
Former PEO 2 | |||||||||||||||||
+/- | 2022 | 2023 | 2024 | 2025 | |||||||||||||
Summary Compensation Table – Total Compensation | $383,334 | $17,566,265 | $750,500 | $4,909,110 | |||||||||||||
- | Grant Date Fair Value of Stock Awards and Option Awards Granted in Fiscal Year | $0 | $(16,566,265) | $0 | $(4,159,110) | ||||||||||||
+ | Fair Value at Fiscal Year End of Outstanding and Unvested Stock Awards and Option Awards Granted in Fiscal Year | $0 | $50,602,411 | $0 | $— | ||||||||||||
+ | Change in Fair Value of Outstanding and Unvested Stock Awards and Option Awards Granted in Prior Fiscal Years | $(25,998,352) | $3,349,687 | $(22,123,486) | $— | ||||||||||||
+ | Fair Value at Vesting of Stock Awards and Option Awards Granted in Fiscal Year That Vested During Fiscal Year | $0 | $10,589,231 | $0 | $2,481,000 | ||||||||||||
+ | Change in Fair Value as of Vesting Date of Stock Awards and Option Awards Granted in Prior Fiscal Years For Which Applicable Vesting Conditions Were Satisfied During Fiscal Year | $(8,145,137) | $1,546,048 | $(9,449,139) | $(1,207,592) | ||||||||||||
- | Fair Value as of Prior Fiscal Year End of Stock Awards and Option Awards Granted in Prior Fiscal Years That Failed to Meet Applicable Vesting Conditions During Fiscal Year | $0 | $0 | $0 | $2,051,554 | ||||||||||||
= | Compensation Actually Paid | $(33,760,155) | $67,087,377 | $(30,822,125) | $4,074,962 | ||||||||||||
Former PEO 3 | |||||||||||
+/- | 2021 | 2022 | |||||||||
Summary Compensation Table - Total Compensation | $112,333,540 | $325,000 | |||||||||
- | Grant Date Fair Value of Stock Awards and Option Awards Granted in Fiscal Year | $(111,598,143) | $0 | ||||||||
+ | Fair Value at Fiscal Year End of Outstanding and Unvested Stock Awards and Option Awards Granted in Fiscal Year | $64,558,478 | $0 | ||||||||
+ | Change in Fair Value of Outstanding and Unvested Stock Awards and Option Awards Granted in Prior Fiscal Years | $(165,137,966) | $(7,421,831) | ||||||||
+ | Fair Value at Vesting of Stock Awards and Option Awards Granted in Fiscal Year That Vested During Fiscal Year | $19,762,150 | $0 | ||||||||
+ | Change in Fair Value as of Vesting Date of Stock Awards and Option Awards Granted in Prior Fiscal Years For Which Applicable Vesting Conditions Were Satisfied During Fiscal Year | $(15,695,736) | $(14,858,822) | ||||||||
- | Fair Value as of Prior Fiscal Year End of Stock Awards and Option Awards Granted in Prior Fiscal Years That Failed to Meet Applicable Vesting Conditions During Fiscal Year | $0 | $(169,710,040) | ||||||||
= | Compensation Actually Paid | $(95,777,677) | $(191,665,693) | ||||||||
(4) | Amounts reported in this column represent the compensation actually paid to the Non-PEO NEOs in the indicated fiscal year, as calculated under Item 402(v) of Regulation S-K based on the average total compensation for such NEOs reported in the Summary Compensation Table for the indicated fiscal year and adjusted as shown in the table below: |
NEO Average | |||||||||||||||||||||||
+/- | 2021 | 2022 | 2023 | 2024 | 2025 | ||||||||||||||||||
Summary Compensation Table - Total Compensation | $24,302,144 | $2,209,789 | $838,011 | $5,136,683 | $17,462,999 | ||||||||||||||||||
- | Grant Date Fair Value of Stock Awards and Option Awards Granted in Fiscal Year | $(23,637,936) | $(1,551,351) | $0 | $(4,636,307) | $ (16,788,456) | |||||||||||||||||
+ | Fair Value at Fiscal Year End of Outstanding and Unvested Stock Awards and Option Awards Granted in Fiscal Year | $11,832,656 | $572,406 | $0 | $2,652,896 | $14,033,330 | |||||||||||||||||
+ | Change in Fair Value of Outstanding and Unvested Stock Awards and Option Awards Granted in Prior Fiscal Years | $(8,760,674) | $(14,604,217) | $1,721,801 | $(343,389) | $— | |||||||||||||||||
+ | Fair Value at Vesting of Stock Awards and Option Awards Granted in Fiscal Year That Vested During Fiscal Year | $5,537,345 | $20,842 | $0 | $388,801 | $315,565 | |||||||||||||||||
+ | Change in Fair Value as of Vesting Date of Stock Awards and Option Awards Granted in Prior Fiscal Years For Which Applicable Vesting Conditions Were Satisfied During Fiscal Year | $(3,354,547) | $(3,629,087) | $875,951 | $(872,191) | $2,736,620 | |||||||||||||||||
- | Fair Value as of Prior Fiscal Year End of Stock Awards and Option Awards Granted in Prior Fiscal Years That Failed to Meet Applicable Vesting Conditions During Fiscal Year | $719,153 | $0 | $332,759 | $0 | $(847,801) | |||||||||||||||||
= | Compensation Actually Paid | $5,199,835 | $(16,981,618) | $3,103,004 | $2,326,493 | $16,912,257 | |||||||||||||||||
Tabular List of Financial Performance Measures
The following is an unranked list of the most important financial performance measures the Company used to link compensation actually paid to the NEOs to Company performance for the fiscal year ended December 31, 2025:
• | ANI |
• | Product-Level profit |