The following bar chart and table provide some indication of the risks of investing in the Fund by showing changes in the Fund’s performance from year to year and by showing how the Fund’s average annual returns for certain time periods compare with the average annual total returns of the S&P 500® Index, a broad-based securities market index, and the Syntax Stratified Large Cap Index, that reflects the type of securities in which the Fund invests.
The Fund is the successor to the Syntax Stratified LargeCap ETF, a series of Syntax ETF Trust (the “Predecessor Fund”), pursuant to a reorganization that took place after the close of business on September 27, 2024. The performance information provided for the periods on or prior to September 27, 2024, is historical information for the Predecessor Fund. The Predecessor Fund had a substantially similar investment objective, investment strategy, and investment policies as the Fund. The performance record of the Predecessor Fund included the 500 Series of the Syntax Index Series LP (“500 Series”), a privately offered fund that was reorganized into the Predecessor Fund as of January 2, 2019, upon commencement of the Predecessor Fund’s operations. The Fund’s performance information, from January 1, 2015 to January 2, 2019, is that of the 500 Series. The returns were calculated using the methodology the SEC requires of registered funds. However, since the 500 Series did not calculate its returns on a per share basis, its returns have been calculated on its total net asset value. The 500 Series had investment objectives, policies and strategies that were, in all material respects, the same as those of the Predecessor Fund and the Fund, and was managed in a manner that, in all material respects, complied with the investment guidelines and restrictions of the Predecessor Fund and the Fund, which means that it also complied with the investment guidelines and restrictions of the Index.
The Fund’s past performance (before and after taxes) is not necessarily an indication of future performance. Performance may be higher or lower in the future. Updated performance information is available at www.stratifiedfunds.com/sspy or by calling 866-972-4492.

* The performance information shown above is based on a calendar year. The Fund’s year-to-date return as of March 31, 2026 was 1.74%.
Annual Total Returns as of 12/31
Best and Worst Quarter Returns (for the period reflected in the bar chart above)
| Return | Quarter/Year | |
| Highest Return | 20.48% | Q2/2020 |
| Lowest Return | -25.31% | Q1/2020 |
Stratified LargeCap Index ETF |
1 Year | 5 Years* | 10 Years** |
| Return Before Taxes | 12.96% | 11.22% | 12.13% |
| Return After Taxes on Distributions*** | 12.59% | 10.56% | |
| Return After Taxes on Distributions and Sale of Fund Shares*** | 7.93%% | 8.70% | |
| S&P 500 Index (reflects no deduction for fees, expenses, or taxes) | 17.88% | 14.42% | 14.82% |
| Syntax Stratified Large Cap Index (reflects no deduction for fees, expenses, or taxes) | 13.51% | 11.65% | 12.41% |
| * | Performance from January 2, 2019 to September 27, 2024, is that of the Predecessor Fund. |
| ** | Performance from January 1, 2015, to the Fund’s commencement of operations on January 2, 2019, is that of the 500 Series. |
| *** | The 500 Series was an unregistered limited partnership that did not qualify as a registered investment company for federal income tax purposes and did not pay dividends or distributions. Due to this different tax treatment, 10 Years after-tax performance information has not been provided. |
After-tax returns are calculated using the highest historical individual federal marginal income tax rates and do not reflect the impact of state and local taxes. Your actual after-tax returns will depend on your tax situation and may differ from those shown. After-tax returns shown are not relevant to investors who hold their shares through tax-deferred arrangements, such as 401(k) plans or individual retirement accounts. In some cases, the return after taxes may exceed the return before taxes due to an assumed tax benefit from any losses on a sale of shares of the Fund at the end of the measurement period.
The following bar chart and table provide some indication of the risks of investing in the Fund by showing changes in the Fund’s performance from year to year and by showing how the Fund’s average annual returns for certain time periods compare with the average annual total returns of the S&P 500® Index, a broad-based securities market index.
The Fund is the successor to the Syntax Stratified U.S. Total Market Hedged ETF, a series of Syntax ETF Trust (the “Predecessor Fund”), pursuant to a reorganization that took place after the close of business on September 27, 2024. The performance information provided for the periods on or prior to September 27, 2024, is historical information for the Predecessor Fund. The Fund’s investment objective, investment strategy, and investment policies have changed relative to the Predecessor Fund and the Predecessor Fund’s past performance (before and after taxes) is not necessarily an indication of the Fund’s future performance. Performance may be higher or lower in the future. Updated performance information is available at www.stratifiedfunds.com/shus or by calling 866-972-4492.
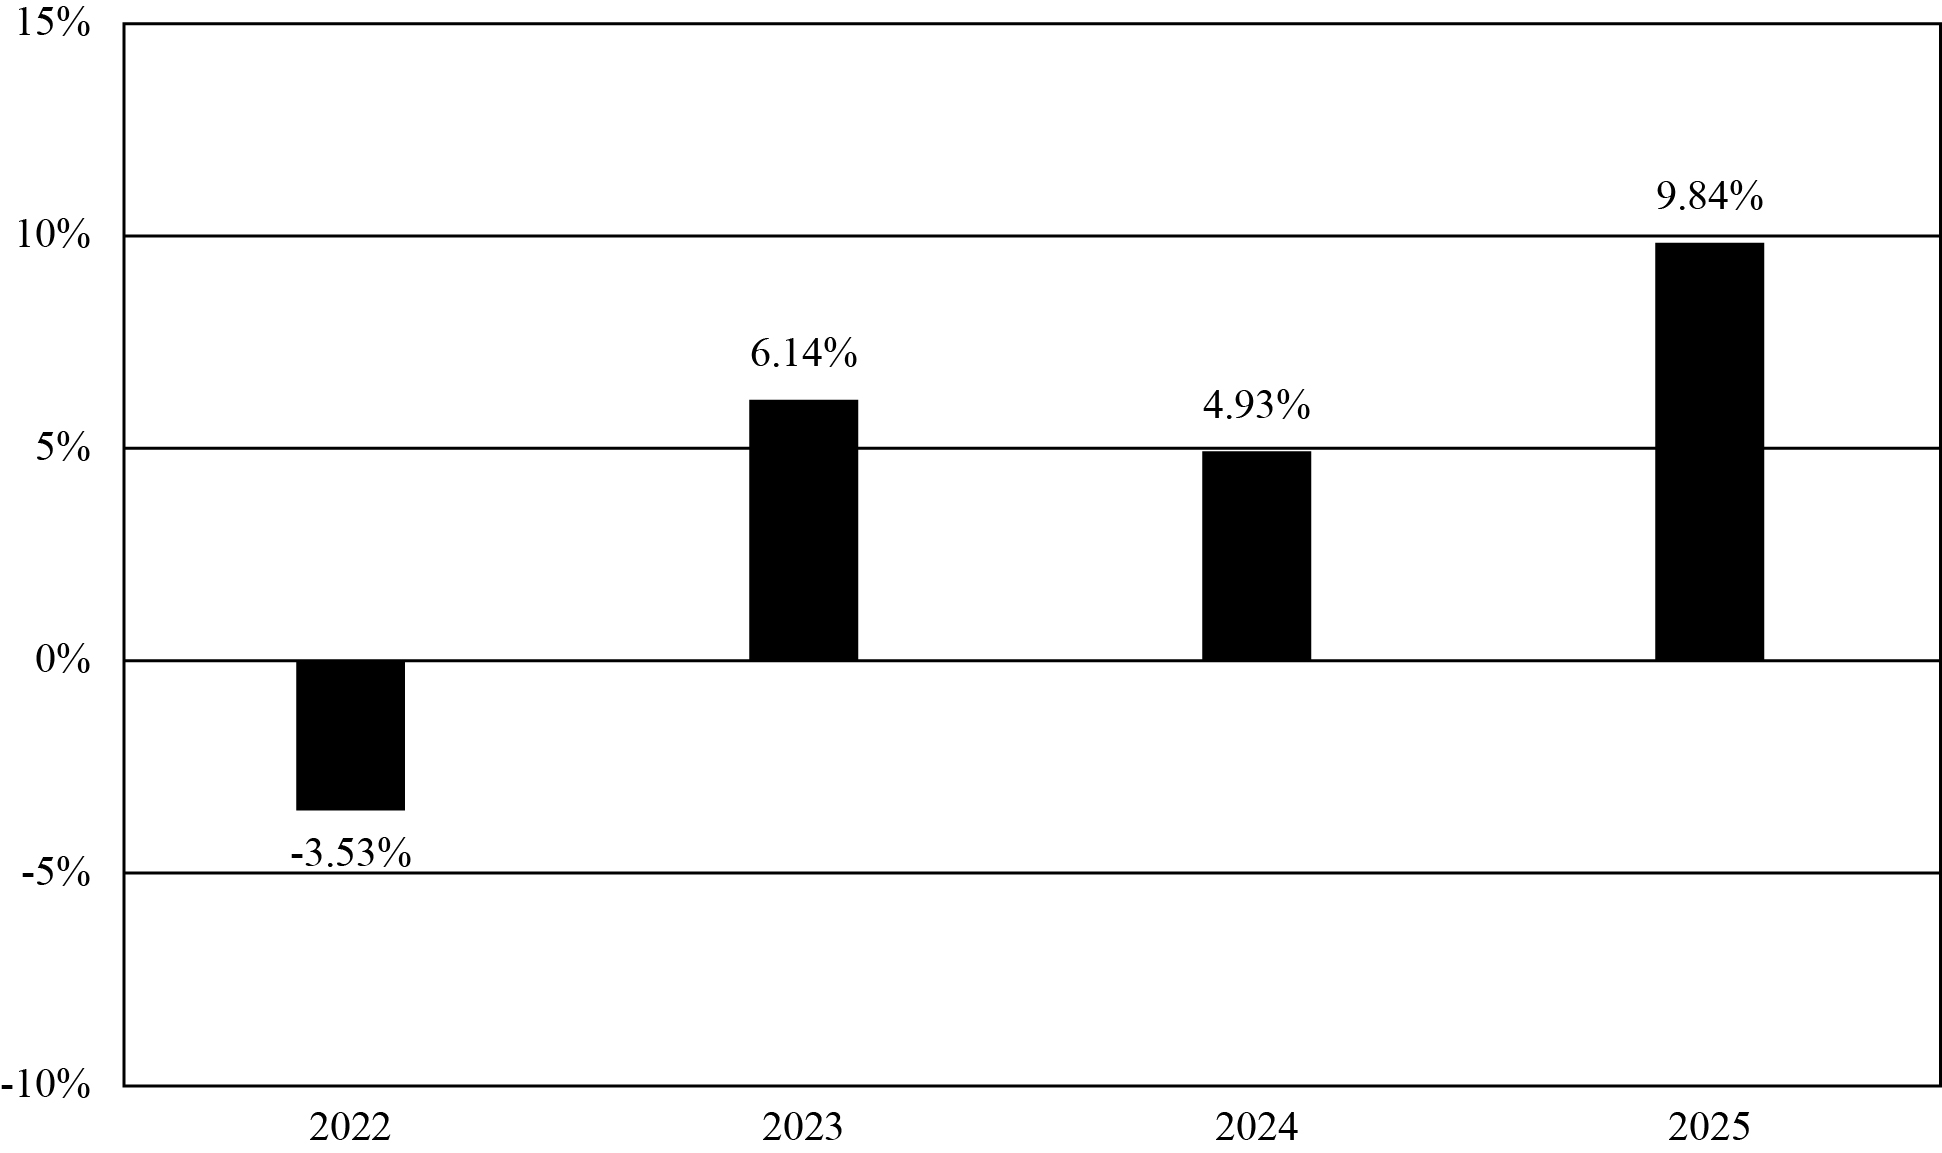
* The performance information shown above is based on a calendar year. The Fund’s year-to-date return as of March 31, 2026 was 1.13%.
Best and Worst Quarter Returns (for the period reflected in the bar chart above)
| Return | Quarter/Year | |
| Highest Return | 7.98% | Q4/2023 |
| Lowest Return | -5.88% | Q2/2022 |
Stratified LargeCap Hedged ETF |
1 Year* | Since Inception (6/15/2021)* |
| Return Before Taxes | 9.84% | 4.51% |
| Return After Taxes on Distributions | 9.48% | 3.94% |
| Return After Taxes on Distributions and Sale of Fund Shares | 6.08% | 3.28% |
| S&P 500 Index (reflects no deduction for fees, expenses, or taxes) | 17.88% | 12.72% |
| * | Performance from June 15, 2021 to September 27, 2024 is that of the Predecessor Fund. |
After-tax returns are calculated using the highest historical individual federal marginal income tax rates and do not reflect the impact of state and local taxes. Your actual after-tax returns will depend on your tax situation and may differ from those shown. After-tax returns shown are not relevant to investors who hold their shares through tax-deferred arrangements, such as 401(k) plans or individual retirement accounts. In some cases, the return after taxes may exceed the return before taxes due to an assumed tax benefit from any losses on a sale of shares of the Fund at the end of the measurement period.