v3.26.1
Pay vs Performance Disclosure - USD ($)
12 Months Ended
Dec. 31, 2025
Dec. 31, 2024
Dec. 31, 2023
Dec. 31, 2022
Pay vs Performance Disclosure        
Pay vs Performance Disclosure, Table

PAY VERSUS PERFORMANCE

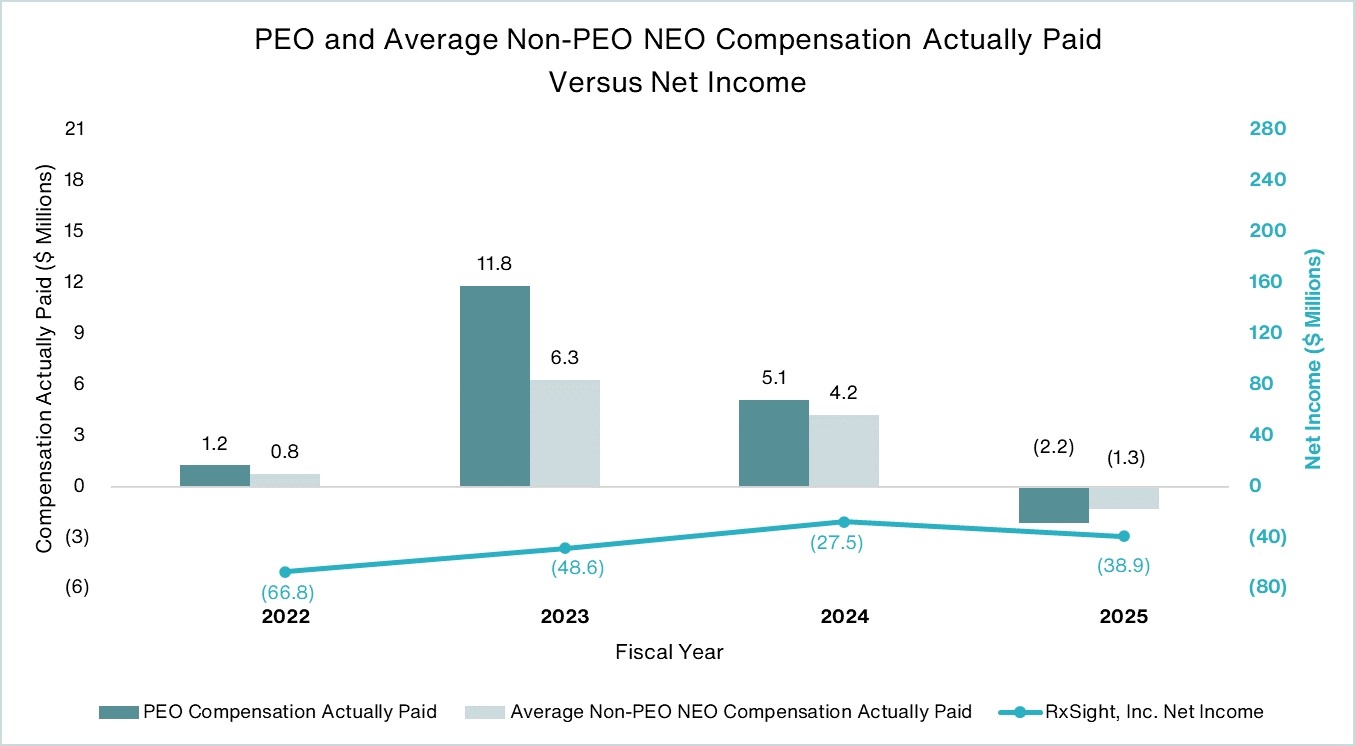
The following table sets forth the compensation for Ron Kurtz, M.D., our principal executive officer (“PEO”), and the average compensation for our named executive officers other than our PEO (“non-PEO NEOs”) for fiscal years 2025, 2024, 2023, and 2022 (each a “covered year”), both as reported in the Summary Compensation Table and with certain adjustments to reflect the “compensation actually paid” to such individuals, as calculated in accordance with rules adopted by the SEC in August 2022. “Compensation actually paid” does not reflect amounts actually realized by our PEO and Non-PEO NEOs and may be higher or lower than amounts, if any, that are actually realized by such individuals. The table below also provides information for each Covered Year regarding our cumulative total shareholder return, the total shareholder return of the S&P Healthcare & Supplies Index, our net income and our revenue.


Value of Initial Fixed $100
Investment Based on:


Year


Summary Compensation
Table Total for PEO ($)
(1)


Compensation Actually
Paid to PEO ($)
(1)(2)(3)


Average Summary Compensation Table Total for Non-PEO NEOs ($)(1)


Average Compensation Actually Paid to Non-PEO NEOs ($)(1)(2)(3)


Total Shareholder
Return ($)


Peer Group Total Shareholder Return ($) (4)


Net Income ($)


Revenue
($ Millions)
(5)


2025


4,650,661


(2,156,420

)


2,484,868


(1,327,953

)


92.62


76.03


(38.9

)


134.5


2024


6,982,453


5,115,927


5,804,227


4,221,090


305.60


76.22


(27.5

)


139.9


2023


3,081,597


11,796,221


1,808,267


6,263,724


358.40


72.30


(48.6

)


89.1


2022


1,025,471


1,245,648


649,355


762,518


112.62


76.64


(66.8

)


49.0


2022-2024


2025

Shelley Thunen


Shelley Thunen

Eric Weinberg


Eric Weinberg

Ilya Goldshleger, Ph.D.


Ilya Goldshleger, Ph.D.


Scott Gaines


(1)
Ron Kurtz, M.D. was our PEO for each year presented. The individuals comprising the Non-PEO NEOs for each year presented are listed above.
(2)
The amounts shown for Compensation Actually Paid have been calculated in accordance with Item 402(v) of Regulation S-K and do not reflect compensation actually earned, realized, or received by the Company’s NEOs. These amounts reflect the Summary Compensation Table Total with certain adjustments as described in footnote 3 below.
(3)
Compensation Actually Paid reflects the exclusions and inclusions of certain amounts for the PEO and the Non-PEO NEOs as set forth below. Equity values are calculated in accordance with FASB ASC Topic 718.
(4)
The Peer Group TSR set forth in this table utilizes the S&P Healthcare Select Industry Index, which we also utilize in the stock performance graph required by Item 201(e) of Regulation S-K included in our Annual Report for the year ended December 31, 2025. The comparison assumes $100 was invested for the period starting December 31, 2021, through the end of the listed year in the Company and in the S&P Healthcare Select Industry Index, respectively. Historical stock performance is not necessarily indicative of future stock performance.
(5)
We determined Revenue to be the most important financial performance measure used to link Company performance to Compensation Actually Paid to our PEO and Non-PEO NEOs in 2025.


Fiscal Year


2025


Summary Compensation Table Total for PEO ($)


4,650,661


Minus Grant Date Fair Value of Equity Awards in Summary Compensation Table ($)


(3,816,530

)


Plus Year End Fair Value of Equity Awards Granted During Year That are Outstanding and Unvested at Fiscal Year End ($)


1,023,383


Minus Year over Year Change in Fair Value of Outstanding and Unvested Equity Awards ($)


(2,508,864

)


Plus Fair Value as of Vesting Date of Equity Awards Granted and Vested in the Year ($)


327,561


Plus Change in Fair Value between the Vesting Date and the End of the Prior Year of Equity Awards Granted in Prior Years that Vested in the Year ($)


(1,832,631

)


Minus Fair Value at the End of the Prior Year of Equity Awards that Failed to Meet Vesting Conditions in the Year ($)


Compensation Actually Paid to PEO ($)


(2,156,420

)


Fiscal Year


2025


Average Summary Compensation Table Total for Non-PEO NEOs ($)


2,484,868


Minus Non-PEO NEO Average Grant Date Fair Value of Equity Awards in Summary Compensation Table ($)


(1,890,240

)


Plus Non-PEO NEO Average Year End Fair Value of Equity Awards Granted During Year That are Outstanding and Unvested at Fiscal Year End ($)


548,908


Minus Non-PEO NEO Average Year over Year Change in Fair Value of Outstanding and Unvested Equity Awards ($)


(1,722,997

)


Plus Non-PEO NEO Average Fair Value as of Vesting Date of Equity Awards Granted and Vested in the Year ($)


160,516


Plus Non-PEO NEO Average Year over Year Change in Fair Value between the Vesting Date and the End of the Prior Year of Equity Awards Granted in Prior Years that Vested in the Year ($)


(909,008

)


Minus Non-PEO NEO Average Fair Value at the End of the Prior Year of Equity Awards that Failed to Meet Vesting Conditions in the Year ($)


Average Compensation Actually Paid to Non-PEO NEOs ($)


(1,327,953

)


Company Selected Measure Name Revenue      
Named Executive Officers, Footnote

2022-2024


2025

Shelley Thunen


Shelley Thunen

Eric Weinberg


Eric Weinberg

Ilya Goldshleger, Ph.D.


Ilya Goldshleger, Ph.D.


Scott Gaines


(1)
Ron Kurtz, M.D. was our PEO for each year presented. The individuals comprising the Non-PEO NEOs for each year presented are listed above.
     
Peer Group Issuers, Footnote The Peer Group TSR set forth in this table utilizes the S&P Healthcare Select Industry Index      
PEO Total Compensation Amount $ 4,650,661 $ 6,982,453 $ 3,081,597 $ 1,025,471
PEO Actually Paid Compensation Amount (2,156,420) 5,115,927 11,796,221 1,245,648
Non-PEO NEO Average Total Compensation Amount 2,484,868 5,804,227 1,808,267 649,355
Non-PEO NEO Average Compensation Actually Paid Amount $ (1,327,953) 4,221,090 6,263,724 762,518
Compensation Actually Paid vs. Total Shareholder Return

img82098340_4.gif

     
Compensation Actually Paid vs. Net Income

img82098340_5.jpg

     
Compensation Actually Paid vs. Company Selected Measure

img82098340_6.gif

     
Tabular List, Table

Tabular List of Financial Performance Measures

The following list presents the financial performance measures that the Company considers to have been the most important in linking Compensation Actually Paid to our PEO and Non-PEO NEOs for 2025 to Company Performance. The measures in this list are not ranked.

Revenue;
LAL/LAL+ Revenue;
Gross Margin; and
Cash Use.
     
Total Shareholder Return Amount $ 92.62 305.6 358.4 112.62
Peer Group Total Shareholder Return Amount 76.03 76.22 72.3 76.64
Net Income (Loss) $ (38.9) $ (27.5) $ (48.6) $ (66.8)
Company Selected Measure Amount 134,500,000 139,900,000 89,100,000 49,000,000
Initial Fixed Investment Value $ 100,000      
Measure:: 1        
Pay vs Performance Disclosure        
Name Revenue      
Measure:: 2        
Pay vs Performance Disclosure        
Name LAL/LAL+ Revenue      
Measure:: 3        
Pay vs Performance Disclosure        
Name Gross Margin      
Measure:: 4        
Pay vs Performance Disclosure        
Name Cash      
Ron Kurtz M.D [Member]        
Pay vs Performance Disclosure        
PEO Name Ron Kurtz, M.D      
PEO | Aggregate Grant Date Fair Value of Equity Award Amounts Reported in Summary Compensation Table        
Pay vs Performance Disclosure        
Adjustment to Compensation, Amount $ (3,816,530)      
PEO | Year-end Fair Value of Equity Awards Granted in Covered Year that are Outstanding and Unvested        
Pay vs Performance Disclosure        
Adjustment to Compensation, Amount 1,023,383      
PEO | Year-over-Year Change in Fair Value of Equity Awards Granted in Prior Years That are Outstanding and Unvested        
Pay vs Performance Disclosure        
Adjustment to Compensation, Amount (2,508,864)      
PEO | Vesting Date Fair Value of Equity Awards Granted and Vested in Covered Year        
Pay vs Performance Disclosure        
Adjustment to Compensation, Amount 327,561      
PEO | Change in Fair Value as of Vesting Date of Prior Year Equity Awards Vested in Covered Year        
Pay vs Performance Disclosure        
Adjustment to Compensation, Amount (1,832,631)      
PEO | Prior Year End Fair Value of Equity Awards Granted in Any Prior Year that Fail to Meet Applicable Vesting Conditions During Covered Year        
Pay vs Performance Disclosure        
Adjustment to Compensation, Amount 0      
Non-PEO NEO | Aggregate Grant Date Fair Value of Equity Award Amounts Reported in Summary Compensation Table        
Pay vs Performance Disclosure        
Adjustment to Compensation, Amount (1,890,240)      
Non-PEO NEO | Year-end Fair Value of Equity Awards Granted in Covered Year that are Outstanding and Unvested        
Pay vs Performance Disclosure        
Adjustment to Compensation, Amount 548,908      
Non-PEO NEO | Year-over-Year Change in Fair Value of Equity Awards Granted in Prior Years That are Outstanding and Unvested        
Pay vs Performance Disclosure        
Adjustment to Compensation, Amount (1,722,997)      
Non-PEO NEO | Vesting Date Fair Value of Equity Awards Granted and Vested in Covered Year        
Pay vs Performance Disclosure        
Adjustment to Compensation, Amount 160,516      
Non-PEO NEO | Change in Fair Value as of Vesting Date of Prior Year Equity Awards Vested in Covered Year        
Pay vs Performance Disclosure        
Adjustment to Compensation, Amount (909,008)      
Non-PEO NEO | Prior Year End Fair Value of Equity Awards Granted in Any Prior Year that Fail to Meet Applicable Vesting Conditions During Covered Year        
Pay vs Performance Disclosure        
Adjustment to Compensation, Amount $ 0