Performance Management - Eaton Vance VT Floating-Rate Income Fund - Eaton Vance VT Floating-Rate Income Fund
Dec. 31, 2025
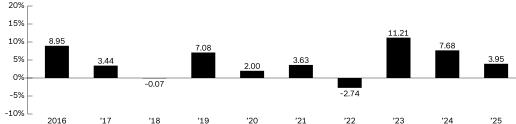
The following bar chart and table provide some indication of the risks of investing in the Fund by showing changes in the Fund’s performance from year to year and how the Fund’s average annual returns over time compare with those of one or more indexes intended to measure broad market performance. The Fund’s primary benchmark index was changed from the Morningstar® LSTA® US Leverage Loan IndexSM to the Bloomberg U.S. Universal Index effective May 1, 2024 to comply with the regulation that requires the Fund’s primary benchmark to represent the overall applicable market. The additional index in the table provides a means to compare the Fund’s average annual returns to a benchmark that the investment adviser believes is representative of the Fund’s investment universe. The returns in the bar chart are for Initial Class shares and do not reflect any insurance-related expenses and charges under a Variable Contract or expenses related to a Qualified Plan. If such charges were reflected, the returns would be lower. Thus, you should not compare the Fund’s returns directly with the performance of other products without taking into account all insurance-related charges and expenses payable under your Variable Contract or Qualified Plan. Past performance is not necessarily an indication of how the Fund will perform in the future.
|
High Quarter
|
June 30, 2020
|
6.87%
|
|
|
Low Quarter
|
March 31, 2020
|
-10.27%
|
|
|
One Year
|
Five Years
|
Ten Years
|
|
Initial Class Return Before Taxes
|
3.95%
|
4.64%
|
4.43%
|
|
ADV Class Return Before Taxes
|
4.34%
|
4.90%
|
4.69%
|
|
Institutional Class Return Before Taxes
|
4.51%
|
5.20%
|
4.98%
|
|
Bloomberg U.S. Universal Index (reflects no deduction for fees, expenses or taxes)
|
7.58%
|
0.06%
|
2.43%
|
|
Morningstar® LSTA® US Leveraged Loan IndexSM(reflects no deduction for fees, expenses or taxes)
|
5.90%
|
6.42%
|
5.82%
|
Institutional Class performance shown above for the period prior to May 1, 2016 (commencement of operations) is the performance of ADV Class shares at net asset value without adjustment for any differences in the expenses of the two classes. If adjusted for such differences, returns would be different. Investors cannot invest directly in an Index.
BLOOMBERG® is a trademark and service mark of Bloomberg Finance L.P. and its affiliates (collectively “Bloomberg”). BARCLAYS® is a trademark and service mark of Barclays Bank Plc (collectively with its affiliates, “Barclays”), used under license. Bloomberg or Bloomberg’s licensors, including Barclays, own all proprietary rights in the Bloomberg Barclays Indices. Neither Bloomberg nor Barclays is affiliated with Eaton Vance, and neither approves, endorses, reviews or recommends the Fund. Neither Bloomberg nor Barclays guarantees the timeliness, accurateness or completeness of any data or information relating to Bloomberg U.S. Universal Index, and neither shall be liable in any way to Eaton Vance, investors in the Fund or other third parties in respect of the use or accuracy of Bloomberg U.S. Universal Index or any data included therein.
Morningstar® LSTA® US Leveraged Loan Index is a product of Morningstar, Inc. (“Morningstar”) licensed for use by Eaton Vance. Morningstar® is a registered trademark of Morningstar licensed for certain use by Eaton Vance. Loan Syndications and Trading Association® and LSTA® are trademarks of the LSTA licensed for certain use by Morningstar, and further sublicensed by Morningstar for certain use by Eaton Vance. Neither Morningstar nor LSTA guarantees the accuracy and/or completeness of the Morningstar® LSTA® US Leveraged Loan Index or any data included therein, and shall have no liability for any errors, omissions, or interruptions therein.