Pay Versus Performance
In accordance with rules adopted by the SEC, we provide the following disclosure regarding executive “Compensation Actually Paid” or “CAP” (as calculated in accordance with SEC rules) and certain Company performance for the fiscal years listed below. You should refer to the Compensation Discussion and Analysis section in this proxy statement for a complete description of how executive compensation relates to Company performance and how the Compensation Committee makes its decisions.
(a) | (b) | (c) | (d) | (e) | (f) | (g) | (h) | (i) | ||||||||||||||||
Value of Initial Fixed $100 | ||||||||||||||||||||||||
Investment Based on: | ||||||||||||||||||||||||
Average | ||||||||||||||||||||||||
Summary | Summary | Average | ||||||||||||||||||||||
Compensation | Compensation | Compensation | Compensation | Total | Peer Group Total | |||||||||||||||||||
Table Total for | Actually Paid to | Table Total for | Actually Paid to | Shareholder | Shareholder | |||||||||||||||||||
PEO | PEO | Non-PEO NEOs | Non-PEO NEOs | Return | Return | Net Income | Adjusted EBITDA | |||||||||||||||||
Year | | ($) | | ($)(1)(2) | | ($) | | ($)(1)(2) | | ($) | | ($)(2) | | ($Thousands) | | ($Thousands)(3) | ||||||||
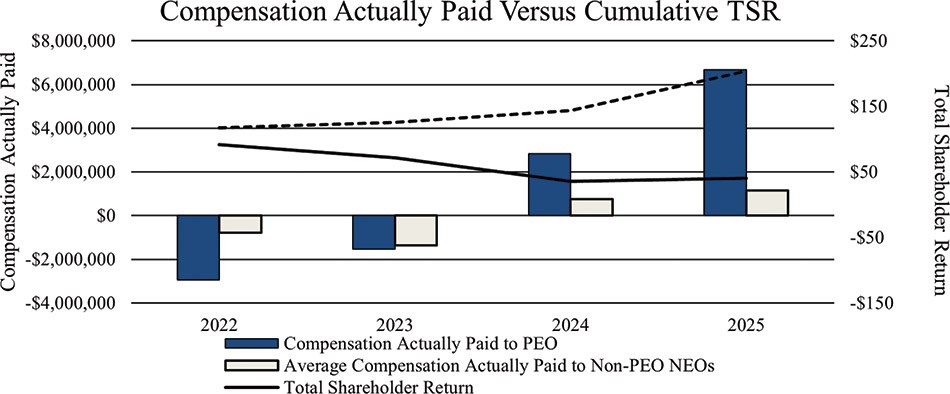
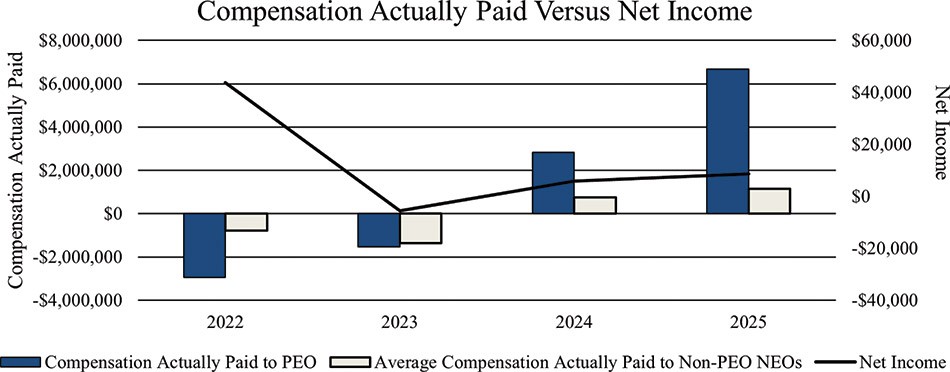
2025 | $ | 7,062,230 | $ | 6,674,263 | $ | 1,127,043 | $ | 1,142,535 | $ | 40.08 | $ | 203.54 | $ | 8,575 | $ | 46,142 | ||||||||
2024 | $ | 5,388,760 | $ | 2,833,112 | $ | 1,150,376 | $ | 745,479 | $ | 35.51 | $ | 143.36 | $ | 5,851 | $ | 33,386 | ||||||||
2023 | $ | 3,546,515 | $ | (1,525,485) | $ | 638,607 | $ | (1,369,060) | $ | 71.56 | $ | 125.31 | $ | (5,563) | $ | 12,278 | ||||||||
2022 | $ | 1,346,568 | $ | (2,949,432) | $ | 914,150 | $ | (786,351) | $ | 91.43 | $ | 117.37 | $ | 43,861 | $ | 87,436 | ||||||||
| (1) | Amounts represent Compensation Actually Paid to our principal executive officer (“PEO”) and the average Compensation Actually Paid to our remaining named executive officers for the relevant fiscal year, as determined under SEC rules (and described below), which includes the individuals indicated in the table below for each fiscal year: |
Year | | PEO | | Non-PEO NEOs |
2025 |
| Nicolas Finazzo |
| Gary Jones; Martin Garmendia; Craig Wright; Ben Tschirhart |
2024 |
| Nicolas Finazzo |
| Gary Jones; Martin Garmendia; James Fry; Iso Nezaj |
2023 |
| Nicolas Finazzo |
| Robert Nichols; Martin Garmendia |
2022 |
| Nicolas Finazzo |
| Robert Nichols; Gary Jones |
| (2) | Compensation actually paid to our named executive officers represents the “Total” compensation reported in the Summary Compensation Table for the applicable fiscal year, as adjusted as follows: |
2022 | 2023 | 2024 | 2025 | |||||||||||||||||||||
Average non-PEO | Average non-PEO | Average non-PEO | Average non-PEO | |||||||||||||||||||||
Adjustments | | PEO | | NEOs | | PEO | | NEOs | | PEO | | NEOs | | PEO | | NEOs | ||||||||
Deduction for Amounts Reported under the “Stock Awards” and “Option Awards” Columns in the Summary Compensation Table for Applicable Fiscal Year | $ | — | | $ | — | | $ | — | | $ | — | | $ | (4,323,601) | | $ | (603,140) | | $ | (5,999,999) | $ | (538,503) | ||
Increase based on ASC 718 Fair Value of Awards Granted during Applicable Fiscal Year that Remain Unvested as of Applicable Fiscal Year End, determined as of Applicable Fiscal Year End | $ | — | $ | — | $ | — | $ | — | $ | 1,767,953 | $ | 233,269 | $ | 5,060,060 | $ | 486,309 | ||||||||
Increase based on ASC 718 Fair Value of Awards Granted during Applicable Fiscal Year that Vested during Applicable Fiscal Year, determined as of Vesting Date | $ | — | $ | — | $ | — | $ | — | $ | — | $ | — | $ | — | $ | — | ||||||||
Increase/deduction for Awards Granted during Prior Fiscal Year that were Outstanding and Unvested as of Applicable Fiscal Year End, determined based on change in ASC 718 Fair Value from Prior Fiscal Year End to Applicable Fiscal Year End | $ | (2,432,000) | $ | (962,667) | $ | — | $ | — | $ | — | $ | (14,037) | $ | 679,513 | $ | 83,480 | ||||||||
Increase/deduction for Awards Granted during Prior Fiscal Year that Vested During Applicable Fiscal Year, determined based on change in ASC 718 Fair Value from Prior Fiscal Year End to Vesting Date | $ | (1,864,000) | $ | (737,833) | $ | (5,072,000) | $ | (2,007,667) | $ | — | $ | (3,034) | $ | (134,160) | $ | (14,794) | ||||||||
Deduction of ASC 718 Fair Value of Awards Granted during Prior Fiscal Year that were | $ | — | $ | — | $ | — | $ | — | $ | — | $ | — | $ | — | $ | — | ||||||||
Increase based on Dividends or Other Earnings Paid during Applicable Fiscal Year prior to Vesting Date | $ | — | $ | — | $ | — | $ | — | $ | — | $ | — | $ | — | $ | — | ||||||||
TOTAL ADJUSTMENTS | $ | (4,296,000) | $ | (1,700,500) | $ | (5,072,000) | $ | (2,007,667) | $ | (2,555,648) | $ | (386,942) | $ | (394,586) | $ | 16,492 | ||||||||
(a) | (b) | (c) | (d) | (e) | (f) | (g) | (h) | (i) | ||||||||||||||||
Value of Initial Fixed $100 | ||||||||||||||||||||||||
Investment Based on: | ||||||||||||||||||||||||
Average | ||||||||||||||||||||||||
Summary | Summary | Average | ||||||||||||||||||||||
Compensation | Compensation | Compensation | Compensation | Total | Peer Group Total | |||||||||||||||||||
Table Total for | Actually Paid to | Table Total for | Actually Paid to | Shareholder | Shareholder | |||||||||||||||||||
PEO | PEO | Non-PEO NEOs | Non-PEO NEOs | Return | Return | Net Income | Adjusted EBITDA | |||||||||||||||||
Year | | ($) | | ($)(1)(2) | | ($) | | ($)(1)(2) | | ($) | | ($)(2) | | ($Thousands) | | ($Thousands)(3) | ||||||||
2025 | $ | 7,062,230 | $ | 6,674,263 | $ | 1,127,043 | $ | 1,142,535 | $ | 40.08 | $ | 203.54 | $ | 8,575 | $ | 46,142 | ||||||||
2024 | $ | 5,388,760 | $ | 2,833,112 | $ | 1,150,376 | $ | 745,479 | $ | 35.51 | $ | 143.36 | $ | 5,851 | $ | 33,386 | ||||||||
2023 | $ | 3,546,515 | $ | (1,525,485) | $ | 638,607 | $ | (1,369,060) | $ | 71.56 | $ | 125.31 | $ | (5,563) | $ | 12,278 | ||||||||
2022 | $ | 1,346,568 | $ | (2,949,432) | $ | 914,150 | $ | (786,351) | $ | 91.43 | $ | 117.37 | $ | 43,861 | $ | 87,436 | ||||||||
| (1) | Amounts represent Compensation Actually Paid to our principal executive officer (“PEO”) and the average Compensation Actually Paid to our remaining named executive officers for the relevant fiscal year, as determined under SEC rules (and described below), which includes the individuals indicated in the table below for each fiscal year: |
Year | | PEO | | Non-PEO NEOs |
2025 |
| Nicolas Finazzo |
| Gary Jones; Martin Garmendia; Craig Wright; Ben Tschirhart |
2024 |
| Nicolas Finazzo |
| Gary Jones; Martin Garmendia; James Fry; Iso Nezaj |
2023 |
| Nicolas Finazzo |
| Robert Nichols; Martin Garmendia |
2022 |
| Nicolas Finazzo |
| Robert Nichols; Gary Jones |
2022 | 2023 | 2024 | 2025 | |||||||||||||||||||||
Average non-PEO | Average non-PEO | Average non-PEO | Average non-PEO | |||||||||||||||||||||
Adjustments | | PEO | | NEOs | | PEO | | NEOs | | PEO | | NEOs | | PEO | | NEOs | ||||||||
Deduction for Amounts Reported under the “Stock Awards” and “Option Awards” Columns in the Summary Compensation Table for Applicable Fiscal Year | $ | — | | $ | — | | $ | — | | $ | — | | $ | (4,323,601) | | $ | (603,140) | | $ | (5,999,999) | $ | (538,503) | ||
Increase based on ASC 718 Fair Value of Awards Granted during Applicable Fiscal Year that Remain Unvested as of Applicable Fiscal Year End, determined as of Applicable Fiscal Year End | $ | — | $ | — | $ | — | $ | — | $ | 1,767,953 | $ | 233,269 | $ | 5,060,060 | $ | 486,309 | ||||||||
Increase based on ASC 718 Fair Value of Awards Granted during Applicable Fiscal Year that Vested during Applicable Fiscal Year, determined as of Vesting Date | $ | — | $ | — | $ | — | $ | — | $ | — | $ | — | $ | — | $ | — | ||||||||
Increase/deduction for Awards Granted during Prior Fiscal Year that were Outstanding and Unvested as of Applicable Fiscal Year End, determined based on change in ASC 718 Fair Value from Prior Fiscal Year End to Applicable Fiscal Year End | $ | (2,432,000) | $ | (962,667) | $ | — | $ | — | $ | — | $ | (14,037) | $ | 679,513 | $ | 83,480 | ||||||||
Increase/deduction for Awards Granted during Prior Fiscal Year that Vested During Applicable Fiscal Year, determined based on change in ASC 718 Fair Value from Prior Fiscal Year End to Vesting Date | $ | (1,864,000) | $ | (737,833) | $ | (5,072,000) | $ | (2,007,667) | $ | — | $ | (3,034) | $ | (134,160) | $ | (14,794) | ||||||||
Deduction of ASC 718 Fair Value of Awards Granted during Prior Fiscal Year that were | $ | — | $ | — | $ | — | $ | — | $ | — | $ | — | $ | — | $ | — | ||||||||
Increase based on Dividends or Other Earnings Paid during Applicable Fiscal Year prior to Vesting Date | $ | — | $ | — | $ | — | $ | — | $ | — | $ | — | $ | — | $ | — | ||||||||
TOTAL ADJUSTMENTS | $ | (4,296,000) | $ | (1,700,500) | $ | (5,072,000) | $ | (2,007,667) | $ | (2,555,648) | $ | (386,942) | $ | (394,586) | $ | 16,492 | ||||||||
| (2) | Compensation actually paid to our named executive officers represents the “Total” compensation reported in the Summary Compensation Table for the applicable fiscal year, as adjusted as follows: |
2022 | 2023 | 2024 | 2025 | |||||||||||||||||||||
Average non-PEO | Average non-PEO | Average non-PEO | Average non-PEO | |||||||||||||||||||||
Adjustments | | PEO | | NEOs | | PEO | | NEOs | | PEO | | NEOs | | PEO | | NEOs | ||||||||
Deduction for Amounts Reported under the “Stock Awards” and “Option Awards” Columns in the Summary Compensation Table for Applicable Fiscal Year | $ | — | | $ | — | | $ | — | | $ | — | | $ | (4,323,601) | | $ | (603,140) | | $ | (5,999,999) | $ | (538,503) | ||
Increase based on ASC 718 Fair Value of Awards Granted during Applicable Fiscal Year that Remain Unvested as of Applicable Fiscal Year End, determined as of Applicable Fiscal Year End | $ | — | $ | — | $ | — | $ | — | $ | 1,767,953 | $ | 233,269 | $ | 5,060,060 | $ | 486,309 | ||||||||
Increase based on ASC 718 Fair Value of Awards Granted during Applicable Fiscal Year that Vested during Applicable Fiscal Year, determined as of Vesting Date | $ | — | $ | — | $ | — | $ | — | $ | — | $ | — | $ | — | $ | — | ||||||||
Increase/deduction for Awards Granted during Prior Fiscal Year that were Outstanding and Unvested as of Applicable Fiscal Year End, determined based on change in ASC 718 Fair Value from Prior Fiscal Year End to Applicable Fiscal Year End | $ | (2,432,000) | $ | (962,667) | $ | — | $ | — | $ | — | $ | (14,037) | $ | 679,513 | $ | 83,480 | ||||||||
Increase/deduction for Awards Granted during Prior Fiscal Year that Vested During Applicable Fiscal Year, determined based on change in ASC 718 Fair Value from Prior Fiscal Year End to Vesting Date | $ | (1,864,000) | $ | (737,833) | $ | (5,072,000) | $ | (2,007,667) | $ | — | $ | (3,034) | $ | (134,160) | $ | (14,794) | ||||||||
Deduction of ASC 718 Fair Value of Awards Granted during Prior Fiscal Year that were | $ | — | $ | — | $ | — | $ | — | $ | — | $ | — | $ | — | $ | — | ||||||||
Increase based on Dividends or Other Earnings Paid during Applicable Fiscal Year prior to Vesting Date | $ | — | $ | — | $ | — | $ | — | $ | — | $ | — | $ | — | $ | — | ||||||||
TOTAL ADJUSTMENTS | $ | (4,296,000) | $ | (1,700,500) | $ | (5,072,000) | $ | (2,007,667) | $ | (2,555,648) | $ | (386,942) | $ | (394,586) | $ | 16,492 | ||||||||
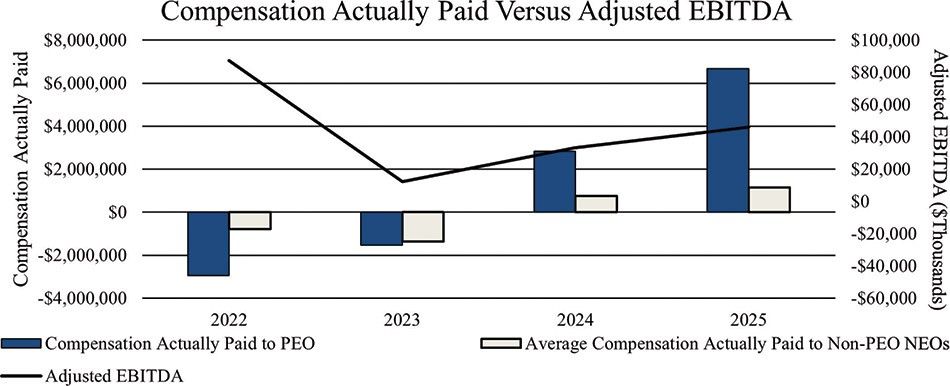
We believe the following performance measures represent the most important financial performance measures used by us to link compensation actually paid to our NEOs for the fiscal year ended December 31, 2025:
| ● | Adjusted EBITDA |
| ● | Revenue |