Pay vs Performance Disclosure - USD ($)
Dec. 31, 2025
Dec. 31, 2024
Dec. 31, 2023
Dec. 31, 2022
Dec. 31, 2021
| Value of Initial Fixed $100 Investment Based on: | ||||||||||||||||||||||||||
| Year | Summary Compensation Table Total for PEO ($)(1) | Compensation Actually Paid to PEO ($)(2) | Average Summary Compensation Table Total for Non-PEO Named Executive Officers ($)(1) | Average Compensation Actually Paid to Non-PEO Named Executive Officers ($)(2) | Total Shareholder Return ($) | Peer Group Total Shareholder Return ($)(3) | Net (Loss) Income (in thousands) ($)(4) | Total Revenue (in thousands) ($)(5) | ||||||||||||||||||
| 2025 | 4,079,043 | 3,205,596 | 1,948,190 | 1,577,965 | 22.58 | 125.55 | (103,265) | 255,869 | ||||||||||||||||||
| 2024 | 4,407,100 | 667,050 | 2,348,215 | 713,977 | 24.36 | 101.02 | (187,123) | 207,539 | ||||||||||||||||||
| 2023 | 3,124,165 | 9,660,192 | 2,045,115 | 3,676,741 | 45.21 | 97.97 | 40,720 | 216,666 | ||||||||||||||||||
| 2022 | 3,916,032 | (3,046,539) | 1,568,352 | 187,840 | 23.60 | 94.55 | (149,189) | 180,955 | ||||||||||||||||||
| 2021 | 8,493,477 | (21,063,411) | 4,057,728 | (2,628,730) | 43.99 | 96.98 | (101,219) | 137,931 | ||||||||||||||||||
402(v) of Regulation S-K. In accordance with the requirements of Item 402(v) of Regulation S-K, the following prescribed adjustments were made to Dr. Farid’s and to our Non-PEO named executive officers’ total compensation as reported in the Summary Compensation Table for each year, to determine the amount of compensation actually paid. The Summary Compensation Table amounts and the “compensation actually paid” amounts do not reflect the actual amount of compensation earned by or paid to our executives during the applicable years, but rather are amounts determined in accordance with Item 402 of Regulation S-K under the Exchange Act.
| 2025 | 2024 | 2023 | 2022 | 2021 | ||||||||||||||||||||||||||||||||||||||||
| PEO | Average Non-PEO Named Executive Officers* | PEO | Average Non-PEO Named Executive Officers* | PEO | Average Non-PEO Named Executive Officers* | PEO | Average Non-PEO Named Executive Officers* | PEO | Average Non-PEO Named Executive Officers* | |||||||||||||||||||||||||||||||||||
| Total Compensation from Summary Compensation Table | $ | 4,079,043 | $ | 1,948,190 | $ | 4,407,100 | $ | 2,348,215 | $ | 3,124,165 | $ | 2,045,115 | $ | 3,916,032 | $ | 1,568,352 | $ | 8,493,477 | $ | 4,057,728 | ||||||||||||||||||||||||
| Adjustments for Equity Awards | ||||||||||||||||||||||||||||||||||||||||||||
| Subtract grant date fair value of equity awards reported in the Summary Compensation Table | (2,763,376) | (1,107,316) | (3,162,113) | (1,487,348) | (2,067,787) | (1,380,940) | (2,877,355) | (985,122) | (7,470,776) | (3,486,362) | ||||||||||||||||||||||||||||||||||
| Add year-end fair value of awards granted in the covered year that are outstanding and unvested at covered year-end | 2,228,931 | 877,782 | 2,784,677 | 1,351,001 | 3,378,111 | 1,802,671 | 1,995,200 | 674,500 | 1,843,500 | 860,300 | ||||||||||||||||||||||||||||||||||
| Add year-over-year change in year-end fair values for awards granted in prior years that were outstanding and unvested at covered year-end | (348,225) | (66,495) | (1,736,649) | (859,205) | 2,160,032 | 707,069 | (3,800,546) | (464,474) | (24,233,997) | (3,857,422) | ||||||||||||||||||||||||||||||||||
| Add fair value at vest date for awards granted and vested in covered year | — | — | — | — | — | — | — | — | — | — | ||||||||||||||||||||||||||||||||||
| Add change in fair values between prior year-end fair values and vest date fair values for awards granted in prior years for which vesting conditions were satisfied during covered year | 9,223 | (74,196) | (1,625,965) | (638,686) | 3,065,671 | 502,826 | (2,279,870) | (302,116) | 304,385 | (202,974) | ||||||||||||||||||||||||||||||||||
| Subtract fair value at end of the prior year of awards granted in any prior year that failed to meet applicable vesting conditions in covered year | — | — | — | — | — | — | — | (303,300) | — | — | ||||||||||||||||||||||||||||||||||
| Add dividends or other earnings paid on stock or option awards in the covered year prior to vesting if not otherwise included in the total compensation for the covered year | — | — | — | — | — | — | — | — | — | — | ||||||||||||||||||||||||||||||||||
| Total Adjustments for Equity Awards | $ | (873,447) | $ | (370,225) | $ | (3,740,050) | $ | (1,634,238) | $ | 6,536,027 | $ | 1,631,626 | $ | (6,962,571) | $ | (1,380,512) | $ | (29,556,888) | $ | (6,686,458) | ||||||||||||||||||||||||
| Total “Compensation Actually Paid” | $ | 3,205,596 | $ | 1,577,965 | $ | 667,050 | $ | 713,977 | $ | 9,660,192 | $ | 3,676,741 | $ | (3,046,539) | $ | 187,840 | $ | (21,063,411) | $ | (2,628,730) | ||||||||||||||||||||||||
* Amounts presented are averages for the entire group of Non-PEO named executive officers.
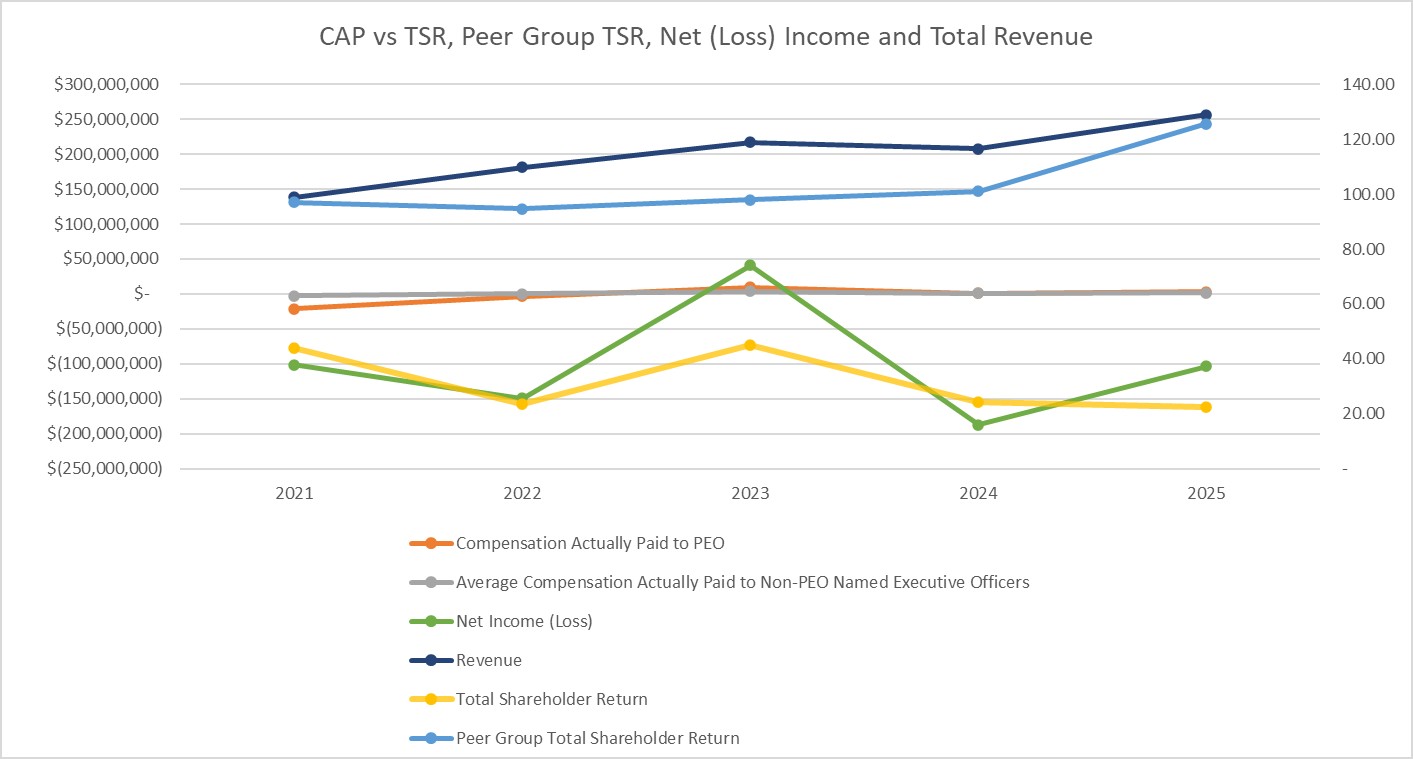
The following line chart presents a graphical comparison of executive compensation actually paid to our PEO and the average executive compensation actually paid to the Non-PEO named executive officers set forth in the Pay Versus Performance table above, as compared against the following performance measures: the Company's (1) cumulative total shareholder return, (2) peer group total shareholder return, (3) net income (loss), and (4) total revenue. For purposes of comparison, the Company’s cumulative total shareholder return and peer group total shareholder return in the following chart has been presented on a scaled basis, assuming an initial starting value of $100 in each instance.
When reviewing the relationship between pay versus performance in the chart below, it is important to note that a substantial portion of our PEO and non-PEO named executive officers’ compensation consisted of stock options and/or RSUs with time-based vesting and PRSUs with performance-based vesting. As the compensation actually paid as calculated pursuant to Item 402(v) of Regulation S-K is based on the accounting changes in the fair value of such options, the value varies significantly with the performance of our common stock. Therefore, notwithstanding the increase in the Company’s total revenue (our most important financial performance measure that is not otherwise required to be disclosed in the table), the compensation actually paid to our PEO and the average compensation actually paid to our non-PEO named executive officers were heavily impacted by the Company’s total shareholder return.
| Total revenue | ||
Progress of our collaborative and proprietary drug discovery programs | ||
| Advancements in the science and technology underlying our platform | ||
For the stock options values included in the table above, the valuation assumptions used to calculate fair value were materially different from those used to calculate grant date fair value. The assumptions used in determining fair value of the stock options that vested during 2021, 2022, 2023, 2024 and 2025 or that were outstanding as of December 31, 2021, December 31, 2022, December 31, 2023, December 31, 2024 or December 31, 2025, as applicable, were as follows:
| Options Vested During Year or Outstanding on December 31 of: | |||||||||||||||||||||||||||||
| 2025 | 2024 | 2023 | 2022 | 2021 | |||||||||||||||||||||||||
| Expected Volatility | 64% - 70% | 64% - 68% | 56% - 74% | 57% - 71% | 56% - 62% | ||||||||||||||||||||||||
| Risk-Free Interest Rate | 3.48% - 4.41% | 3.46% - 4.65% | 3.54% - 4.88% | 0.81% - 4.56% | 0.13% - 1.46% | ||||||||||||||||||||||||
| Expected Dividend Yield | —% | —% | —% | —% | —% | ||||||||||||||||||||||||
| Expected Term (in years) | 0.64 - 6.54 | 2.37 - 6.54 | 2.21 - 7.39 | 2.07 - 7.88 | 1.99 - 7.89 | ||||||||||||||||||||||||
(5)In the Company’s assessment, total revenue is the financial performance measure that is the most important financial performance measure used by the Company for the most recently completed fiscal year, to link compensation actually paid to performance.