| PTC Therapeutics PIVOT -HD LTE 24 -Month Interim Analysis Results PTC Therapeutics PIVOT -HD LTE 24 -Month Interim Analysis Results PIVOT -HD Extension Study 24 -Month Topline Interim Analysis Results 1 Matthew B. Klein, MD CEO April 2026 Patient living with HD |
| PTC Therapeutics PIVOT-HD LTE 24-Month Interim Analysis Results This presentation contains forward-looking statements within the meaning of The Private Securities Litigation Reform Act of 1995. All statements contained in this presentation, other than statements of historic fact, are forward-looking statements, including statements with respect to the future expectations, plans and prospects for PTC, PTC's strategy, including with respect to the expected timing of clinical trials and studies, availability of data, regulatory submissions and responses, and other matters, future operations, future financial position, future revenues, projected costs, and the objectives of management. Other forward-looking statements may be identified by the words, "guidance", "plan," "anticipate," "believe," "estimate," "expect," "intend," "may," "target," "potential," "will," "would," "could," "should," "continue," and similar expressions. PTC's actual results, performance or achievements could differ materially from those expressed or implied by forward-looking statements it makes as a result of a variety of risks and uncertainties, including those related to: the outcome of pricing, coverage and reimbursement negotiations with third party payors for PTC's products or product candidates that PTC commercializes or may commercialize in the future; expectations with respect to PTC's license and collaboration agreement with Novartis Pharmaceuticals Corporation for votoplam for the treatment of Huntington’s disease including its right to receive development, regulatory and sales milestones, profit sharing and royalty payments from Novartis, the design and expected timing of clinical trials and studies, the availability of data, and regulatory submissions and responses, including potential accelerated approval; significant business effects, including the effects of industry, market, economic, political or regulatory conditions; changes in tax and other laws, regulations, rates and policies; the eligible patient base and commercial potential of PTC's products and product candidates; PTC's scientific approach and general development progress; the sufficiency of PTC's cash resources and its ability to obtain adequate financing in the future for its foreseeable and unforeseeable operating expenses and capital expenditures; and the factors discussed in the "Risk Factors" section of PTC's most recent Annual Report on Form 10-K, as well as any updates to these risk factors filed from time to time in PTC's other filings with the SEC. You are urged to carefully consider all such factors. As with any pharmaceutical under development, there are significant risks in the development, regulatory approval and commercialization of new products. There are no guarantees that any product will receive or maintain regulatory approval in any territory or prove to be commercially successful. The forward-looking statements contained herein represent PTC's views only as of the date of this presentation and PTC does not undertake or plan to update or revise any such forward-looking statements to reflect actual results or changes in plans, prospects, assumptions, estimates or projections, or other circumstances occurring after the date of this presentation except as required by law. Forward Looking Statements 2 |
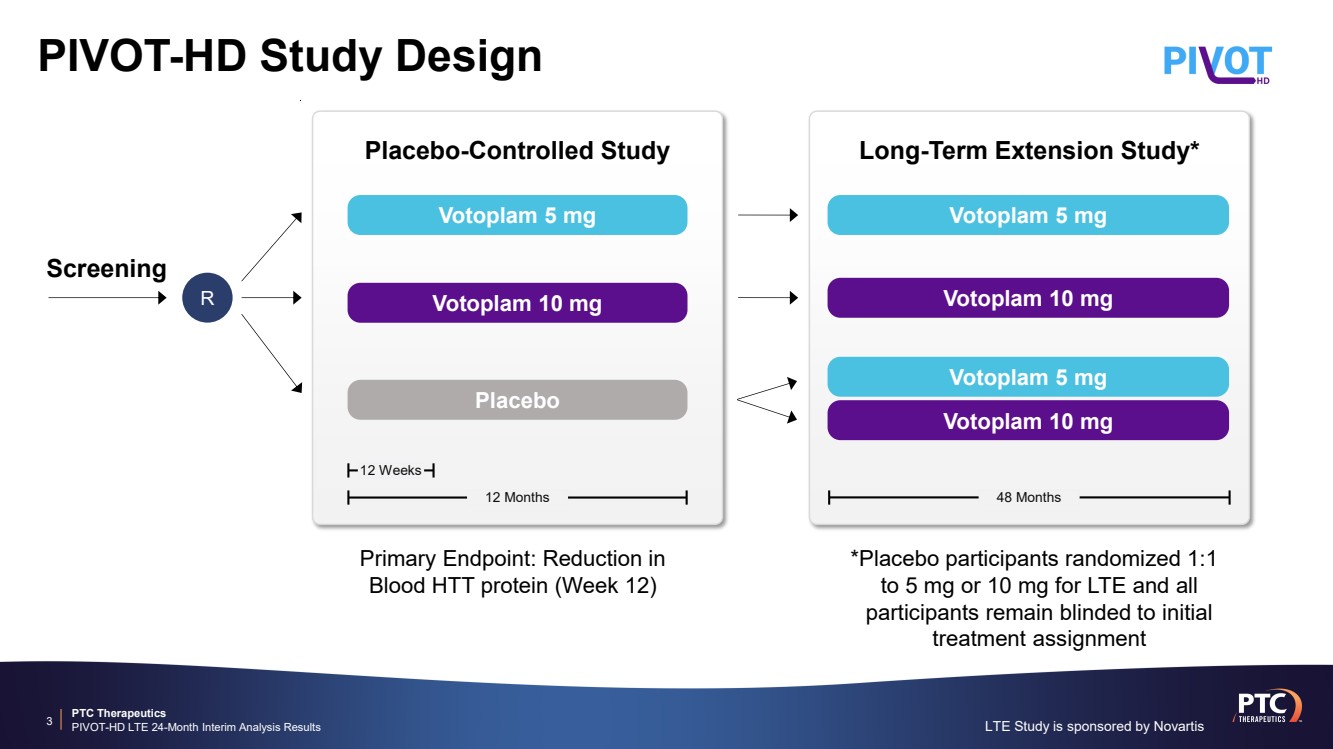
| PTC Therapeutics PIVOT-HD LTE 24-Month Interim Analysis Results PIVOT-HD Study Design 3 *Placebo participants randomized 1:1 to 5 mg or 10 mg for LTE and all participants remain blinded to initial treatment assignment Primary Endpoint: Reduction in Blood HTT protein (Week 12) 12 Weeks Placebo-Controlled Study 12 Months Placebo Votoplam 10 mg Votoplam 5 mg 48 Months Long-Term Extension Study* Screening R Votoplam 10 mg Votoplam 5 mg Votoplam 10 mg Votoplam 5 mg LTE Study is sponsored by Novartis |
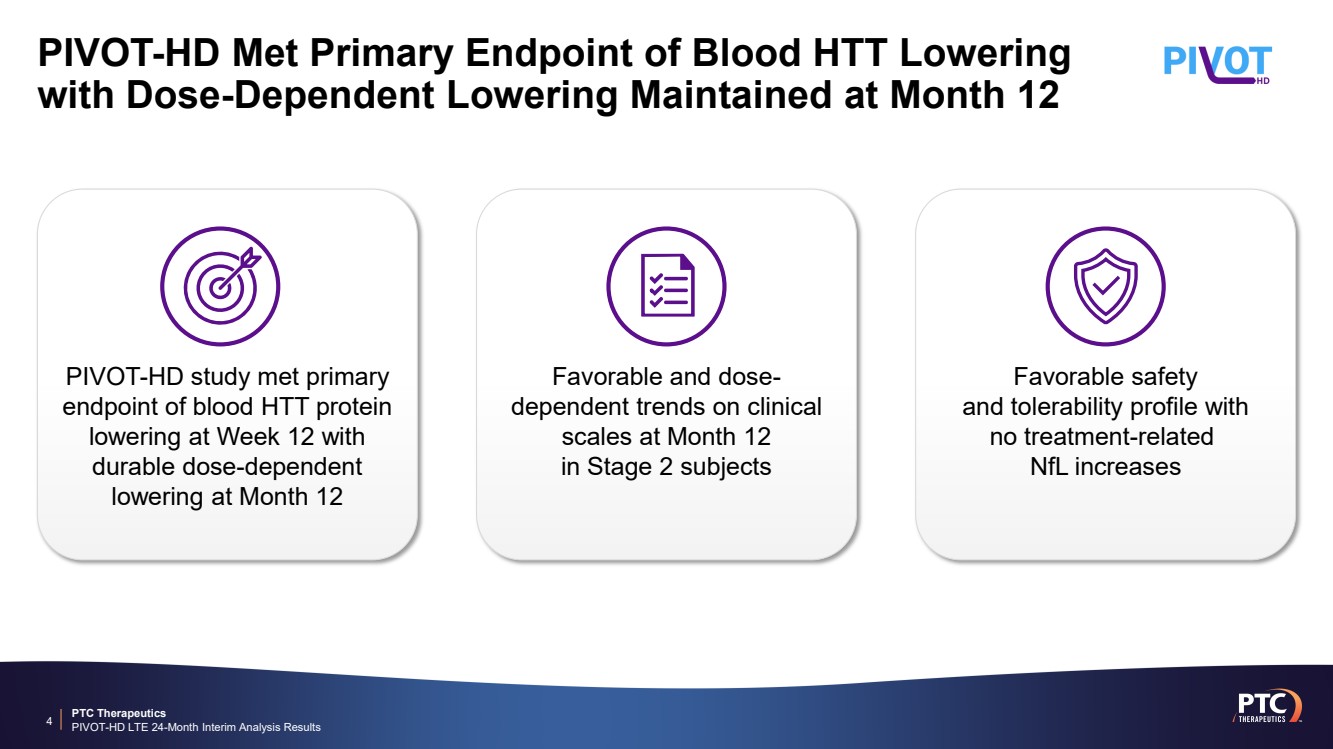
| PTC Therapeutics PIVOT-HD LTE 24-Month Interim Analysis Results PIVOT-HD Met Primary Endpoint of Blood HTT Lowering with Dose-Dependent Lowering Maintained at Month 12 4 Favorable safety and tolerability profile with no treatment-related NfL increases Favorable and dose-dependent trends on clinical scales at Month 12 in Stage 2 subjects PIVOT-HD study met primary endpoint of blood HTT protein lowering at Week 12 with durable dose-dependent lowering at Month 12 |
| PTC Therapeutics PIVOT-HD LTE 24-Month Interim Analysis Results 5 PTC Therapeutics PIVOT-HD LTE 24-Month Interim Analysis Results 24-Month Interim Analysis Results |

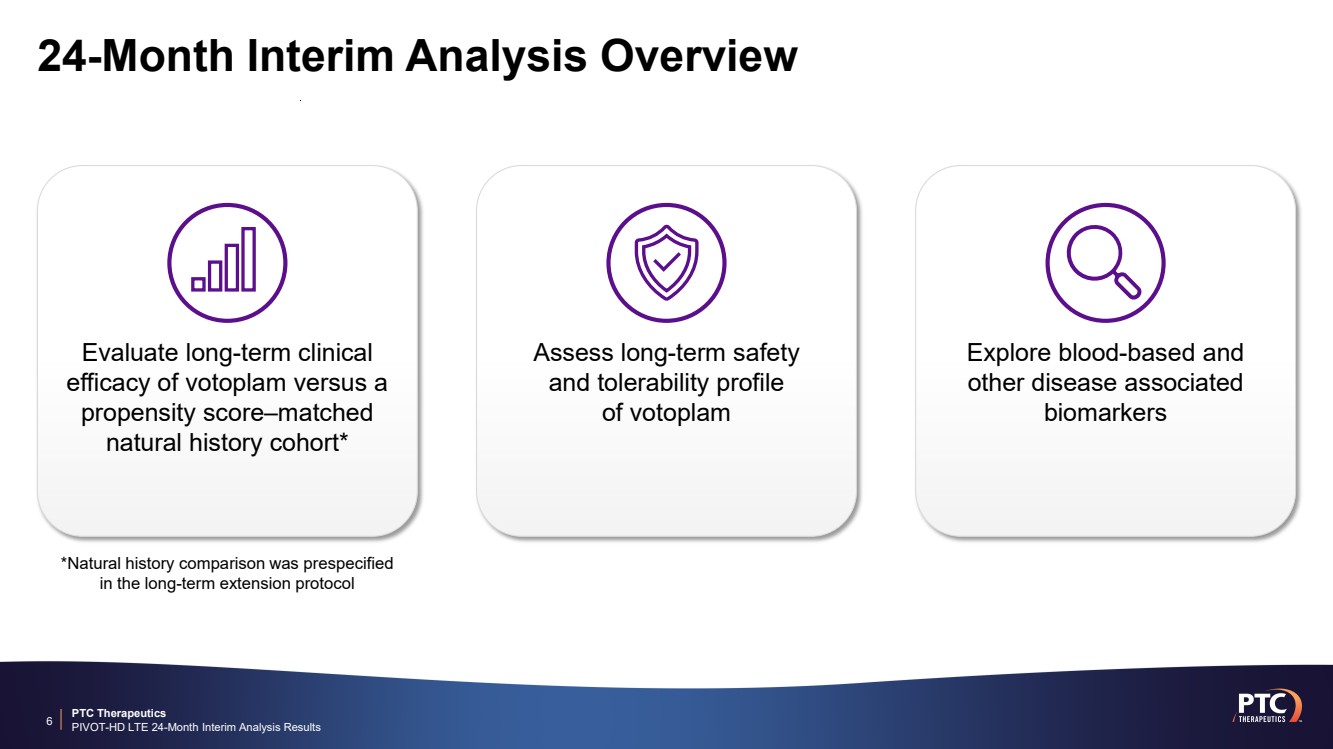
| PTC Therapeutics PIVOT-HD LTE 24-Month Interim Analysis Results 24-Month Interim Analysis Overview 6 Explore blood-based and other disease associated biomarkers Assess long-term safety and tolerability profile of votoplam Evaluate long-term clinical efficacy of votoplam versus a propensity score–matched natural history cohort* *Natural history comparison was prespecified in the long-term extension protocol |
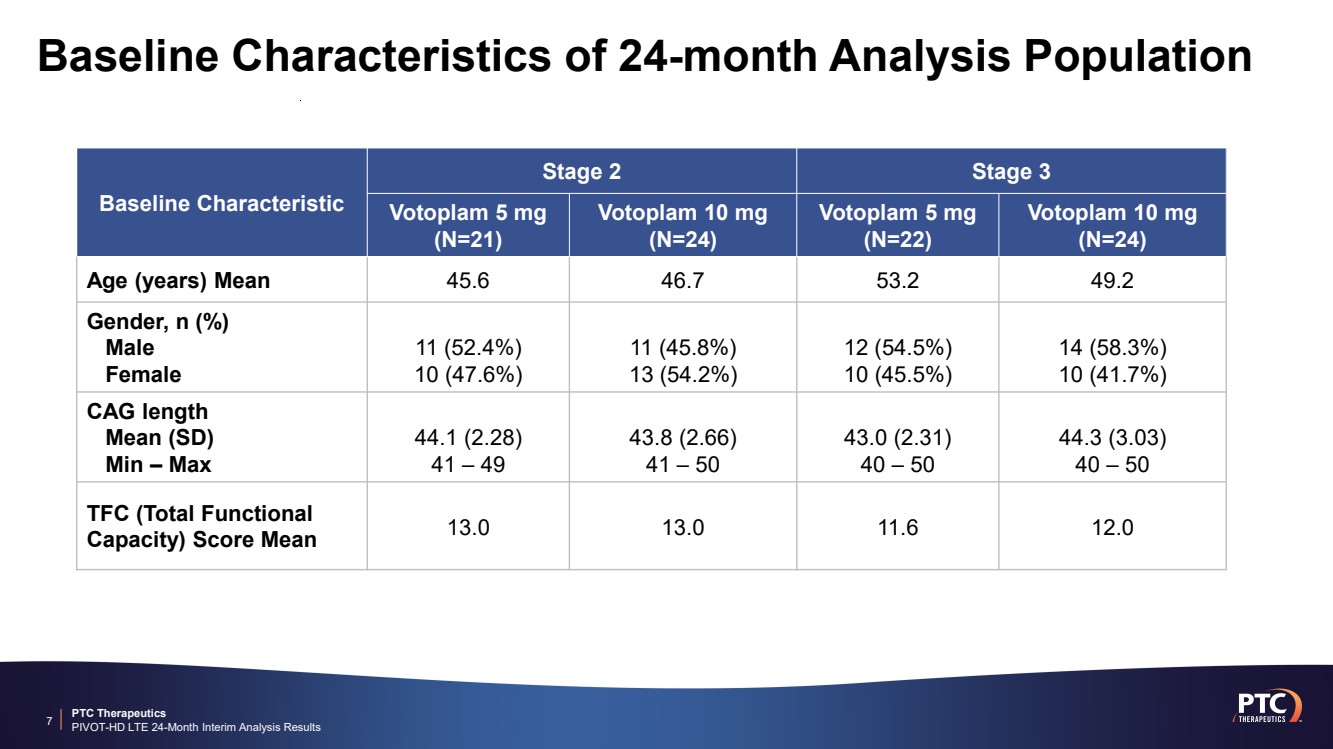
| PTC Therapeutics PIVOT-HD LTE 24-Month Interim Analysis Results Baseline Characteristics of 24-month Analysis Population 7 Baseline Characteristic Stage 2 Stage 3 Votoplam 5 mg (N=21) Votoplam 10 mg (N=24) Votoplam 5 mg (N=22) Votoplam 10 mg (N=24) Age (years) Mean 45.6 46.7 53.2 49.2 Gender, n (%) Male Female 11 (52.4%) 10 (47.6%) 11 (45.8%) 13 (54.2%) 12 (54.5%) 10 (45.5%) 14 (58.3%) 10 (41.7%) CAG length Mean (SD) Min – Max 44.1 (2.28) 41 – 49 43.8 (2.66) 41 – 50 43.0 (2.31) 40 – 50 44.3 (3.03) 40 – 50 TFC (Total Functional Capacity) Score Mean 13.0 13.0 11.6 12.0 |
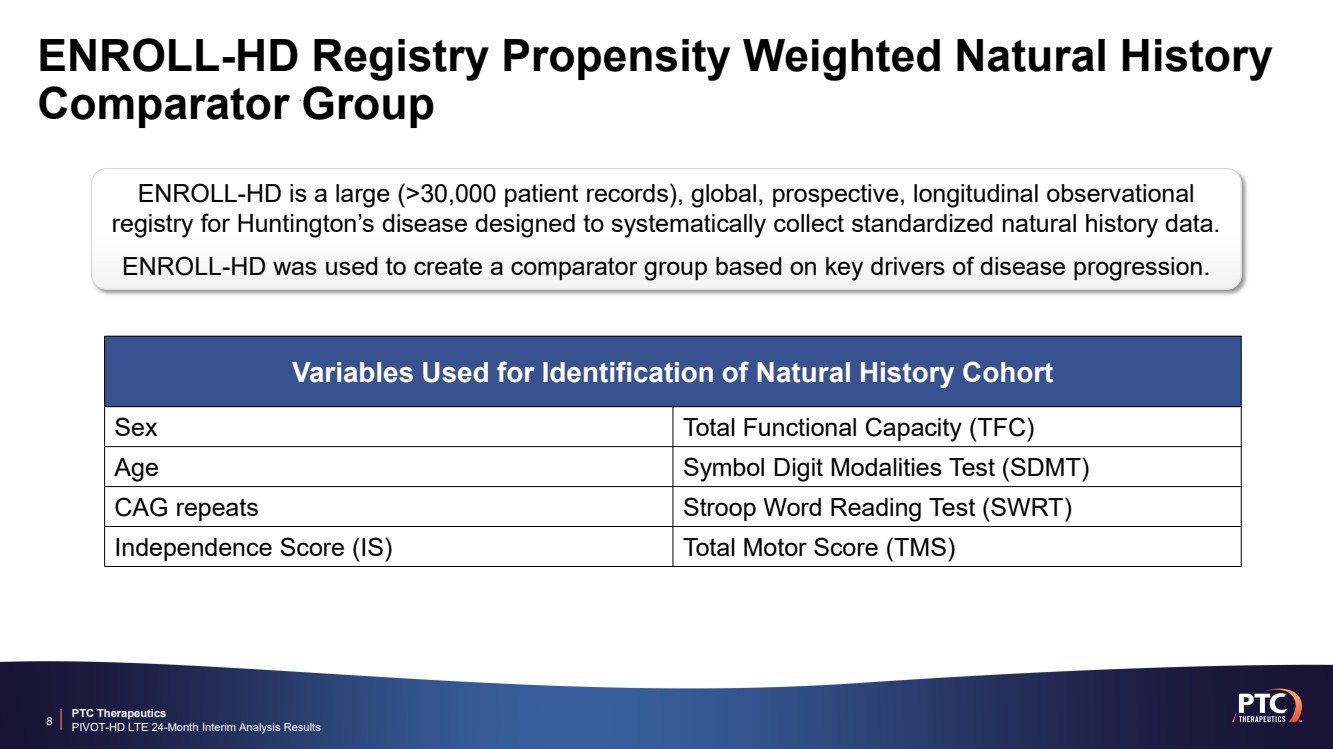
| PTC Therapeutics PIVOT-HD LTE 24-Month Interim Analysis Results ENROLL-HD Registry Propensity Weighted Natural History Comparator Group 8 ENROLL-HD is a large (>30,000 patient records), global, prospective, longitudinal observational registry for Huntington’s disease designed to systematically collect standardized natural history data. ENROLL-HD was used to create a comparator group based on key drivers of disease progression. Variables Used for Identification of Natural History Cohort Sex Total Functional Capacity (TFC) Age Symbol Digit Modalities Test (SDMT) CAG repeats Stroop Word Reading Test (SWRT) Independence Score (IS) Total Motor Score (TMS) |
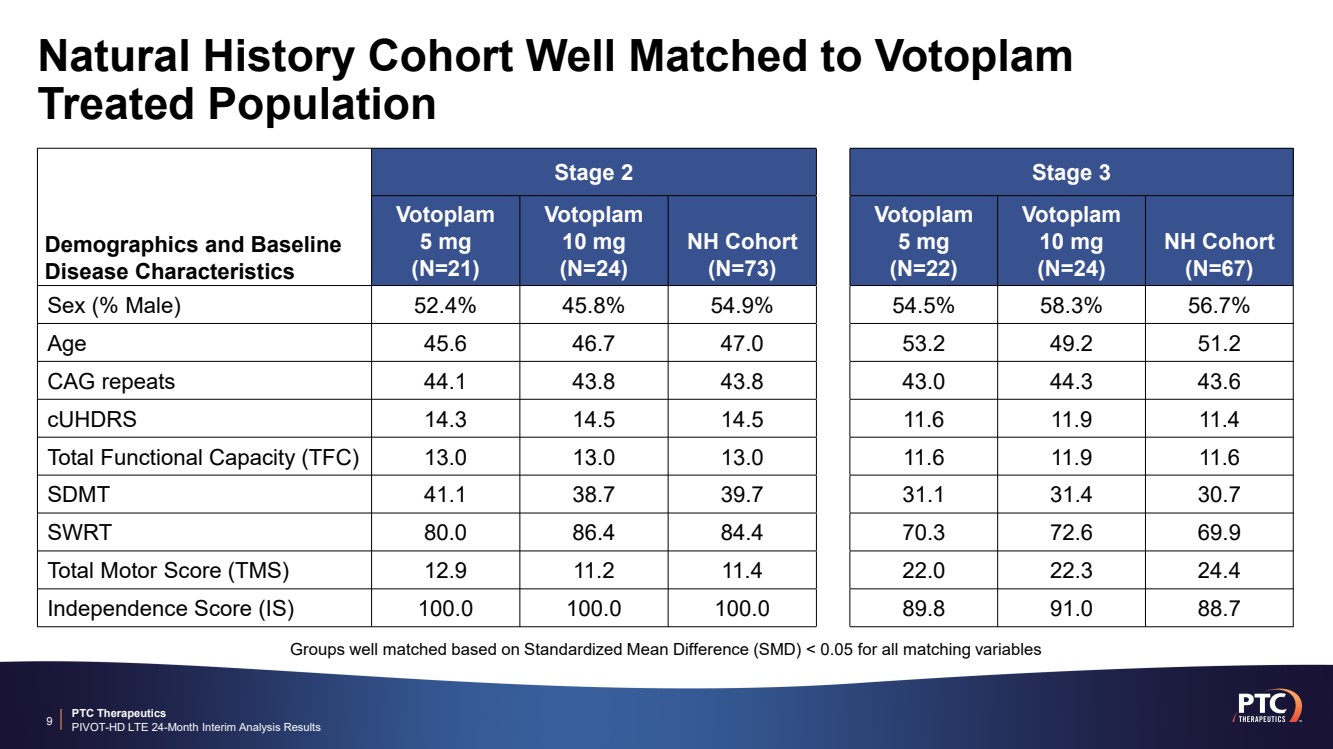
| PTC Therapeutics PIVOT-HD LTE 24-Month Interim Analysis Results Natural History Cohort Well Matched to Votoplam Treated Population 9 Demographics and Baseline Disease Characteristics Stage 2 Stage 3 Votoplam 5 mg (N=21) Votoplam 10 mg (N=24) NH Cohort (N=73) Votoplam 5 mg (N=22) Votoplam 10 mg (N=24) NH Cohort (N=67) Sex (% Male) 52.4% 45.8% 54.9% 54.5% 58.3% 56.7% Age 45.6 46.7 47.0 53.2 49.2 51.2 CAG repeats 44.1 43.8 43.8 43.0 44.3 43.6 cUHDRS 14.3 14.5 14.5 11.6 11.9 11.4 Total Functional Capacity (TFC) 13.0 13.0 13.0 11.6 11.9 11.6 SDMT 41.1 38.7 39.7 31.1 31.4 30.7 SWRT 80.0 86.4 84.4 70.3 72.6 69.9 Total Motor Score (TMS) 12.9 11.2 11.4 22.0 22.3 24.4 Independence Score (IS) 100.0 100.0 100.0 89.8 91.0 88.7 Groups well matched based on Standardized Mean Difference (SMD) < 0.05 for all matching variables |
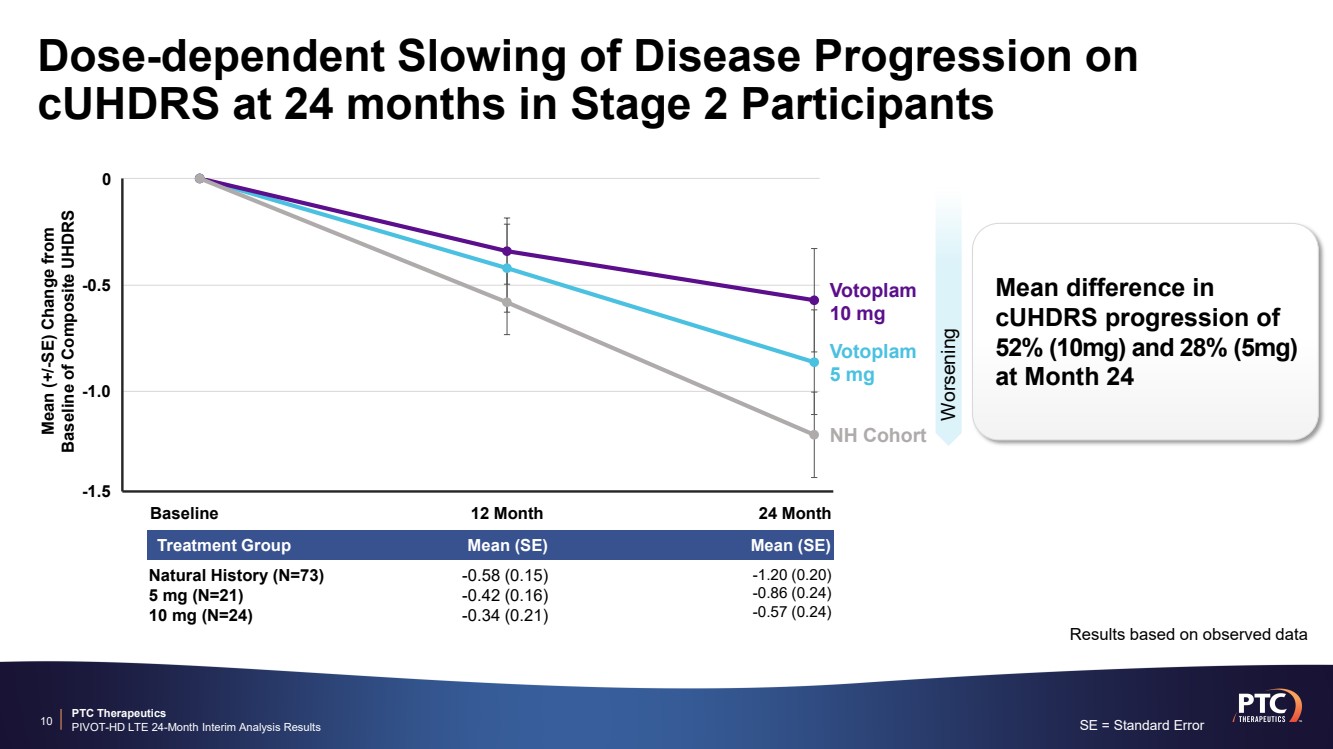
| PTC Therapeutics PIVOT-HD LTE 24-Month Interim Analysis Results Dose-dependent Slowing of Disease Progression on cUHDRS at 24 months in Stage 2 Participants 10 Worsening Results based on observed data Baseline 12 Month 24 Month Mean (+/-SE) Change from Baseline of Composite UHDRS 0 -0.5 -1.0 -1.5 NH Cohort Votoplam 5 mg Votoplam 10 mg Mean difference in cUHDRS progression of 52% (10mg) and 28% (5mg) at Month 24 SE = Standard Error Treatment Group Mean (SE) Mean (SE) -1.20 (0.20) -0.86 (0.24) -0.57 (0.24) -0.58 (0.15) -0.42 (0.16) -0.34 (0.21) Natural History (N=73) 5 mg (N=21) 10 mg (N=24) |
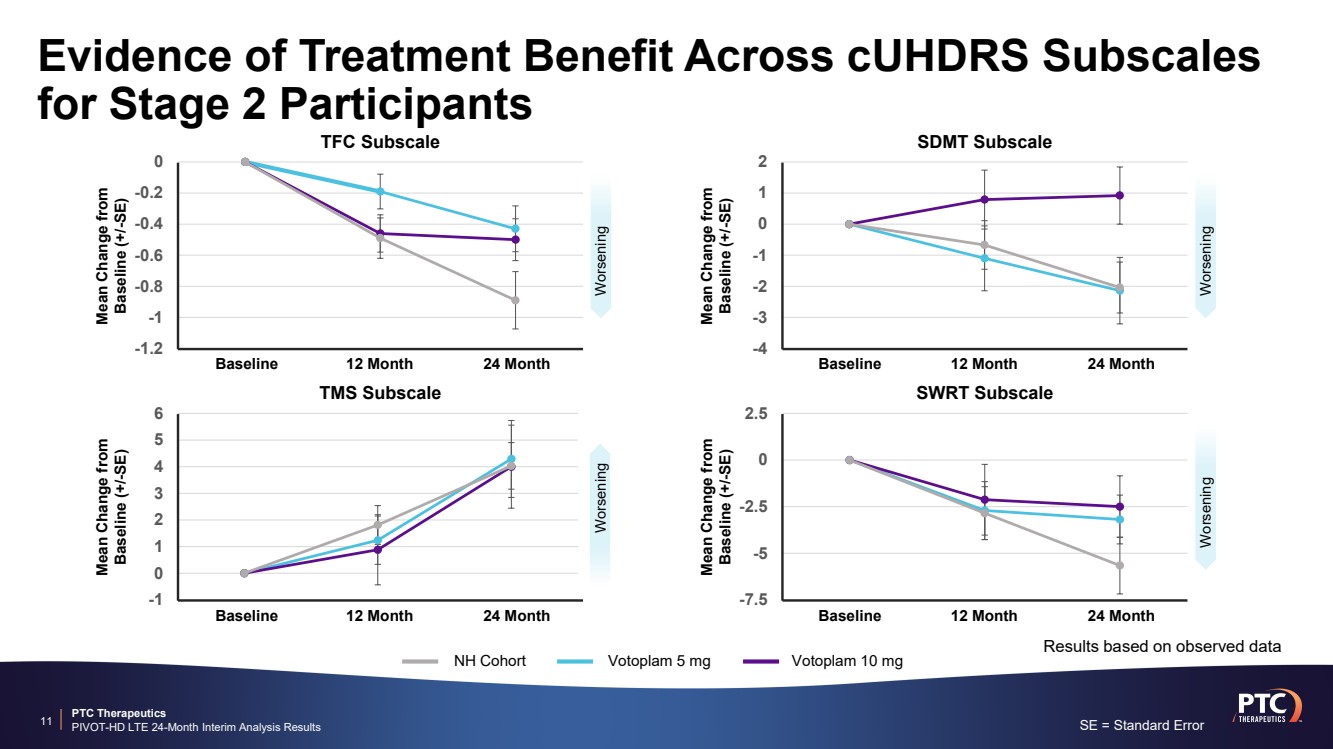
| PTC Therapeutics PIVOT-HD LTE 24-Month Interim Analysis Results -4 -3 -2 -1 0 1 2 Evidence of Treatment Benefit Across cUHDRS Subscales for Stage 2 Participants 11 -1.2 -1 -0.8 -0.6 -0.4 -0.2 0 Baseline 12 Month 24 Month Mean Change from Baseline (+/-SE) TFC Subscale Baseline 12 Month 24 Month Mean Change from Baseline (+/-SE) SDMT Subscale -1 0 1 2 3 4 5 6 Baseline 12 Month 24 Month Mean Change from Baseline (+/-SE) TMS Subscale -7.5 -5 -2.5 0 2.5 Baseline 12 Month 24 Month Mean Change from Baseline (+/-SE) SWRT Subscale NH Cohort Votoplam 5 mg Votoplam 10 mg Worsening Worsening Worsening Worsening SE = Standard Error Results based on observed data |
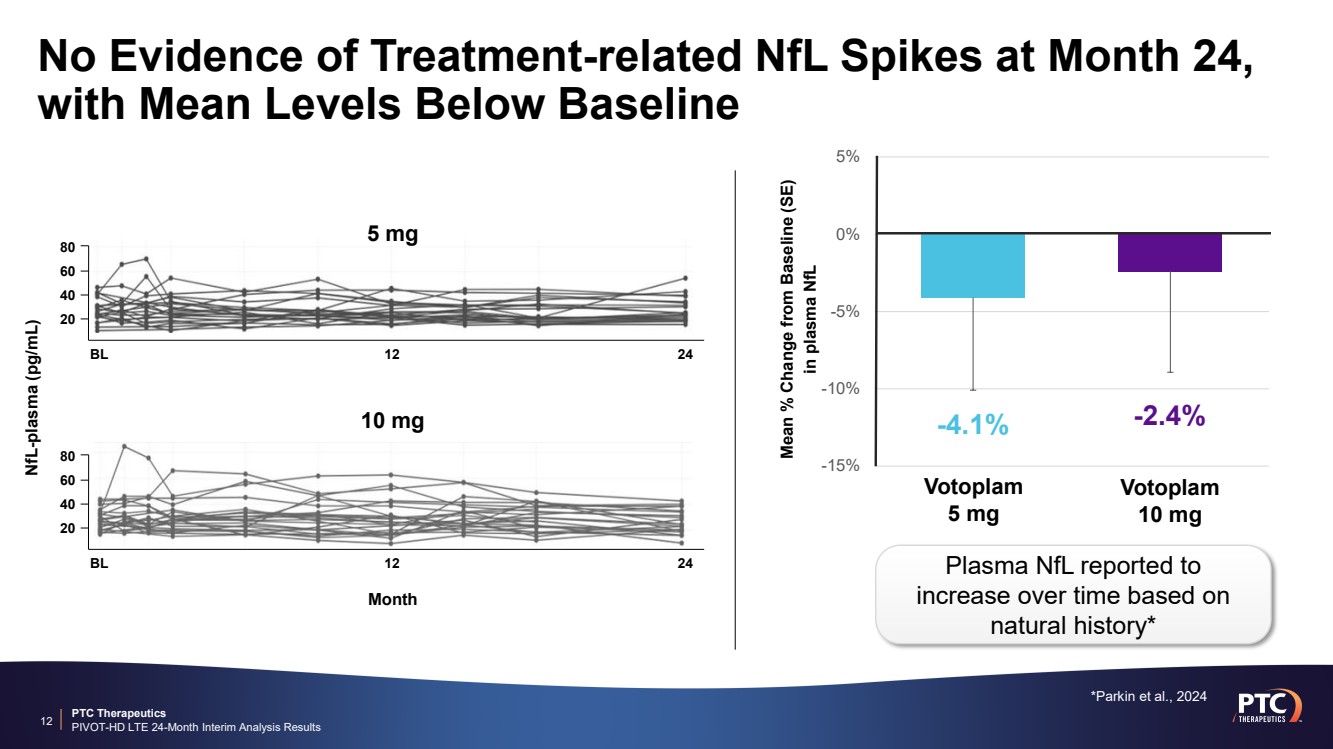
| PTC Therapeutics PIVOT-HD LTE 24-Month Interim Analysis Results No Evidence of Treatment-related NfL Spikes at Month 24, with Mean Levels Below Baseline 12 -15% -10% -5% 0% 5% Mean % Change from Baseline (SE) in plasma NfL -4.1% -2.4% Votoplam 5 mg Votoplam 10 mg Plasma NfL reported to increase over time based on natural history* *Parkin et al., 2024 5 mg 10 mg NfL-plasma (pg/mL) Month 80 60 40 20 BL 12 24 80 60 40 20 BL 12 24 |
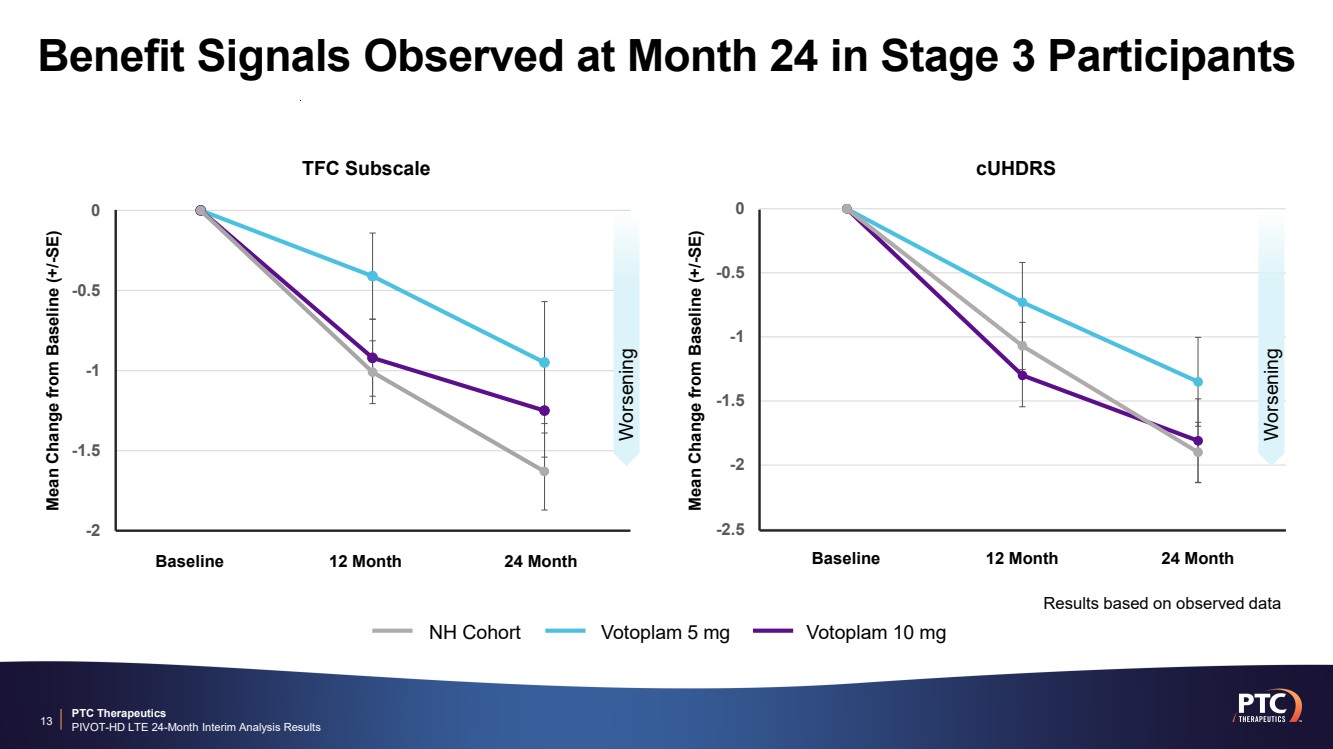
| PTC Therapeutics PIVOT-HD LTE 24-Month Interim Analysis Results Benefit Signals Observed at Month 24 in Stage 3 Participants 13 -2.5 -2 -1.5 -1 -0.5 0 Baseline 12 Month 24 Month cUHDRS Worsening -2 -1.5 -1 -0.5 0 Mean Change from Baseline (+/-SE) Baseline 12 Month 24 Month Mean Change from Baseline (+/-SE) TFC Subscale Worsening NH Cohort Votoplam 5 mg Votoplam 10 mg Results based on observed data |
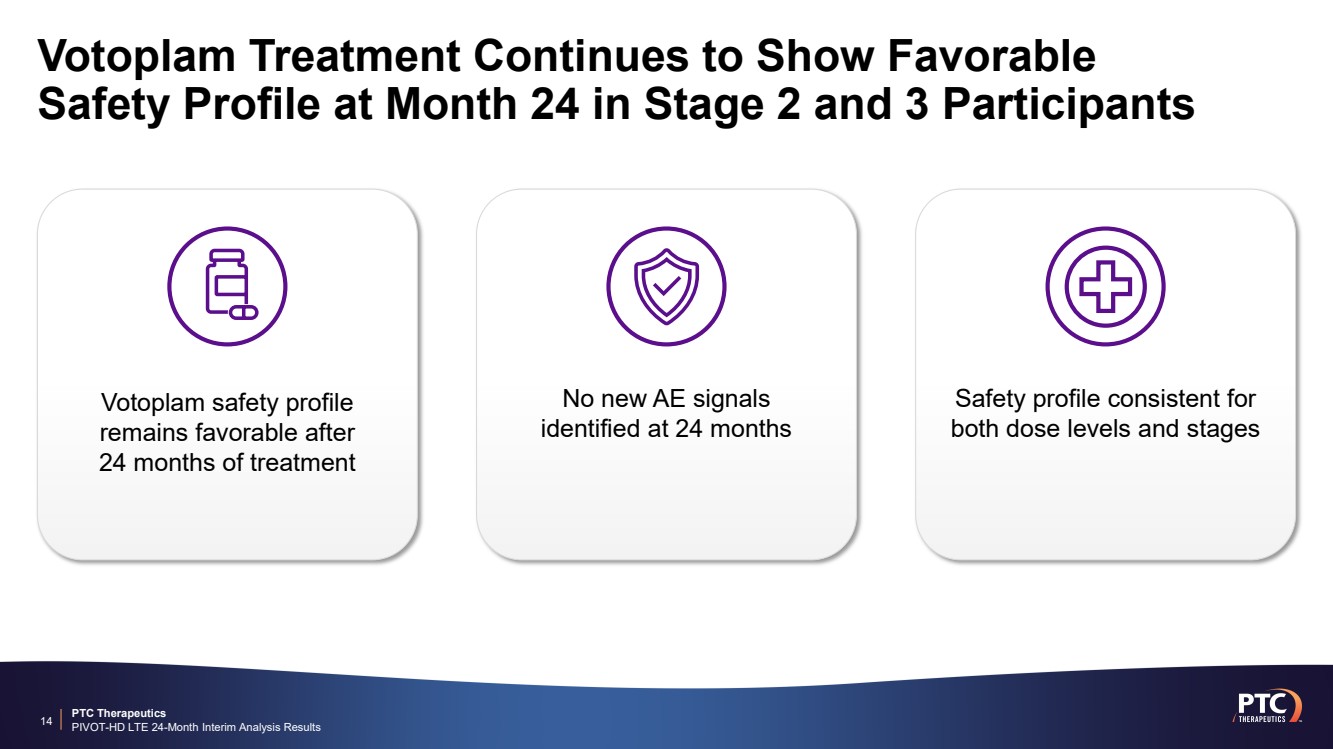
| PTC Therapeutics PIVOT-HD LTE 24-Month Interim Analysis Results Safety profile consistent for both dose levels and stages No new AE signals identified at 24 months Votoplam safety profile remains favorable after 24 months of treatment Votoplam Treatment Continues to Show Favorable Safety Profile at Month 24 in Stage 2 and 3 Participants 14 |
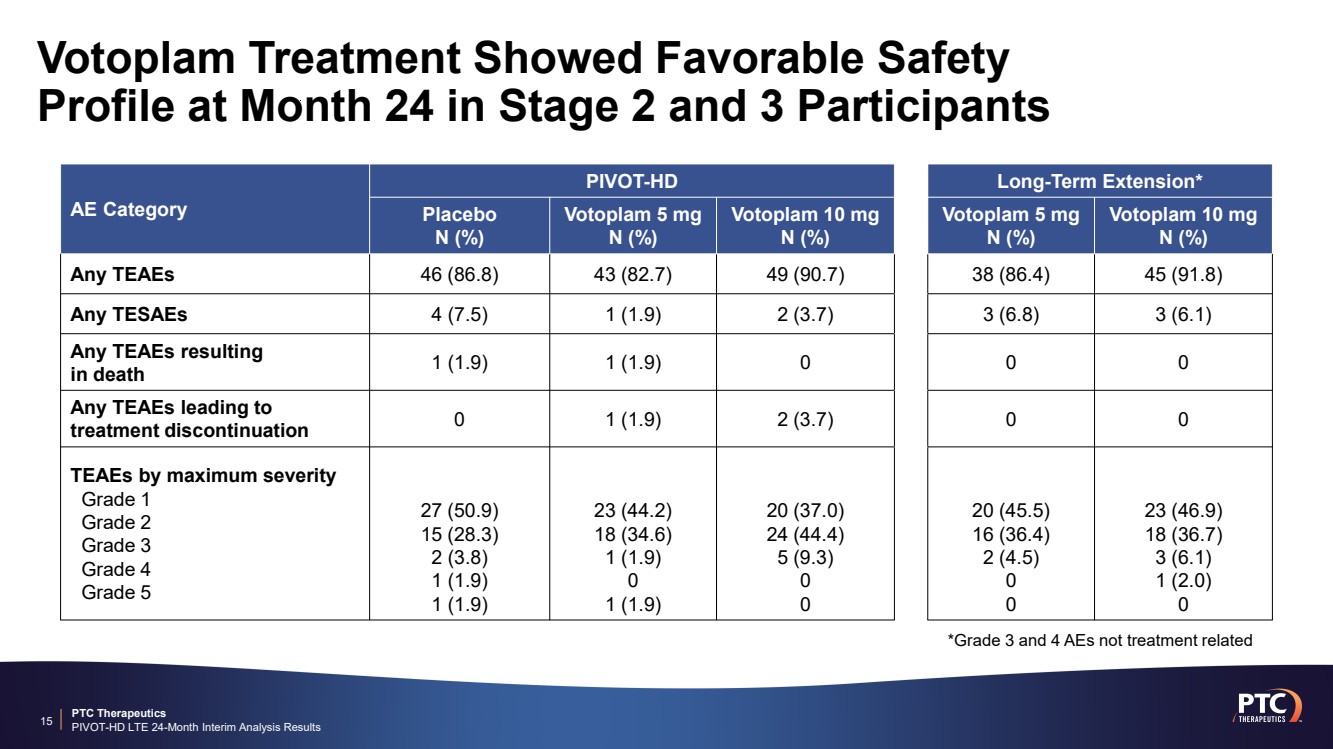
| PTC Therapeutics PIVOT-HD LTE 24-Month Interim Analysis Results 15 AE Category PIVOT-HD Long-Term Extension* Placebo N (%) Votoplam 5 mg N (%) Votoplam 10 mg N (%) Votoplam 5 mg N (%) Votoplam 10 mg N (%) Any TEAEs 46 (86.8) 43 (82.7) 49 (90.7) 38 (86.4) 45 (91.8) Any TESAEs 4 (7.5) 1 (1.9) 2 (3.7) 3 (6.8) 3 (6.1) Any TEAEs resulting in death 1 (1.9) 1 (1.9) 0 0 0 Any TEAEs leading to treatment discontinuation 0 1 (1.9) 2 (3.7) 0 0 TEAEs by maximum severity Grade 1 Grade 2 Grade 3 Grade 4 Grade 5 27 (50.9) 15 (28.3) 2 (3.8) 1 (1.9) 1 (1.9) 23 (44.2) 18 (34.6) 1 (1.9) 0 1 (1.9) 20 (37.0) 24 (44.4) 5 (9.3) 0 0 20 (45.5) 16 (36.4) 2 (4.5) 0 0 23 (46.9) 18 (36.7) 3 (6.1) 1 (2.0) 0 Votoplam Treatment Showed Favorable Safety Profile at Month 24 in Stage 2 and 3 Participants *Grade 3 and 4 AEs not treatment related |
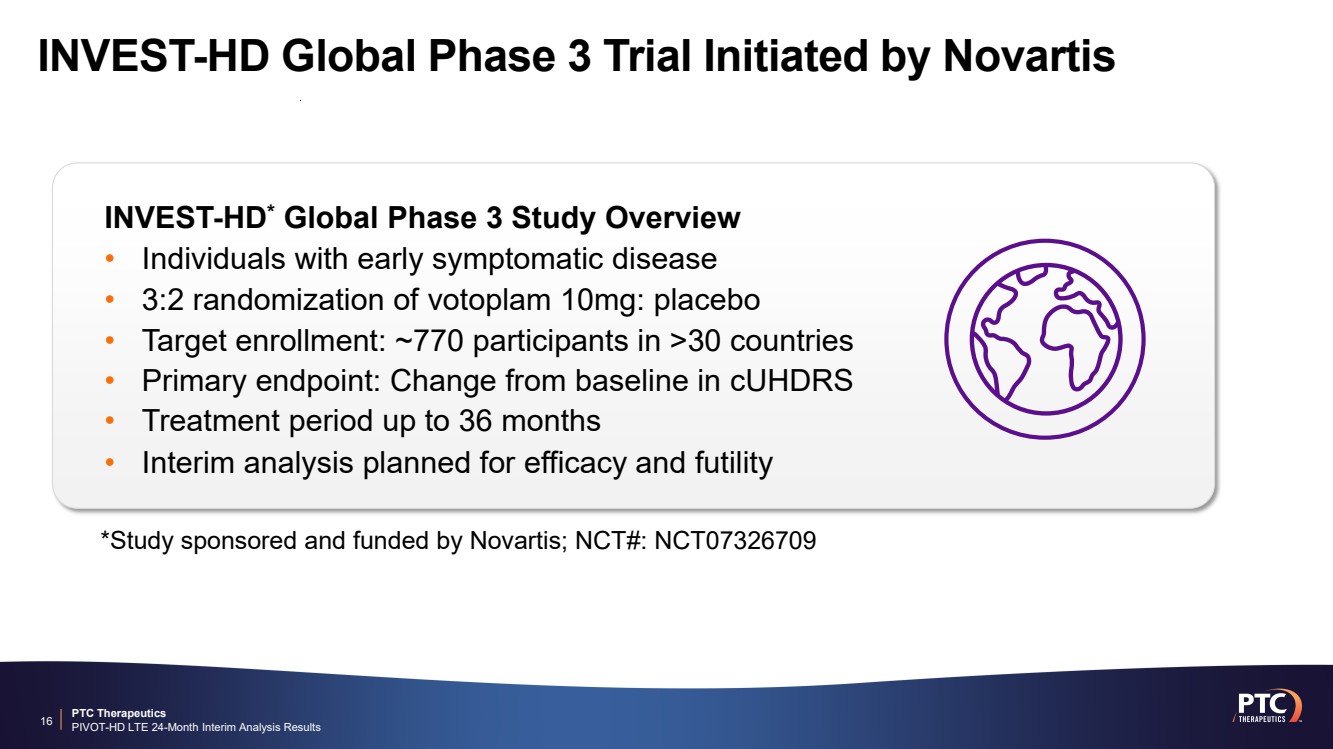
| PTC Therapeutics PIVOT-HD LTE 24-Month Interim Analysis Results INVEST-HD Global Phase 3 Trial Initiated by Novartis 16 INVEST-HD* Global Phase 3 Study Overview • Individuals with early symptomatic disease • 3:2 randomization of votoplam 10mg: placebo • Target enrollment: ~770 participants in >30 countries • Primary endpoint: Change from baseline in cUHDRS • Treatment period up to 36 months • Interim analysis planned for efficacy and futility *Study sponsored and funded by Novartis; NCT#: NCT07326709 |
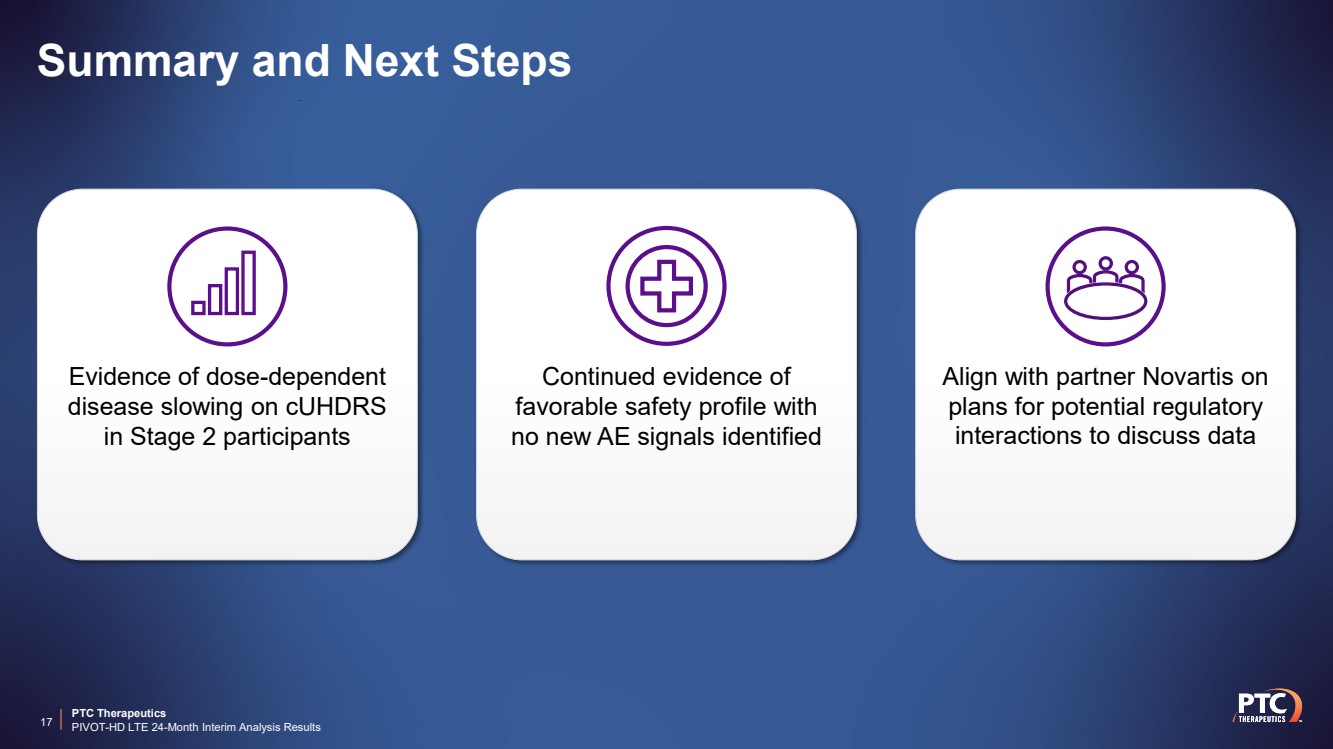
| PTC Therapeutics PIVOT-HD LTE 24-Month Interim Analysis Results 17 Align with partner Novartis on plans for potential regulatory interactions to discuss data Continued evidence of favorable safety profile with no new AE signals identified Evidence of dose-dependent disease slowing on cUHDRS in Stage 2 participants Summary and Next Steps |
|