Year | Summary Compensation Table Total for Principal Executive Officer (“PEO”)(1) | Compensation Actually Paid to PEO(2) | Average Summary Compensation Table Total for Non-PEO Named Executive Officers (“NEOs”)(3) | Average Compensation Actually Paid to Non-PEO NEOs(3) | Value of Initial Fixed $100 Investment Based on Total Shareholder Return (“TSR”)(4) | Net Income (Loss) (millions)(5) | ||||||||||||
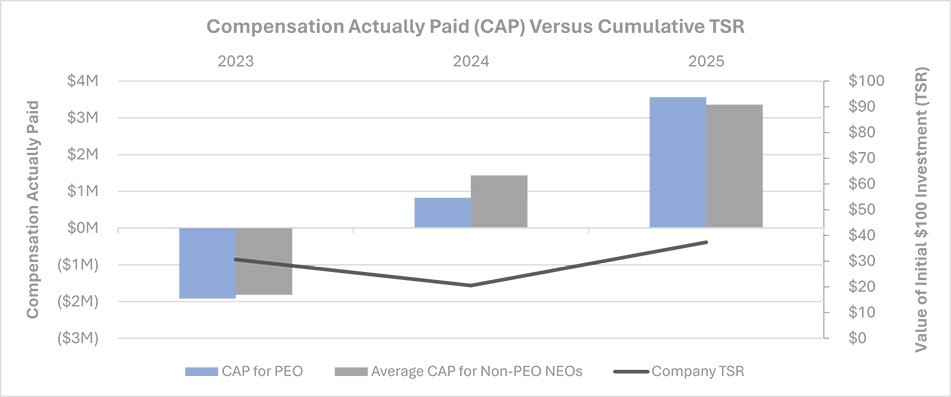
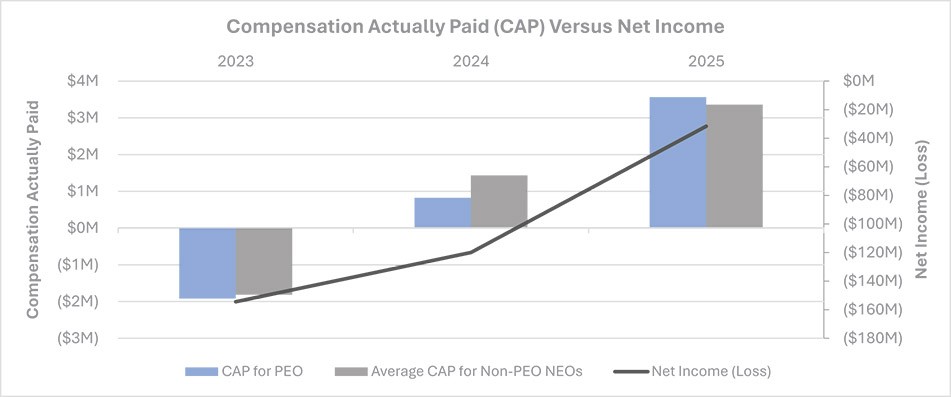
2025 | $ | 2,887,256 | $ | 3,555,640 | $ | 1,552,918 | $ | 3,285,920 | $ | 37 | $ | (33) | ||||||
2024 | 1,380,197 | 807,503 | 1,897,806 | (6) | 1,432,093 | (6) | 21 | (121) | ||||||||||
2023 | 1,122,585 | (1,904,079) | 1,221,446 | (1,829,434) | 31 | (154) | ||||||||||||
| (1) | Dr. Rosenwald was the Registrant’s PEO for each of the 2025, 2024 and 2023 fiscal years. |
| (2) | The amounts disclosed reflect the adjustments listed in the tables below to the amounts reported in the Summary Compensation Table for PEO: |
Year | Less: Grant Date Value of Equity Awards | Year-End Fair Value of Unvested Awards Granted During 2025 | Vesting Date Value of Awards that were Granted and Vested in 2025 | Year-Over-Year Change in Fair Value of Unvested Awards Granted in Prior Years | Change in Value of Awards Vesting During 2025 that were Granted in Prior Years | Total Adjustments | ||||||||||||
2025 | $ | (2,199,592) | $ | 2,179,900 | $ | 50,000 | $ | (52,449) | $ | 690,523 | $ | 668,382 | ||||||
| (3) | For the 2025, 2024 and 2023 fiscal years, our Non-PEO NEOs were: David Jin and Michael S. Weiss. The amounts disclosed reflect the adjustments listed in the table below to the amounts reported in the Summary Compensation Table for Non-PEO NEOs: |
Year | Less: Grant Date Value of Equity Awards | Year-End Fair Value of Unvested Awards Granted During 2025 | Vesting Date Value of Awards that were Granted and Vested in 2025 | Year-Over-Year Change in Fair Value of Unvested Awards Granted in Prior Years | Change in Value of Awards Vesting During 2025 that were Granted in Prior Years | Total Adjustments | ||||||||||||
2025 | $ | (894,548) | $ | 873,540 | $ | 28,992 | $ | 931,923 | $ | 793,094 | $ | 1,733,002 | ||||||
| (4) | Represents the cumulative TSR for a $100 investment in Fortress’ common stock, assuming such investment occurred on December 31, 2022 and all dividends were reinvested. |
| (5) | The dollar amounts reported represent the amount of net income (loss) reflected in our consolidated audited financial statements for the applicable year. |
| (6) | Includes adjustment to the bonus amount awarded to, and cash fees earned by, Mr. Jin for 2024 as reflected in the Summary Compensation Table for 2024, as described in footnotes 4 and 5 to the Summary Compensation Table. No additional reconciliation for fiscal year 2024 is provided because the corrections are tied to cash-based compensation. |
| (2) | The amounts disclosed reflect the adjustments listed in the tables below to the amounts reported in the Summary Compensation Table for PEO: |
Year | Less: Grant Date Value of Equity Awards | Year-End Fair Value of Unvested Awards Granted During 2025 | Vesting Date Value of Awards that were Granted and Vested in 2025 | Year-Over-Year Change in Fair Value of Unvested Awards Granted in Prior Years | Change in Value of Awards Vesting During 2025 that were Granted in Prior Years | Total Adjustments | ||||||||||||
2025 | $ | (2,199,592) | $ | 2,179,900 | $ | 50,000 | $ | (52,449) | $ | 690,523 | $ | 668,382 | ||||||
| (2) | The amounts disclosed reflect the adjustments listed in the tables below to the amounts reported in the Summary Compensation Table for PEO: |
Year | Less: Grant Date Value of Equity Awards | Year-End Fair Value of Unvested Awards Granted During 2025 | Vesting Date Value of Awards that were Granted and Vested in 2025 | Year-Over-Year Change in Fair Value of Unvested Awards Granted in Prior Years | Change in Value of Awards Vesting During 2025 that were Granted in Prior Years | Total Adjustments | ||||||||||||
2025 | $ | (2,199,592) | $ | 2,179,900 | $ | 50,000 | $ | (52,449) | $ | 690,523 | $ | 668,382 | ||||||
| (3) | For the 2025, 2024 and 2023 fiscal years, our Non-PEO NEOs were: David Jin and Michael S. Weiss. The amounts disclosed reflect the adjustments listed in the table below to the amounts reported in the Summary Compensation Table for Non-PEO NEOs: |
Year | Less: Grant Date Value of Equity Awards | Year-End Fair Value of Unvested Awards Granted During 2025 | Vesting Date Value of Awards that were Granted and Vested in 2025 | Year-Over-Year Change in Fair Value of Unvested Awards Granted in Prior Years | Change in Value of Awards Vesting During 2025 that were Granted in Prior Years | Total Adjustments | ||||||||||||
2025 | $ | (894,548) | $ | 873,540 | $ | 28,992 | $ | 931,923 | $ | 793,094 | $ | 1,733,002 | ||||||