PAY VERSUS PERFORMANCE
Pay Versus Performance Table
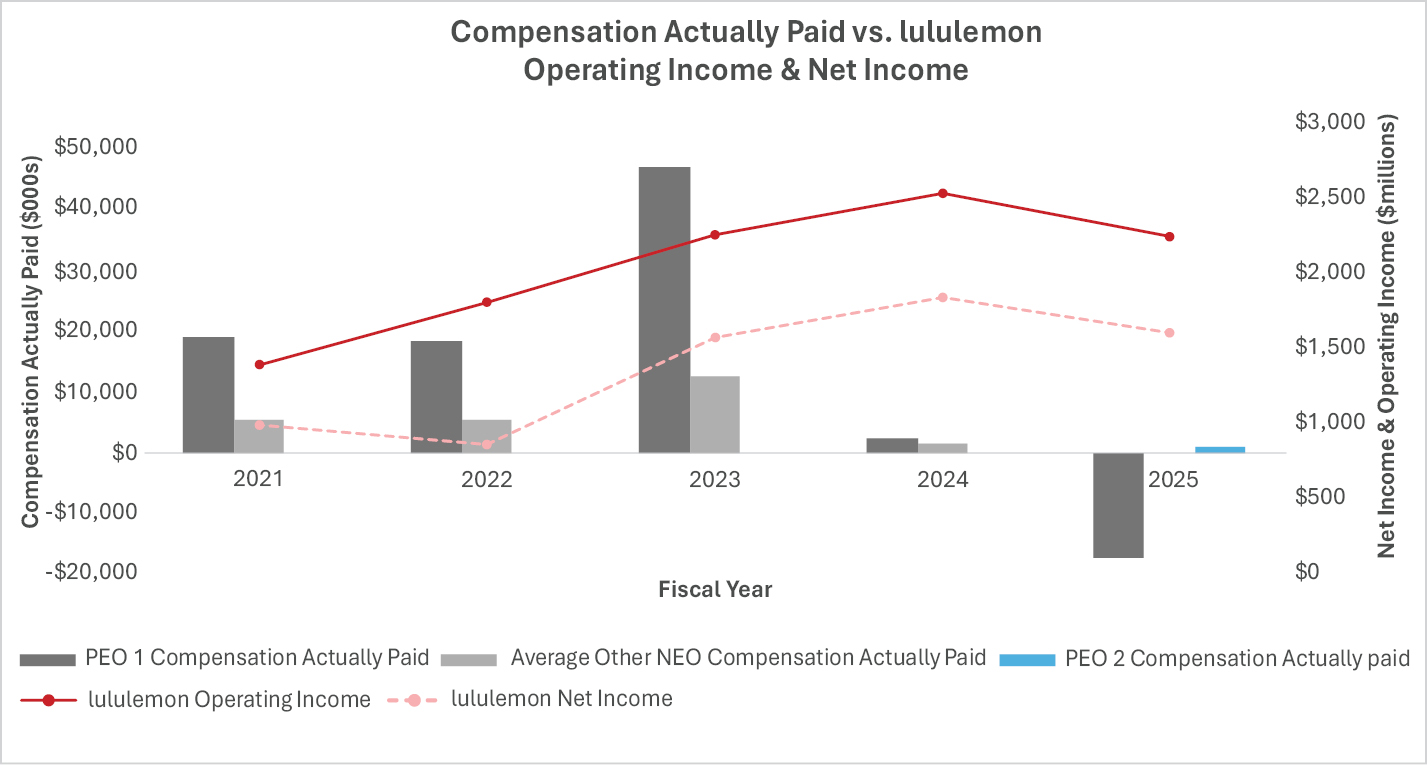
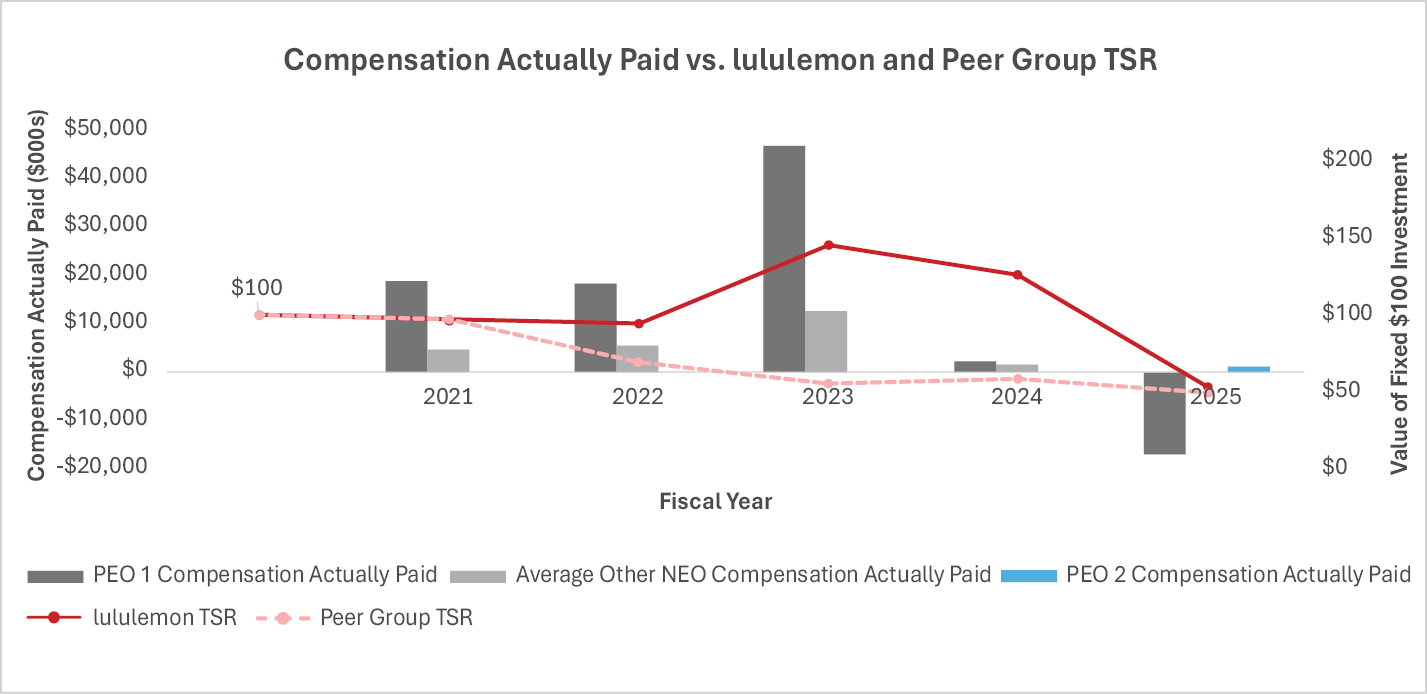
The following table shows information detailing (1) the total compensation of our principal executive officer (PEO) as reported in the Summary Compensation Table (SCT), (2) the average total compensation for the remaining named executive officers (NEOs) collectively (other than the PEO) as reported in the Summary Compensation Table, (3) the executive compensation actually paid to the PEO and (4) the average executive compensation actually paid to the non-PEO NEOs collectively, in each case for the covered fiscal year. The table also shows for each covered fiscal year our cumulative total stockholder return (TSR) and our peer group’s cumulative total stockholder return, our net income, and our operating income.
The amounts originally in Canadian dollars were converted to U.S. dollars for this table using the average of the average exchange rates for each fiscal month during the applicable fiscal year. Applying this formula to fiscal 2025, fiscal 2024, fiscal 2023, fiscal 2022, and fiscal 2021, CDN$1.00 was equal to USD$0.719, USD$0.726, USD$0.741, USD$0.765, and USD$0.799, respectively.
The amounts originally in British pounds were converted to U.S. dollars for this table using the average of the average exchange rates for each fiscal month during the applicable fiscal year. Applying this formula to fiscal 2025, fiscal 2024, fiscal 2023, fiscal 2022, and fiscal 2021, GBP£1.00 was equal to USD$1.329, USD$1.275, USD$1.248, USD$1.226, and USD$1.375, respectively.
| SCT Total for PEOs ($)(1) | Compensation Actually | Average SCT | Average | Value of Initial Fixed $100 | ||||||
| Fiscal | PEO 1 | PEO 2 | PEO 1 | PEO 2 | TSR | Peer Group | Net Income | Operating Income | ||
| 2025 | 24,023,294 | 9,667,535 | (17,063,434) | 1,192,849 | 6,380,412 | 4,747 | 53.09 | 49.47 | 1,579,183,000 | 2,210,615,000 |
| 2024 | 14,570,399 |
| 2,233,660 |
| 4,572,382 | 1,594,893 | 126.02 | 58.60 | 1,814,616,000 | 2,505,697,000 |
| 2023 | 16,547,888 |
| 46,879,603 |
| 5,403,574 | 12,603,182 | 145.44 | 55.22 | 1,550,190,000 | 2,230,886,000 |
| 2022 | 15,663,837 |
| 18,293,236 |
| 4,798,051 | 5,432,002 | 94.58 | 68.26 | 854,800,000 | 1,789,069,000 |
| 2021 | 13,265,455 |
| 18,826,215 |
| 3,801,514 | 4,642,721 | 96.11 | 96.85 | 975,322,000 | 1,374,749,000 |
(1) The following table reconciles the PEO Summary Compensation Table total to compensation actually paid:
| Fiscal | PEO | SCT Total ($) | Deductions from | Addition of Fair Value of | Addition (Deduction) for | Addition (Deduction) for | Compensation |
| 2025 | PEO 1 | 24,023,294 | (21,600,031) | 2,627,426 | (19,698,179) | (2,415,944) | (17,063,434) |
| PEO 2 | 9,667,535 | (8,498,893) | 4,790,244 | (4,207,414) | (558,623) | 1,192,849 |
(a) The PEO for 2025 were Calvin McDonald as PEO 1 and Meghan Frank as PEO 2.
(b) The deductions are the grant date fair value of equity-based awards (stock and option awards) granted each year.
(2) The following table reconciles the Non-PEO NEOs Average Summary Compensation Table total to average compensation actually paid:
| Fiscal | SCT Total ($) | Deductions from | Addition of Fair Value of | Addition (Deduction) for | Addition (Deduction) for | Compensation |
| 2025 | 6,380,412 | (5,374,551) | 2,349,475 | (2,633,438) | (717,151) | 4,747 |
(a) The Non-PEO NEOs for 2025 included André Maestrini, Nicole Neuburger, Edward Dagnese and Celeste Burgoyne.
(b) The deductions are the grant date fair value of equity-based awards (stock and option awards) granted each year.
(3) In accordance with Regulation S-K, compensation actually paid reflects adjustments to equity award values from those reported in the Summary Compensation Table. Equity award values were recalculated as of the end of each applicable fiscal year or vesting date, as required by SEC rules, using updated valuation assumptions and stock prices, as follows: (1) the fair value of RSU awards was based on the closing price of our common stock as of the last day of the applicable fiscal year or the vesting date as applicable; (2) the fair value of PSU awards was based on the closing price of our common stock as of the last day of the applicable fiscal year and adjusted to reflect management’s estimate of the probable level of performance as of that date; and (3) the fair value of stock options was estimated using the Black-Scholes option-pricing model and using updated valuation assumptions, including expected volatility, risk-free interest rate, dividend yield, and expected term.
(4) In accordance with the pay versus performance rules, our total stockholder return (TSR) and our peer group TSR is determined based on the value of an initial fixed investment through the end of the listed fiscal year. The peer group TSR used in this table was determined using the S&P 500 Apparel, Accessories & Luxury Goods Index. The peer group index used for purposes of this disclosure is the same index used for the stock performance graph included in our Annual Report on Form 10-K, as permitted under applicable SEC rules.
(5) For purposes of evaluating the achievement of the performance measure in our incentive programs, operating income generally means earnings before other income and taxes as reported in our financial statements or, if reported, adjusted operating income as reported in our earnings release or other EDGAR filings as applicable.
(6) Refer to the non-GAAP reconciliation table in Appendix A of this proxy statement for reconciliations between the above adjusted non-GAAP financial measures and the most directly comparable measures calculated in accordance with GAAP.
| Fiscal | PEO | SCT Total ($) | Deductions from | Addition of Fair Value of | Addition (Deduction) for | Addition (Deduction) for | Compensation |
| 2025 | PEO 1 | 24,023,294 | (21,600,031) | 2,627,426 | (19,698,179) | (2,415,944) | (17,063,434) |
| PEO 2 | 9,667,535 | (8,498,893) | 4,790,244 | (4,207,414) | (558,623) | 1,192,849 |
(a) The PEO for 2025 were Calvin McDonald as PEO 1 and Meghan Frank as PEO 2.
(b) The deductions are the grant date fair value of equity-based awards (stock and option awards) granted each year.
| Fiscal | SCT Total ($) | Deductions from | Addition of Fair Value of | Addition (Deduction) for | Addition (Deduction) for | Compensation |
| 2025 | 6,380,412 | (5,374,551) | 2,349,475 | (2,633,438) | (717,151) | 4,747 |
(a) The Non-PEO NEOs for 2025 included André Maestrini, Nicole Neuburger, Edward Dagnese and Celeste Burgoyne.
(b) The deductions are the grant date fair value of equity-based awards (stock and option awards) granted each year.
| [1] | The Non-PEO NEOs for 2025 included André Maestrini, Nicole Neuburger, Edward Dagnese and Celeste Burgoyne. | |||||||||||||||||||||||
| [2] | The following table reconciles the Non-PEO NEOs Average Summary Compensation Table total to average compensation actually paid:
(a) The Non-PEO NEOs for 2025 included André Maestrini, Nicole Neuburger, Edward Dagnese and Celeste Burgoyne. (b) The deductions are the grant date fair value of equity-based awards (stock and option awards) granted each year. |
|||||||||||||||||||||||
| [3] | In accordance with Regulation S-K, compensation actually paid reflects adjustments to equity award values from those reported in the Summary Compensation Table. Equity award values were recalculated as of the end of each applicable fiscal year or vesting date, as required by SEC rules, using updated valuation assumptions and stock prices, as follows: (1) the fair value of RSU awards was based on the closing price of our common stock as of the last day of the applicable fiscal year or the vesting date as applicable; (2) the fair value of PSU awards was based on the closing price of our common stock as of the last day of the applicable fiscal year and adjusted to reflect management’s estimate of the probable level of performance as of that date; and (3) the fair value of stock options was estimated using the Black-Scholes option-pricing model and using updated valuation assumptions, including expected volatility, risk-free interest rate, dividend yield, and expected term. | |||||||||||||||||||||||
| [4] | In accordance with the pay versus performance rules, our total stockholder return (TSR) and our peer group TSR is determined based on the value of an initial fixed investment through the end of the listed fiscal year. The peer group TSR used in this table was determined using the S&P 500 Apparel, Accessories & Luxury Goods Index. The peer group index used for purposes of this disclosure is the same index used for the stock performance graph included in our Annual Report on Form 10-K, as permitted under applicable SEC rules. | |||||||||||||||||||||||
| [5] | For purposes of evaluating the achievement of the performance measure in our incentive programs, operating income generally means earnings before other income and taxes as reported in our financial statements or, if reported, adjusted operating income as reported in our earnings release or other EDGAR filings as applicable. | |||||||||||||||||||||||
| [6] | Refer to the non-GAAP reconciliation table in Appendix A of this proxy statement for reconciliations between the above adjusted non-GAAP financial measures and the most directly comparable measures calculated in accordance with GAAP. | |||||||||||||||||||||||
| [7] | The PEO for 2025 were Calvin McDonald as PEO 1 and Meghan Frank as PEO 2. | |||||||||||||||||||||||
| [8] | The following table reconciles the PEO Summary Compensation Table total to compensation actually paid:
(a) The PEO for 2025 were Calvin McDonald as PEO 1 and Meghan Frank as PEO 2. (b) The deductions are the grant date fair value of equity-based awards (stock and option awards) granted each year. |
|||||||||||||||||||||||
| [9] | The deductions are the grant date fair value of equity-based awards (stock and option awards) granted each year. | |||||||||||||||||||||||
| [10] | The deductions are the grant date fair value of equity-based awards (stock and option awards) granted each year. |