Pay vs Performance Disclosure - USD ($)
Dec. 31, 2025
Dec. 31, 2024
Dec. 31, 2023
Pay Versus Performance Disclosure
As required by Item 402(v) of Regulation
S-K,
we are providing the following information regarding the relationship between the executive “compensation actually paid” to our principal executive officer (PEO) and our other named executive officers (NEO) and our financial performance for each of the last three completed fiscal years. In determining the “compensation actually paid” (CAP) to our NEOs, we are required to make various adjustments to amounts that have in prior years been reported in the Summary Compensation Table (SCT), as the SEC valuation methods for this disclosure differ from those required in the SCT. The values do not necessarily represent the actual compensation received by the NEOs nor how the Compensation Committee evaluates and determines executive compensation levels. For our NEOs other than our PEO, compensation is reported as an average. Year |
SCT Total for PEO(1) |
CAP to PEO(1)(2)(3) |
Average SCT Total for Non-PEO named executive officers(4) |
Average CAP to Non-PEO named executive officers(2)(3)(4) |
Value of initial fixed $100 investment based on Total Shareholder Return (TSR)(5) |
Net Income (in $000s)(6) |
||||||||||||||||||
2025 |
$ | 4,704,379 | $ | 4,290,265 | $ | 848,168 | $ | 801,510 | $ | 74.43 | ($ | 33,847 | ) | |||||||||||
2024 |
$ | 3,931,645 | $ | 6,050,349 | $ | 1,005,859 | $ | 949,776 | $ | 71.70 | ($ | 55,851 | ) | |||||||||||
2023 |
$ | 3,684,651 | ($ | 1,220,740 | ) | $ | 1,283,588 | $ | 75,336 | $ | 50.43 | ($ | 37,543 | ) | ||||||||||
| (1) | The PEO for all three years included in the table is Todd C. Brady, M.D., Ph.D., our Chief Executive Officer. The dollar amounts reported in this column are the amounts of total compensation reported for Dr. Brady in the “Total” column of the SCT in the applicable fiscal year. |
| (2) | In accordance with SEC rules, deductions from and additions to, total compensation reported in the SCT by year to calculate Compensation Actually Paid include: |
PEO |
Average Non-PEO NEOs |
|||||||||||||||||||||||
2025 |
2024 |
2023 |
2025 |
2024 |
2023 |
|||||||||||||||||||
SCT Total |
$ |
4,704,379 |
$ |
3,931,645 |
$ |
3,684,651 |
$ |
848,168 |
$ |
1,005,859 |
$ |
1,283,588 |
||||||||||||
Adjustments for Equity Awards |
||||||||||||||||||||||||
Deduct: Grant date values in SCT |
-$ | 3,801,379 | -$ | 3,000,817 | -$ | 2,850,548 | -$ | 475,171 | -$ | 608,498 | -$ | 816,863 | ||||||||||||
Add: Year-end fair value of unvested awards granted in the current year |
$ | 2,542,915 | $ | 3,050,702 | $ | 1,302,920 | $ | 317,864 | $ | 381,337 | $ | 307,105 | ||||||||||||
Add: Year-over-year difference of year-end fair values for unvested awards granted in prior years |
$ | 126,930 | $ | 1,137,053 | -$ | 3,936,684 | $ | 39,769 | $ | 139,692 | -$ | 969,744 | ||||||||||||
Add: Fair values at vest date for awards granted and vested in current year |
$ | 762,766 | $ | 809,973 | $ | 327,217 | $ | 95,346 | $ | 158,427 | $ | 216,150 | ||||||||||||
Add: Difference in fair values between prior year-end fair values and vest date fair values for awards granted in prior years |
-$ | 45,346 | -$ | 121,792 | $ | 251,703 | -$ | 24,466 | $ | 42,141 | $ | 55,100 | ||||||||||||
Deduct: Forfeitures during current year equal to prior year-end fair value |
$ | 0 | $ | 0 | $ | 0 | $ | 0 | -$ | 169,182 | $ | 0 | ||||||||||||
Total Adjustments for Equity Awards |
-$ |
414,114 |
$ |
2,118,704 |
-$ |
4,905,391 |
-$ |
46,658 |
-$ |
56,083 |
-$ |
1,208,252 |
||||||||||||
CAP |
$ |
4,290,265 |
$ |
6,050,349 |
-$ |
1,220,740 |
$ |
801,510 |
$ |
949,776 |
$ |
75,336 |
||||||||||||
| (3) | The following summarizes the valuation assumptions used for stock option awards included as part of CAP: |
| • | Expected life of each stock option is based on the “simplified method” using an average of the remaining vest and remaining term, as of the vest/fiscal year end (FYE) date. |
| • | Strike price is based on each grant date closing price and asset price is based on each vest/FYE closing price. |
| • | Risk free rate is based on the Treasury Constant Maturity rate closest to the remaining expected life as of the vest/FYE date. |
| • | Historical volatility is based on daily price history for each expected life (years) prior to each vest/FYE date. Closing prices provided by S&P Capital IQ are adjusted for dividends and splits. |
| • | Represents annual dividend yield on each vest/FYE date. |
| (4) | Non-PEO named executive officer averages reflect the following executives by year: |
| • | 2025: Stephen G. Machatha and Michael Alfieri |
| • | 2024: Bruce Greenberg, Stephen G. Machatha, and Michael Alfieri |
| • | 2023: Bruce Greenberg and Stephen G. Machatha |
The dollar amounts reported in this column represent the average of the amounts reported for the
non-PEO
named executive officers in the “Total” column of the SCT in the applicable fiscal year. | (5) | The dollar amounts reported represent the amount of net income (loss) reflected in our audited financial statements for the applicable year. |
| (4) | Non-PEO named executive officer averages reflect the following executives by year: |
| • | 2025: Stephen G. Machatha and Michael Alfieri |
| • | 2024: Bruce Greenberg, Stephen G. Machatha, and Michael Alfieri |
| • | 2023: Bruce Greenberg and Stephen G. Machatha |
The dollar amounts reported in this column represent the average of the amounts reported for the
non-PEO
named executive officers in the “Total” column of the SCT in the applicable fiscal year. | (2) | In accordance with SEC rules, deductions from and additions to, total compensation reported in the SCT by year to calculate Compensation Actually Paid include: |
PEO |
Average Non-PEO NEOs |
|||||||||||||||||||||||
2025 |
2024 |
2023 |
2025 |
2024 |
2023 |
|||||||||||||||||||
SCT Total |
$ |
4,704,379 |
$ |
3,931,645 |
$ |
3,684,651 |
$ |
848,168 |
$ |
1,005,859 |
$ |
1,283,588 |
||||||||||||
Adjustments for Equity Awards |
||||||||||||||||||||||||
Deduct: Grant date values in SCT |
-$ | 3,801,379 | -$ | 3,000,817 | -$ | 2,850,548 | -$ | 475,171 | -$ | 608,498 | -$ | 816,863 | ||||||||||||
Add: Year-end fair value of unvested awards granted in the current year |
$ | 2,542,915 | $ | 3,050,702 | $ | 1,302,920 | $ | 317,864 | $ | 381,337 | $ | 307,105 | ||||||||||||
Add: Year-over-year difference of year-end fair values for unvested awards granted in prior years |
$ | 126,930 | $ | 1,137,053 | -$ | 3,936,684 | $ | 39,769 | $ | 139,692 | -$ | 969,744 | ||||||||||||
Add: Fair values at vest date for awards granted and vested in current year |
$ | 762,766 | $ | 809,973 | $ | 327,217 | $ | 95,346 | $ | 158,427 | $ | 216,150 | ||||||||||||
Add: Difference in fair values between prior year-end fair values and vest date fair values for awards granted in prior years |
-$ | 45,346 | -$ | 121,792 | $ | 251,703 | -$ | 24,466 | $ | 42,141 | $ | 55,100 | ||||||||||||
Deduct: Forfeitures during current year equal to prior year-end fair value |
$ | 0 | $ | 0 | $ | 0 | $ | 0 | -$ | 169,182 | $ | 0 | ||||||||||||
Total Adjustments for Equity Awards |
-$ |
414,114 |
$ |
2,118,704 |
-$ |
4,905,391 |
-$ |
46,658 |
-$ |
56,083 |
-$ |
1,208,252 |
||||||||||||
CAP |
$ |
4,290,265 |
$ |
6,050,349 |
-$ |
1,220,740 |
$ |
801,510 |
$ |
949,776 |
$ |
75,336 |
||||||||||||
| (2) | In accordance with SEC rules, deductions from and additions to, total compensation reported in the SCT by year to calculate Compensation Actually Paid include: |
PEO |
Average Non-PEO NEOs |
|||||||||||||||||||||||
2025 |
2024 |
2023 |
2025 |
2024 |
2023 |
|||||||||||||||||||
SCT Total |
$ |
4,704,379 |
$ |
3,931,645 |
$ |
3,684,651 |
$ |
848,168 |
$ |
1,005,859 |
$ |
1,283,588 |
||||||||||||
Adjustments for Equity Awards |
||||||||||||||||||||||||
Deduct: Grant date values in SCT |
-$ | 3,801,379 | -$ | 3,000,817 | -$ | 2,850,548 | -$ | 475,171 | -$ | 608,498 | -$ | 816,863 | ||||||||||||
Add: Year-end fair value of unvested awards granted in the current year |
$ | 2,542,915 | $ | 3,050,702 | $ | 1,302,920 | $ | 317,864 | $ | 381,337 | $ | 307,105 | ||||||||||||
Add: Year-over-year difference of year-end fair values for unvested awards granted in prior years |
$ | 126,930 | $ | 1,137,053 | -$ | 3,936,684 | $ | 39,769 | $ | 139,692 | -$ | 969,744 | ||||||||||||
Add: Fair values at vest date for awards granted and vested in current year |
$ | 762,766 | $ | 809,973 | $ | 327,217 | $ | 95,346 | $ | 158,427 | $ | 216,150 | ||||||||||||
Add: Difference in fair values between prior year-end fair values and vest date fair values for awards granted in prior years |
-$ | 45,346 | -$ | 121,792 | $ | 251,703 | -$ | 24,466 | $ | 42,141 | $ | 55,100 | ||||||||||||
Deduct: Forfeitures during current year equal to prior year-end fair value |
$ | 0 | $ | 0 | $ | 0 | $ | 0 | -$ | 169,182 | $ | 0 | ||||||||||||
Total Adjustments for Equity Awards |
-$ |
414,114 |
$ |
2,118,704 |
-$ |
4,905,391 |
-$ |
46,658 |
-$ |
56,083 |
-$ |
1,208,252 |
||||||||||||
CAP |
$ |
4,290,265 |
$ |
6,050,349 |
-$ |
1,220,740 |
$ |
801,510 |
$ |
949,776 |
$ |
75,336 |
||||||||||||
Relationship Between Compensation Actually Paid and Total Shareholder Return
The following chart illustrates the relationship between CAP to our PEO and
Non-PEO
NEOs (averaged), and the TSR over the reporting period. For our NEOs, a significant portion of compensation consists of equity awards. On average, over 75% of our named executive officers’ target direct compensation is variable and contingent on the achievement of corporate goals and share price appreciation. As a result, as demonstrated in the chart below, the amount of CAP to our NEOs is aligned with our cumulative TSR over the three-year period presented below. 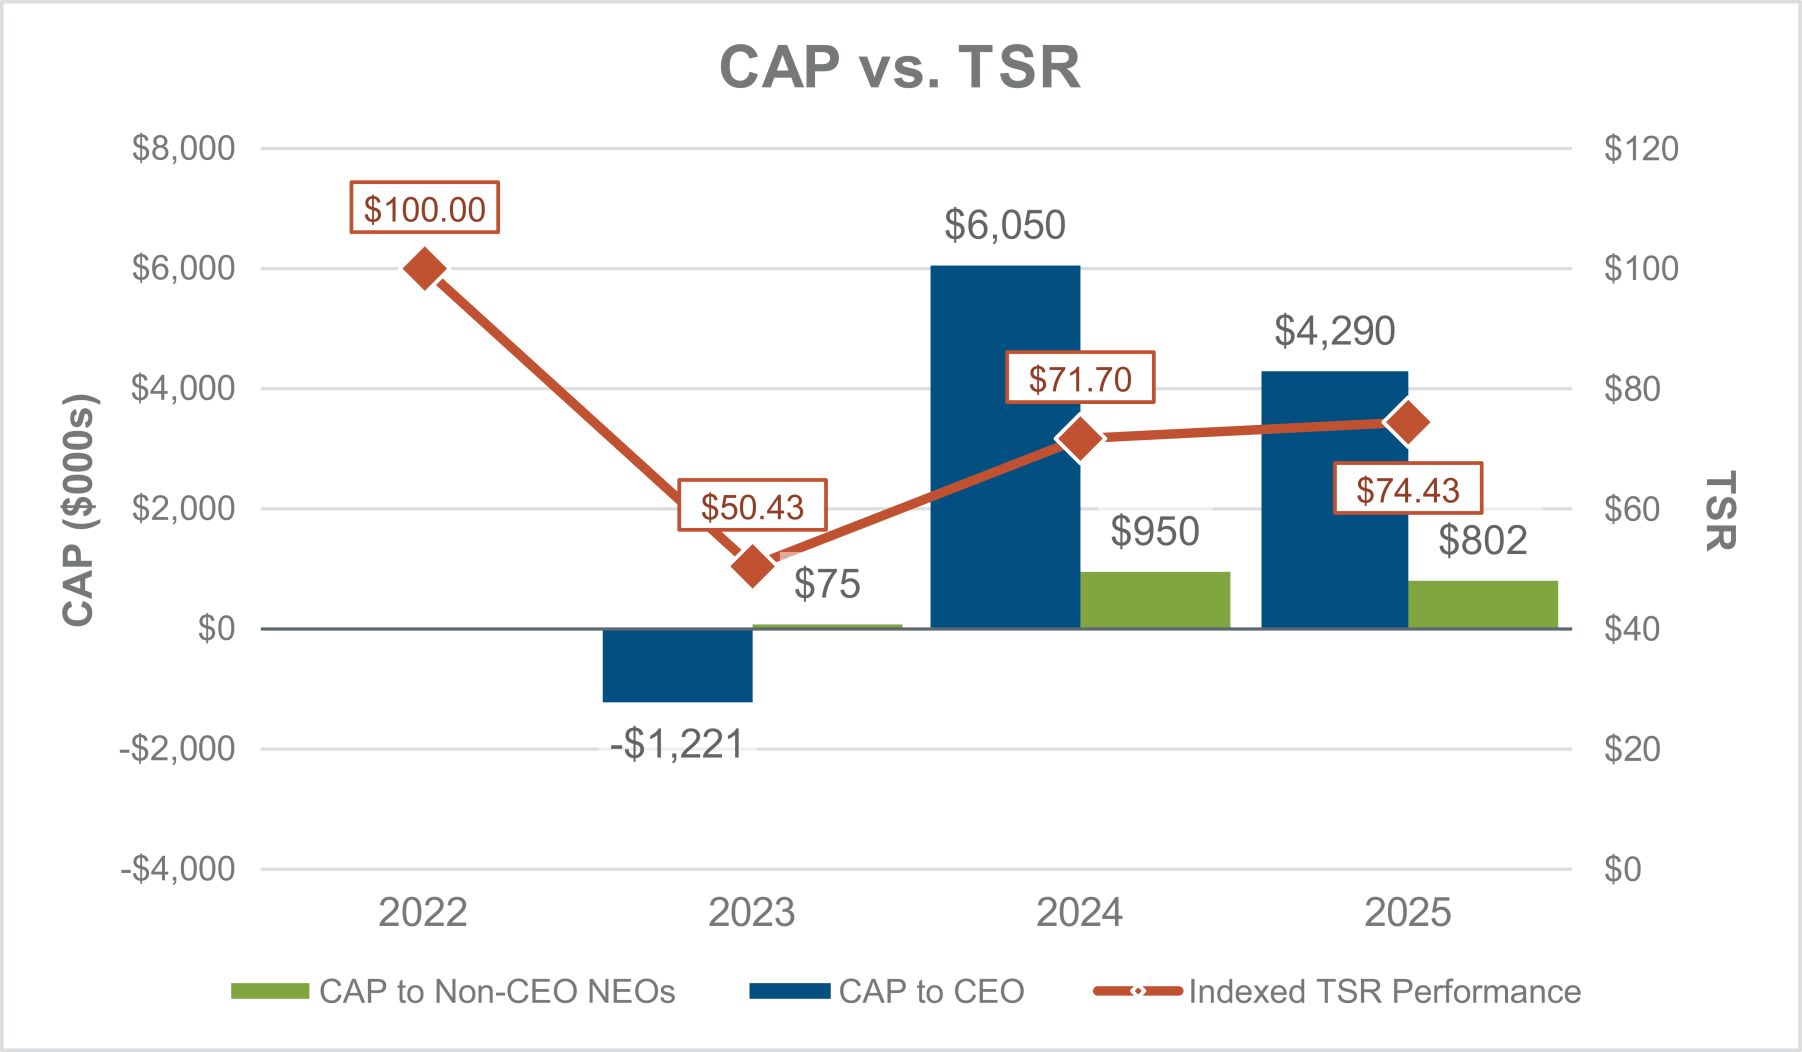
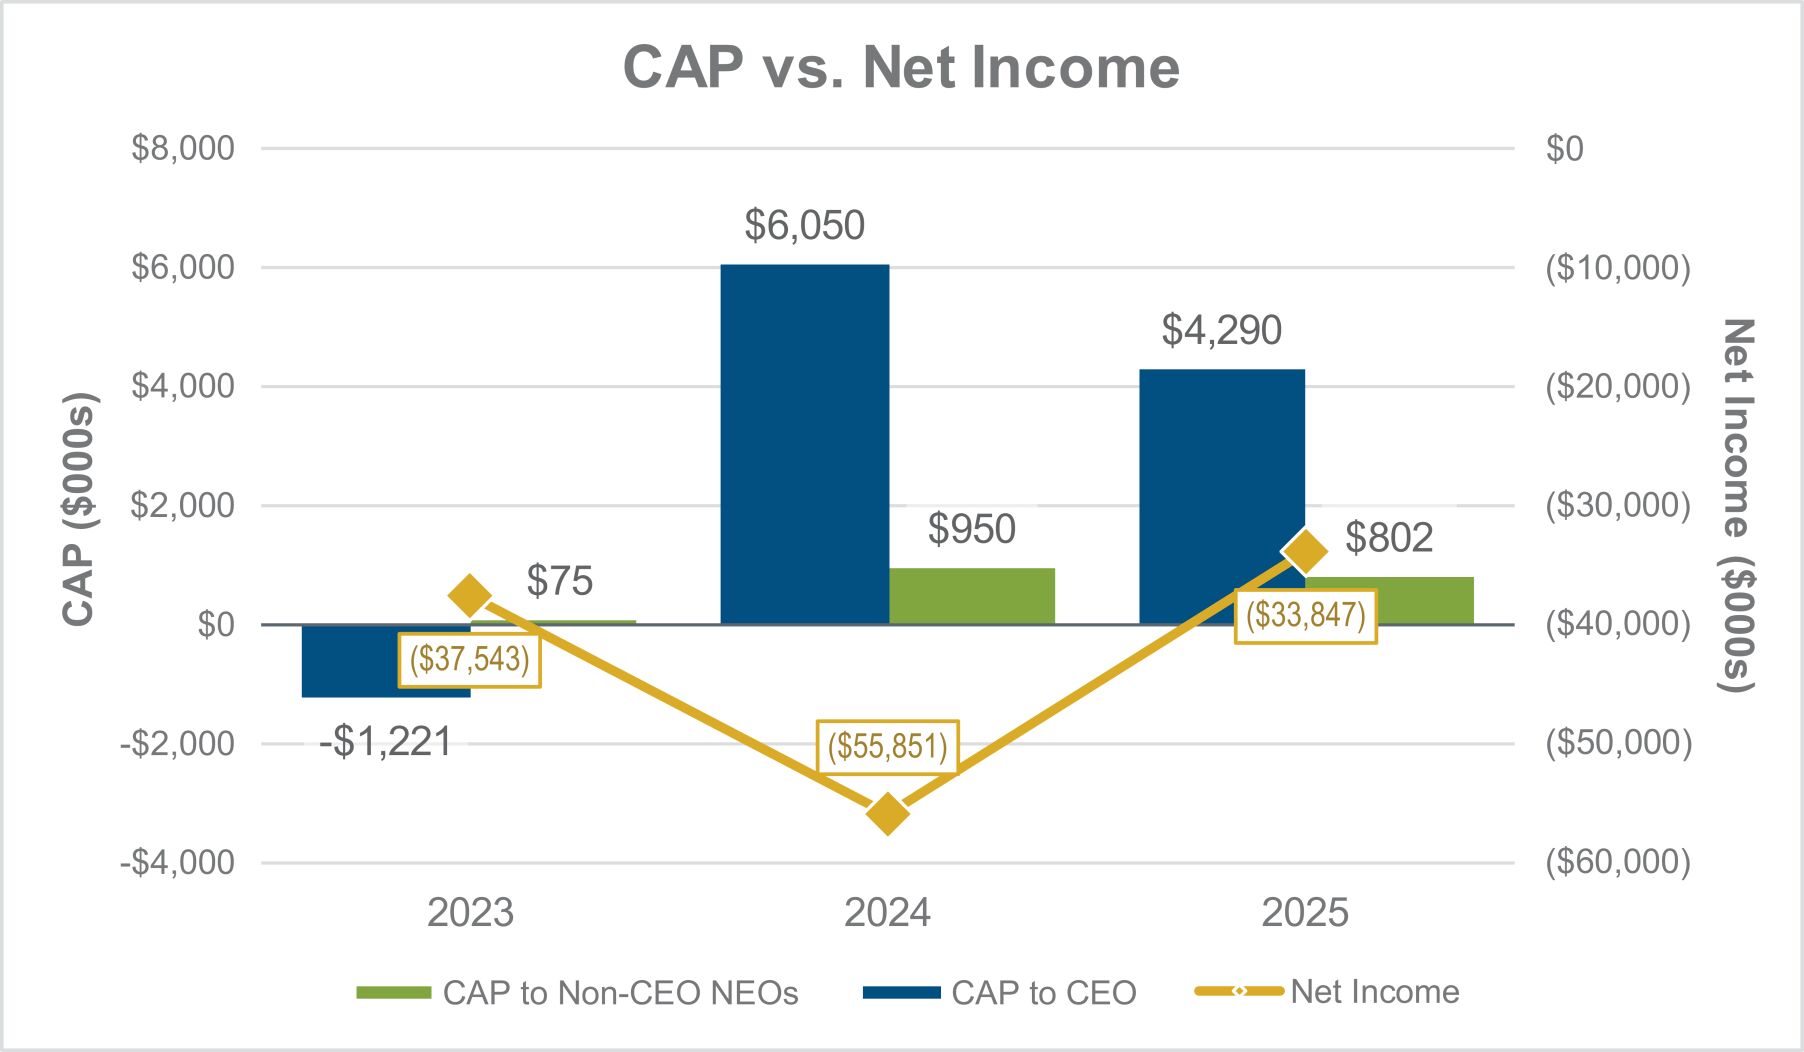
Relationship Between Compensation Actually Paid and Net Income
The following chart illustrates the relationship between CAP to our PEO and
Non-PEO
NEO (averaged), and the Net Income over the reporting period. The CAP to our PEO and Non-PEO
NEOs and Net Income is not correlated over the three years shown below. While we are required by SEC rules to disclose the relationship between our net income and compensation “actually paid” to our NEOs, this is not a metric our compensation committee currently uses in evaluating our NEOs compensation.