Pay vs Performance Disclosure - USD ($)
Dec. 31, 2025
Dec. 31, 2024
Dec. 31, 2023
Dec. 31, 2022
Dec. 31, 2021
Pay Versus Performance
The disclosure included in this section is prescribed by SEC rules and does not necessarily align with how we or our Compensation Committee view the link between our performance and our NEOs’ pay. Our Compensation Committee did not consider the pay versus performance disclosure below in making its pay decisions for any of the years shown. For further information concerning our philosophy and how we align executive compensation with our performance, refer to the Compensation Discussion and Analysis” section above. Additionally, for a discussion of how we view our executive compensation structure, including alignment with our corporate performance, see “Compensation Discussion and Analysis” above.
pay-for-performance
The use of the term compensation actually paid (“CAP”) is required by the SEC’s rules. Neither CAP nor the total amount reported in the “2025 Summary Compensation Table” reflects the amount of compensation actually paid, earned or received during the applicable year. Per SEC rules, CAP was calculated by adjusting the “2025 Summary Compensation Table” Total Compensation values for the applicable year as described in the footnotes to the following table.
Value of Initial Fixed $100 Investment Based on: |
||||||||||||||||||||||||||||
Year |
Summary Compensation Table Total for PEO (1) ($) |
Compensation Actually Paid to PEO (2)(4) ($) |
Average Summary Compensation Table Total for Non-PEO NEOs (3) ($) |
Average Compensation Actually Paid to Non-PEO NEOs (2)(4) ($) |
Total Shareholder Return (TSR) (5) ($) |
Peer Group TSR (6) ($) |
Net Income (Loss) ($ in millions) |
|||||||||||||||||||||
2025 |
$ | 14,672,390 | $ | 37,062,230 | $ | 4,522,747 | $ | 11,694,949 | $ | 201.19 | $ | 124.75 | $ | (1,131 | ) | |||||||||||||
2024 |
$ | 10,079,491 | $ | 20,330,356 | $ | 4,295,183 | $ | 7,779,598 | $ | 110.48 | $ | 116.78 | $ | (600 | ) | |||||||||||||
2023 |
$ | 10,411,247 | $ | 14,000,393 | $ | 3,766,587 | 4,821,442 | $ | 72.44 | $ | 114.10 | $ | (436 | ) | ||||||||||||||
2022 |
$ | 7,217,839 | $ | 8,638,970 | $ | 2,475,510 | 2,924,708 | $ | 60.17 | $ | 109.99 | $ | (249 | ) | ||||||||||||||
2021 |
$ | 7,828,917 | $ | (3,466,481 | ) | $ | 2,367,508 | (276,306 | ) | $ | 63.58 | $ | 124.53 | $ | (187 | ) | ||||||||||||
| (1) | Represents total compensation reported for our principal executive officer (“PEO”), Dr. Goldsmith, as reflected in the “2025 Summary Compensation Table” above. |
| (2) | CAP has been calculated based on the requirements and methodology set forth in the applicable SEC rules (Item 402(v) of Regulation S-K). The CAP calculation includes the end-of-year |
| will actually vest. To calculate CAP for 2025, the following amounts were deducted from and added to the total compensation number shown in the 2025 Summary Compensation Table: |
2025 (For PEO) ($) |
2025 (Average for Non PEO NEOs) |
|||||||
2025 Summary Compensation Table (“SCT”) Total Compensation |
$ | 14,672,390 | $ | 4,522,747 | ||||
Deduct for amounts reported under the “Stock Awards” and “Option Awards” columns in the SCT |
(12,963,190 | ) | (3,578,726 | ) | ||||
Fair value as of year-end of equity awards granted during the year that remain unvested |
20,200,922 | 5,576,891 | ||||||
Change in fair value of prior years’ equity awards that remain unvested as of year-end |
11,836,648 | 4,234,108 | ||||||
Fair value on vesting date for awards granted and vested in the same year |
2,843,064 | 784,874 | ||||||
Change in fair value from prior year-end to vesting date of prior years’ awards that vested during year |
472,397 | 155,056 | ||||||
Compensation Actually Paid (CAP) |
$ | 37,062,230 | $ | 11,694,949 | ||||
| (3) | Represents the average total compensation reported for our non-PEO NEOs in the “2025 Summary Compensation Table”. The non-PEO NEOs included in the average for each year are as follows: |
2025 |
2024 |
2023 |
2022 |
2021 | ||||
| Jack Anders | Jack Anders | Jack Anders | Jack Anders | Jack Anders | ||||
| Stephen M. Kelsey, M.D., FRCP, FRCPath | Stephen M. Kelsey, M.D., FRCP, FRCPath | Stephen M. Kelsey, M.D., FRCP, FRCPath | Stephen M. Kelsey, M.D., FRCP, FRCPath | Stephen M. Kelsey, M.D., FRCP, FRCPath | ||||
| Margaret Horn, J.D. | Margaret Horn, J.D. | Margaret Horn, J.D. | Margaret Horn, J.D. | Margaret Horn, J.D. | ||||
| Jeffrey Cislini | Xiaolin Wang, Sc.D. | Xiaolin Wang, Sc.D. | Xiaolin Wang, Sc.D. | Xiaolin Wang, Sc.D. |
| (4) | The fair values of unvested and outstanding equity awards to our NEOs were remeasured as of the end of each fiscal year, and as of each vesting date, during the 2021, 2022, 2023, 2024, and 2025 fiscal years. Fair values as of each measurement date were determined using valuation assumptions and methodologies (including volatility, dividend yield, and risk-free interest rates) that are generally consistent with those used to estimate fair value at grant in accordance with ASC Topic 718. For stock options, the grant date fair values were estimated using the Black-Scholes model. The assumptions used in calculating the fair value of the equity awards did not differ in any respect from the assumptions used to calculate the grant date fair value of the awards as reported in the Summary Compensation Table, other than the expected term that has been adjusted to reflect the passage of time. |
| (5) | Total Shareholder Return (“TSR”) represents the cumulative growth of a hypothetical $100 investment in our common stock made on December 31, 2020, as of the end of each respective year. |
| (6) | Peer group TSR represents the cumulative growth of a hypothetical $100 investment made on December 31, 2020 in the Nasdaq Biotechnology Index, which we also use for purposes of the stock performance graph included in our Annual Report on Form 10-K for the year ended December 31, 2025, as of the end of each respective year. |
SEC rules require us to designate a “company-selected measure” that in our assessment represents the most important financial performance measure (that is not TSR or net income) used by us to link CAP for the most recently completed fiscal year, to our performance. We did not use any financial performance measures to link CAP to our Company performance in the most recently completed fiscal year; accordingly, this disclosure does not present a Company-selected measure in the table above. See the “Compensation Discussion and Analysis” section included elsewhere in this Proxy Statement and in our historical proxy statements for additional detail on executive compensation actions.
Tabular List of Financial Performance Measures
Given the current lifecycle stage of our Company, financial measures do not feature meaningfully in our incentive plan design, which instead focuses on clinical and regulatory advancement, business development, financial results and people objectives, as described in the “Compensation Discussion and Analysis” section above. For the fiscal year ended December 31, 2025, there were no financial performance measures used to link CAP paid to our NEOs to Company performance and, therefore, no Company-selected measure is reported in the table above.
| (3) | Represents the average total compensation reported for our non-PEO NEOs in the “2025 Summary Compensation Table”. The non-PEO NEOs included in the average for each year are as follows: |
2025 |
2024 |
2023 |
2022 |
2021 | ||||
| Jack Anders | Jack Anders | Jack Anders | Jack Anders | Jack Anders | ||||
| Stephen M. Kelsey, M.D., FRCP, FRCPath | Stephen M. Kelsey, M.D., FRCP, FRCPath | Stephen M. Kelsey, M.D., FRCP, FRCPath | Stephen M. Kelsey, M.D., FRCP, FRCPath | Stephen M. Kelsey, M.D., FRCP, FRCPath | ||||
| Margaret Horn, J.D. | Margaret Horn, J.D. | Margaret Horn, J.D. | Margaret Horn, J.D. | Margaret Horn, J.D. | ||||
| Jeffrey Cislini | Xiaolin Wang, Sc.D. | Xiaolin Wang, Sc.D. | Xiaolin Wang, Sc.D. | Xiaolin Wang, Sc.D. |
10-K
for the year ended December 31, 2025, as of the end of each respective year.
| (2) | CAP has been calculated based on the requirements and methodology set forth in the applicable SEC rules (Item 402(v) of Regulation S-K). The CAP calculation includes the end-of-year |
| will actually vest. To calculate CAP for 2025, the following amounts were deducted from and added to the total compensation number shown in the 2025 Summary Compensation Table: |
2025 (For PEO) ($) |
2025 (Average for Non PEO NEOs) |
|||||||
2025 Summary Compensation Table (“SCT”) Total Compensation |
$ | 14,672,390 | $ | 4,522,747 | ||||
Deduct for amounts reported under the “Stock Awards” and “Option Awards” columns in the SCT |
(12,963,190 | ) | (3,578,726 | ) | ||||
Fair value as of year-end of equity awards granted during the year that remain unvested |
20,200,922 | 5,576,891 | ||||||
Change in fair value of prior years’ equity awards that remain unvested as of year-end |
11,836,648 | 4,234,108 | ||||||
Fair value on vesting date for awards granted and vested in the same year |
2,843,064 | 784,874 | ||||||
Change in fair value from prior year-end to vesting date of prior years’ awards that vested during year |
472,397 | 155,056 | ||||||
Compensation Actually Paid (CAP) |
$ | 37,062,230 | $ | 11,694,949 | ||||
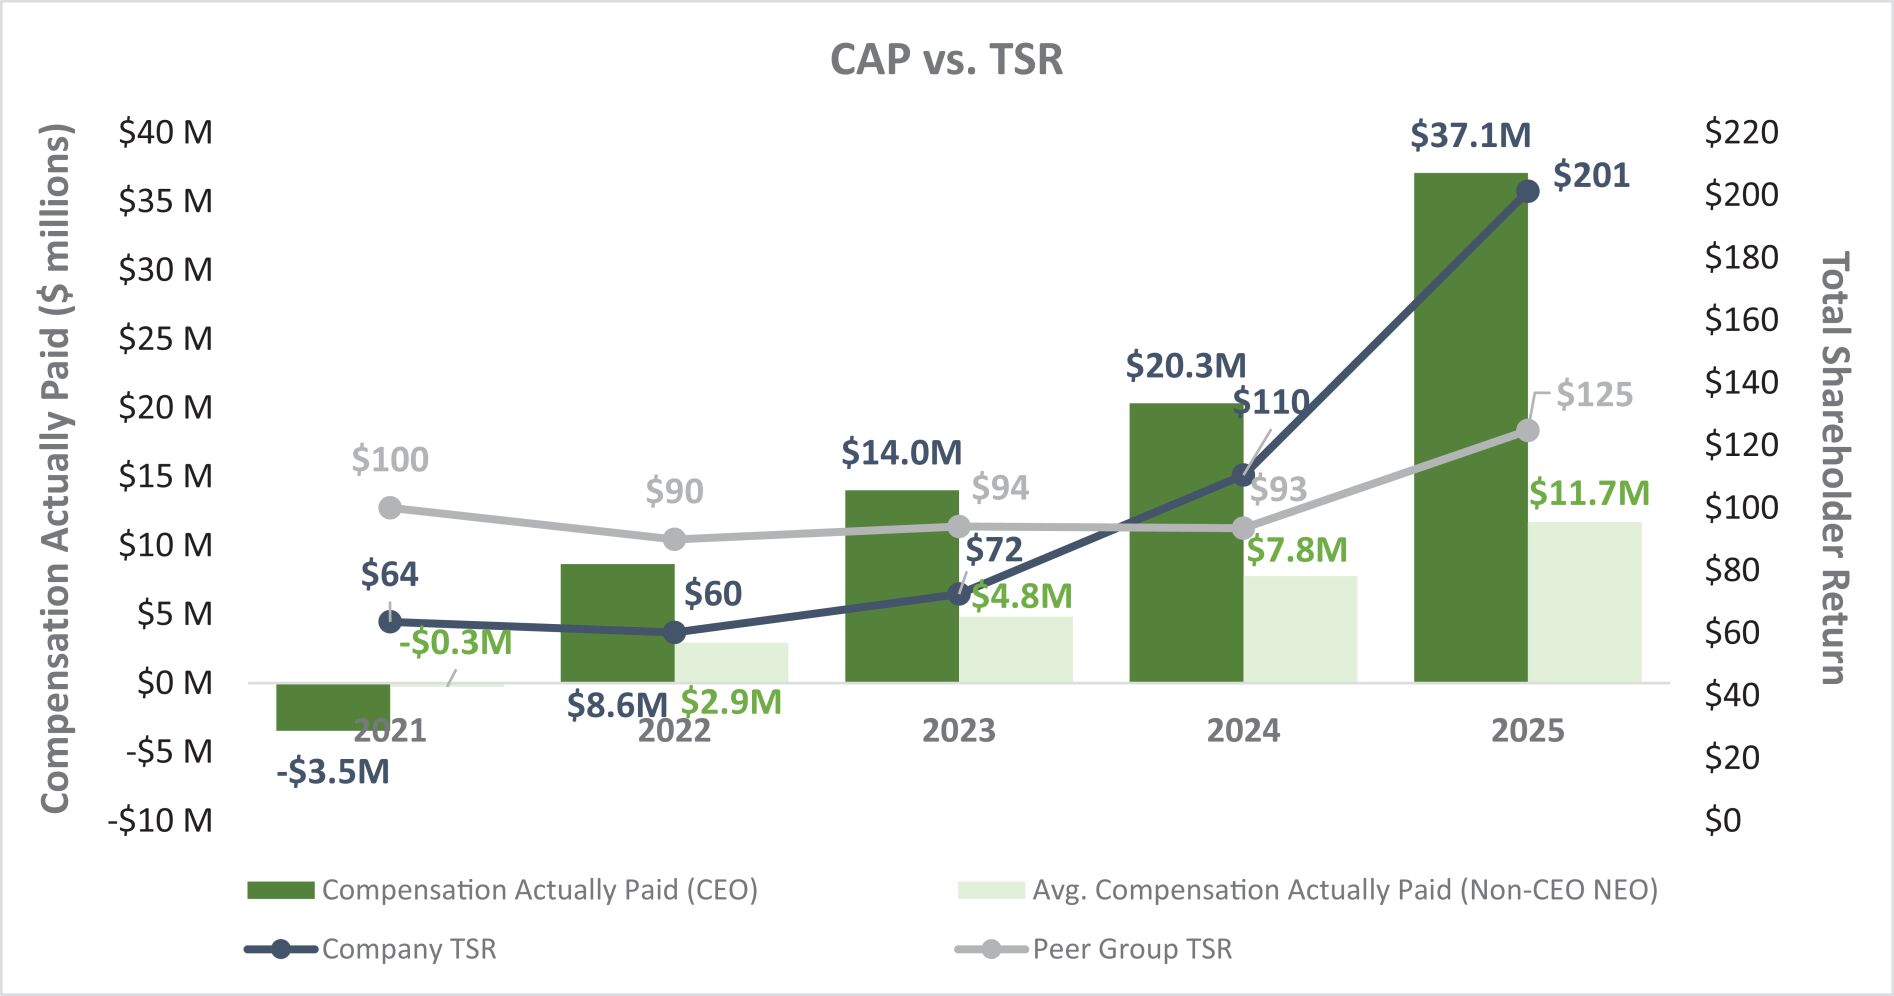
Relationship Between Compensation Actually Paid, Company TSR and Peer Group TSR
The chart below shows the graphical relationship between our PEO’s CAP and the average of our other NEOs’ CAP (as shown in the above Pay Versus Performance table), and TSR and Peer Group TSR.
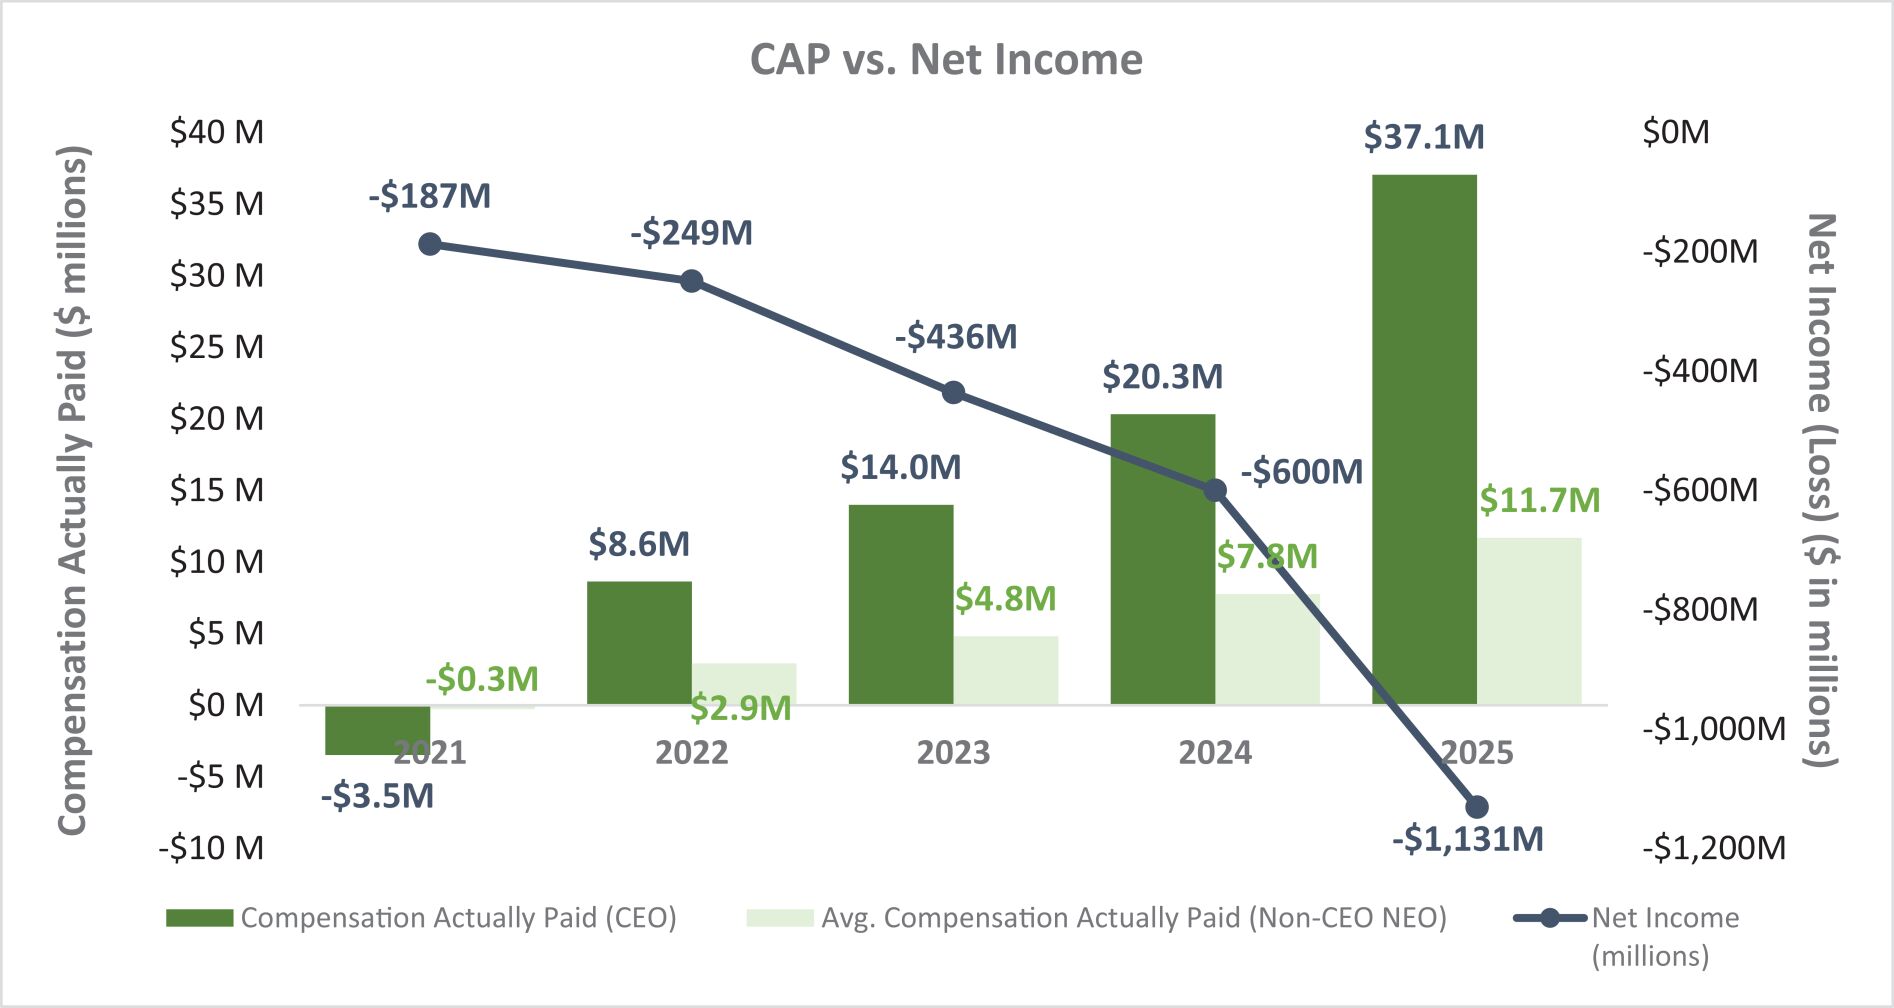
Relationship Between Compensation Actually Paid and Net Income
The chart below shows the graphical relationship between our PEO’s CAP and the average of our other NEOs’ CAP (as shown in the above Pay Versus Performance table), and our net income during the four most recently completed fiscal years.
Relationship Between Compensation Actually Paid, Company TSR and Peer Group TSR
The chart below shows the graphical relationship between our PEO’s CAP and the average of our other NEOs’ CAP (as shown in the above Pay Versus Performance table), and TSR and Peer Group TSR.