Pay vs Performance Disclosure - USD ($)
Dec. 31, 2025
Dec. 31, 2024
Dec. 31, 2023
Dec. 31, 2022
Dec. 31, 2021
Pay Versus Performance
As required by Section 953(a) of the Dodd-Frank Wall Street Reform and Consumer Protection Act, and Item 402(v) of Regulation S-K, we are providing the following information about the relationship between executive compensation actually paid and certain financial performance of the Company. For further information concerning the Company’s variable pay-for-performance philosophy and how the Company aligns executive compensation with the Company’s performance, refer to “Executive Compensation—Compensation Discussion and Analysis” on page 53.
VALUE OF INITIAL $100 INVESTMENT BASED ON: | ||||||||||||||||||||||||||
FISCAL YEAR | SUMMARY COMPENSATION TABLE TOTAL FOR PEO1 | COMPENSATION ACTUALLY PAID TO PEO2 | AVERAGE SUMMARY COMPENSATION TABLE TOTAL FOR NON-PEO NEOS3 | AVERAGE COMPENSATION ACTUALLY PAID TO NON-PEO NEOS4 | PENN TOTAL SHAREHOLDER RETURN5 | PEER GROUP TOTAL SHAREHOLDER RETURN6 | NET INCOME ($M)7 | ADJUSTED EBITDAR ($ IN MILLIONS)8 | ||||||||||||||||||
2025 | $24,126,651 | $10,375,989 | $5,845,528 | $3,063,710 | $17.08 | $85.84 | ($845.30) | $1,461.8 | ||||||||||||||||||
2024 | $26,676,300 | $13,213,672 | $5,906,163 | $3,034,477 | $22.95 | $89.32 | ($313.30) | $1,292.3 | ||||||||||||||||||
2023 | $15,542,305 | $10,187,197 | $3,800,856 | $3,866,865 | $30.13 | $92.81 | ($491.40) | $1,512.6 | ||||||||||||||||||
2022 | $14,075,614 | ($10,073,072) | $3,105,185 | $1,412,413 | $34.39 | $73.75 | $221.70 | $1,939.4 | ||||||||||||||||||
2021 | $65,887,214 | $7,961,396 | $3,440,477 | $2,027,447 | $60.03 | $98.54 | $420.50 | $1,994.4 | ||||||||||||||||||
1 | The dollar amounts reported are the amounts of total compensation reported for Mr. Snowden (our Principal Executive Officer) for each corresponding year in the “Total” column of the Summary Compensation Table. Refer to “Executive Compensation—Compensation Tables and Arrangements—2025 Summary Compensation Table.” |
2 | The dollar amounts reported represent the amount of “compensation actually paid” to Mr. Snowden, as computed in accordance with Item 402(v) of Regulation S-K. The dollar amounts do not reflect the actual amount of compensation earned by or paid to Mr. Snowden during the applicable year. In accordance with the requirements of Item 402(v) of Regulation S-K, the below “Compensation Actually Paid Calculation” table displays the adjustments made to Mr. Snowden’s total compensation for each year to determine the compensation actually paid. |
3 | The dollar amounts reported represent the average of the amounts reported for the Company’s named executive officers (NEOs) as a group (excluding Mr. Snowden) in the “Total” column of the Summary Compensation Table in each applicable year. The names of each of the NEOs (excluding Mr. Snowden) included for purposes of calculating the average amounts in each applicable year are as follows: (i) for 2022, 2023 and 2024, Felicia Hendrix, Todd George and Chris Rogers; and (ii) for 2021, Felicia Hendrix, Todd George and Harper Ko. |
4 | The dollar amounts reported represent the average amount of “compensation actually paid” to the NEOs as a group (excluding Mr. Snowden), as computed in accordance with Item 402(v) of Regulation S-K. The dollar amounts do not reflect the actual average amount of compensation earned by or paid to the NEOs as a group (excluding Mr. Snowden) during the applicable year. In accordance with the requirements of Item 402(v) of Regulation S-K, the below “Compensation Actually Paid Calculation” table displays the adjustments made to average total compensation for the NEOs as a group (excluding Mr. Snowden) for each year to determine the average compensation actually paid to the NEOs as a group (excluding Mr. Snowden). |
5 | Cumulative TSR is calculated by dividing the sum of the cumulative amount of dividends for the measurement period, assuming dividend reinvestment, and the difference between the Company’s share price at the end and the beginning of the measurement period by the Company’s share price at the beginning of the measurement period. |
6 | Represents the weighted peer group TSR, weighted according to the respective companies’ stock market capitalization at the beginning of each period for which a return is indicated. The peer group used for this purpose is the following published industry index: Russell 3000 Casino and Gambling Index. |
7 | The dollar amounts reported represent the amount of net income (loss) reflected in the Company’s audited financial statements for the applicable year. |
8 | The Company believes Adjusted EBITDAR is the financial performance measure most closely linked to the calculation of compensation actually paid. Adjusted EBITDAR is a non-GAAP financial measure. For a definition and reconciliation of this non-GAAP financial measure to the most directly comparable GAAP measure, see Appendix B to this Proxy Statement entitled “Reconciliation of GAAP to Non-GAAP Financial Measures.” |
Compensation Actually Paid Calculation
PEO | NEO AVERAGE | |||||||||||||||||||||||||||||||
2025 | 2024 | 2023 | 2022 | 2021 | 2025 | 2024 | 2023 | 2022 | 2021 | |||||||||||||||||||||||
Summary Compensation Table Total | $24,126,651 | $26,676,300 | $15,542,305 | $14,075,614 | $65,887,214 | $5,845,528 | $5,906,163 | $3,800,856 | $3,105,185 | $3,440,477 | ||||||||||||||||||||||
Less: Reported Fair Value of Equity Awards(a) | $18,999,993 | $21,627,843 | $8,953,479 | $6,961,325 | $57,104,584 | $4,051,328 | $4,197,649 | $2,045,705 | $1,470,912 | $1,645,208 | ||||||||||||||||||||||
Add: Year End Fair Value of Equity Awards(b) | $12,399,543 | $15,717,740 | $9,604,572 | $5,919,253 | $22,335,085 | $2,591,162 | $2,577,342 | $2,302,218 | $1,016,402 | $1,231,271 | ||||||||||||||||||||||
Add: Change in Fair Value of Outstanding and Unvested Equity Awards(b) | ($7,351,186) | ($7,005,536) | ($4,077,352) | ($18,419,902) | ($20,839,582) | ($1,337,465) | ($1,133,519) | ($271,763) | ($1,066,153) | ($1,020,003) | ||||||||||||||||||||||
Add: Fair Value as of Vesting Date of Equity Awards Granted and Vested in the Year(b) | — | — | — | — | — | — | — | — | — | — | ||||||||||||||||||||||
Add: Change in Fair Value of Equity Awards Granted in Prior Years that Vested in the Year(b) | $200,974 | ($546,988) | ($1,928,849) | ($4,686,713) | ($2,316,737) | $15,812 | ($117,859) | $81,259 | ($172,109) | $20,909 | ||||||||||||||||||||||
Less: Fair Value at the End of the Prior Year of Equity Awards that Failed to Meet Vesting Conditions in the Year(b) | — | — | — | — | — | — | — | — | — | — | ||||||||||||||||||||||
Add: Value of Dividends or other Earnings Paid on Stock or Option Awards not Otherwise Reflected in Fair Value or Total Compensation(b) | — | — | — | — | — | — | — | — | — | — | ||||||||||||||||||||||
Compensation Actually Paid(c) | $10,375,989 | $13,213,672 | $10,187,197 | ($10,073,072) | $7,961,396 | $3,063,710 | $3,034,477 | $3,866,865 | $1,412,413 | $2,027,447 | ||||||||||||||||||||||
(a) | The grant date fair value of equity awards represents the total of the amounts reported in the “Stock Awards” and “Option Awards” columns in the Summary Compensation Table for the applicable year. |
(b) | The equity award adjustments for each applicable year include the addition (or subtraction, as applicable) of the following: (i) the year-end fair value of any equity awards granted in the applicable year that are outstanding and unvested as of the end of the year; (ii) the amount of change as of the end of the applicable year (from the end of the prior fiscal year) in fair value of any awards granted in prior years that are outstanding and unvested as of the end of the applicable year; (iii) for awards that are granted and vest in the same applicable year, the fair value as of the vesting date; (iv) for awards granted in prior years that vest in the applicable year, the amount equal to the change as of the vesting date (from the end of the prior fiscal year) in fair value; and (v) for awards granted in prior years that are determined to fail to meet the applicable vesting conditions during the applicable year, a deduction for the amount equal to the fair value at the end of the prior fiscal year. The valuation assumptions used to calculate fair values did not materially differ from those disclosed at the time of grant. |
(c) | The Company does not maintain any defined benefit pension programs for its executives. |
1 | The dollar amounts reported are the amounts of total compensation reported for Mr. Snowden (our Principal Executive Officer) for each corresponding year in the “Total” column of the Summary Compensation Table. Refer to “Executive Compensation—Compensation Tables and Arrangements—2025 Summary Compensation Table.” |
3 | The dollar amounts reported represent the average of the amounts reported for the Company’s named executive officers (NEOs) as a group (excluding Mr. Snowden) in the “Total” column of the Summary Compensation Table in each applicable year. The names of each of the NEOs (excluding Mr. Snowden) included for purposes of calculating the average amounts in each applicable year are as follows: (i) for 2022, 2023 and 2024, Felicia Hendrix, Todd George and Chris Rogers; and (ii) for 2021, Felicia Hendrix, Todd George and Harper Ko. |
6 | Represents the weighted peer group TSR, weighted according to the respective companies’ stock market capitalization at the beginning of each period for which a return is indicated. The peer group used for this purpose is the following published industry index: Russell 3000 Casino and Gambling Index. |
2 | The dollar amounts reported represent the amount of “compensation actually paid” to Mr. Snowden, as computed in accordance with Item 402(v) of Regulation S-K. The dollar amounts do not reflect the actual amount of compensation earned by or paid to Mr. Snowden during the applicable year. In accordance with the requirements of Item 402(v) of Regulation S-K, the below “Compensation Actually Paid Calculation” table displays the adjustments made to Mr. Snowden’s total compensation for each year to determine the compensation actually paid. |
Compensation Actually Paid Calculation
PEO | NEO AVERAGE | |||||||||||||||||||||||||||||||
2025 | 2024 | 2023 | 2022 | 2021 | 2025 | 2024 | 2023 | 2022 | 2021 | |||||||||||||||||||||||
Summary Compensation Table Total | $24,126,651 | $26,676,300 | $15,542,305 | $14,075,614 | $65,887,214 | $5,845,528 | $5,906,163 | $3,800,856 | $3,105,185 | $3,440,477 | ||||||||||||||||||||||
Less: Reported Fair Value of Equity Awards(a) | $18,999,993 | $21,627,843 | $8,953,479 | $6,961,325 | $57,104,584 | $4,051,328 | $4,197,649 | $2,045,705 | $1,470,912 | $1,645,208 | ||||||||||||||||||||||
Add: Year End Fair Value of Equity Awards(b) | $12,399,543 | $15,717,740 | $9,604,572 | $5,919,253 | $22,335,085 | $2,591,162 | $2,577,342 | $2,302,218 | $1,016,402 | $1,231,271 | ||||||||||||||||||||||
Add: Change in Fair Value of Outstanding and Unvested Equity Awards(b) | ($7,351,186) | ($7,005,536) | ($4,077,352) | ($18,419,902) | ($20,839,582) | ($1,337,465) | ($1,133,519) | ($271,763) | ($1,066,153) | ($1,020,003) | ||||||||||||||||||||||
Add: Fair Value as of Vesting Date of Equity Awards Granted and Vested in the Year(b) | — | — | — | — | — | — | — | — | — | — | ||||||||||||||||||||||
Add: Change in Fair Value of Equity Awards Granted in Prior Years that Vested in the Year(b) | $200,974 | ($546,988) | ($1,928,849) | ($4,686,713) | ($2,316,737) | $15,812 | ($117,859) | $81,259 | ($172,109) | $20,909 | ||||||||||||||||||||||
Less: Fair Value at the End of the Prior Year of Equity Awards that Failed to Meet Vesting Conditions in the Year(b) | — | — | — | — | — | — | — | — | — | — | ||||||||||||||||||||||
Add: Value of Dividends or other Earnings Paid on Stock or Option Awards not Otherwise Reflected in Fair Value or Total Compensation(b) | — | — | — | — | — | — | — | — | — | — | ||||||||||||||||||||||
Compensation Actually Paid(c) | $10,375,989 | $13,213,672 | $10,187,197 | ($10,073,072) | $7,961,396 | $3,063,710 | $3,034,477 | $3,866,865 | $1,412,413 | $2,027,447 | ||||||||||||||||||||||
(a) | The grant date fair value of equity awards represents the total of the amounts reported in the “Stock Awards” and “Option Awards” columns in the Summary Compensation Table for the applicable year. |
(b) | The equity award adjustments for each applicable year include the addition (or subtraction, as applicable) of the following: (i) the year-end fair value of any equity awards granted in the applicable year that are outstanding and unvested as of the end of the year; (ii) the amount of change as of the end of the applicable year (from the end of the prior fiscal year) in fair value of any awards granted in prior years that are outstanding and unvested as of the end of the applicable year; (iii) for awards that are granted and vest in the same applicable year, the fair value as of the vesting date; (iv) for awards granted in prior years that vest in the applicable year, the amount equal to the change as of the vesting date (from the end of the prior fiscal year) in fair value; and (v) for awards granted in prior years that are determined to fail to meet the applicable vesting conditions during the applicable year, a deduction for the amount equal to the fair value at the end of the prior fiscal year. The valuation assumptions used to calculate fair values did not materially differ from those disclosed at the time of grant. |
(c) | The Company does not maintain any defined benefit pension programs for its executives. |
4 | The dollar amounts reported represent the average amount of “compensation actually paid” to the NEOs as a group (excluding Mr. Snowden), as computed in accordance with Item 402(v) of Regulation S-K. The dollar amounts do not reflect the actual average amount of compensation earned by or paid to the NEOs as a group (excluding Mr. Snowden) during the applicable year. In accordance with the requirements of Item 402(v) of Regulation S-K, the below “Compensation Actually Paid Calculation” table displays the adjustments made to average total compensation for the NEOs as a group (excluding Mr. Snowden) for each year to determine the average compensation actually paid to the NEOs as a group (excluding Mr. Snowden). |
Compensation Actually Paid Calculation
PEO | NEO AVERAGE | |||||||||||||||||||||||||||||||
2025 | 2024 | 2023 | 2022 | 2021 | 2025 | 2024 | 2023 | 2022 | 2021 | |||||||||||||||||||||||
Summary Compensation Table Total | $24,126,651 | $26,676,300 | $15,542,305 | $14,075,614 | $65,887,214 | $5,845,528 | $5,906,163 | $3,800,856 | $3,105,185 | $3,440,477 | ||||||||||||||||||||||
Less: Reported Fair Value of Equity Awards(a) | $18,999,993 | $21,627,843 | $8,953,479 | $6,961,325 | $57,104,584 | $4,051,328 | $4,197,649 | $2,045,705 | $1,470,912 | $1,645,208 | ||||||||||||||||||||||
Add: Year End Fair Value of Equity Awards(b) | $12,399,543 | $15,717,740 | $9,604,572 | $5,919,253 | $22,335,085 | $2,591,162 | $2,577,342 | $2,302,218 | $1,016,402 | $1,231,271 | ||||||||||||||||||||||
Add: Change in Fair Value of Outstanding and Unvested Equity Awards(b) | ($7,351,186) | ($7,005,536) | ($4,077,352) | ($18,419,902) | ($20,839,582) | ($1,337,465) | ($1,133,519) | ($271,763) | ($1,066,153) | ($1,020,003) | ||||||||||||||||||||||
Add: Fair Value as of Vesting Date of Equity Awards Granted and Vested in the Year(b) | — | — | — | — | — | — | — | — | — | — | ||||||||||||||||||||||
Add: Change in Fair Value of Equity Awards Granted in Prior Years that Vested in the Year(b) | $200,974 | ($546,988) | ($1,928,849) | ($4,686,713) | ($2,316,737) | $15,812 | ($117,859) | $81,259 | ($172,109) | $20,909 | ||||||||||||||||||||||
Less: Fair Value at the End of the Prior Year of Equity Awards that Failed to Meet Vesting Conditions in the Year(b) | — | — | — | — | — | — | — | — | — | — | ||||||||||||||||||||||
Add: Value of Dividends or other Earnings Paid on Stock or Option Awards not Otherwise Reflected in Fair Value or Total Compensation(b) | — | — | — | — | — | — | — | — | — | — | ||||||||||||||||||||||
Compensation Actually Paid(c) | $10,375,989 | $13,213,672 | $10,187,197 | ($10,073,072) | $7,961,396 | $3,063,710 | $3,034,477 | $3,866,865 | $1,412,413 | $2,027,447 | ||||||||||||||||||||||
(a) | The grant date fair value of equity awards represents the total of the amounts reported in the “Stock Awards” and “Option Awards” columns in the Summary Compensation Table for the applicable year. |
(b) | The equity award adjustments for each applicable year include the addition (or subtraction, as applicable) of the following: (i) the year-end fair value of any equity awards granted in the applicable year that are outstanding and unvested as of the end of the year; (ii) the amount of change as of the end of the applicable year (from the end of the prior fiscal year) in fair value of any awards granted in prior years that are outstanding and unvested as of the end of the applicable year; (iii) for awards that are granted and vest in the same applicable year, the fair value as of the vesting date; (iv) for awards granted in prior years that vest in the applicable year, the amount equal to the change as of the vesting date (from the end of the prior fiscal year) in fair value; and (v) for awards granted in prior years that are determined to fail to meet the applicable vesting conditions during the applicable year, a deduction for the amount equal to the fair value at the end of the prior fiscal year. The valuation assumptions used to calculate fair values did not materially differ from those disclosed at the time of grant. |
(c) | The Company does not maintain any defined benefit pension programs for its executives. |
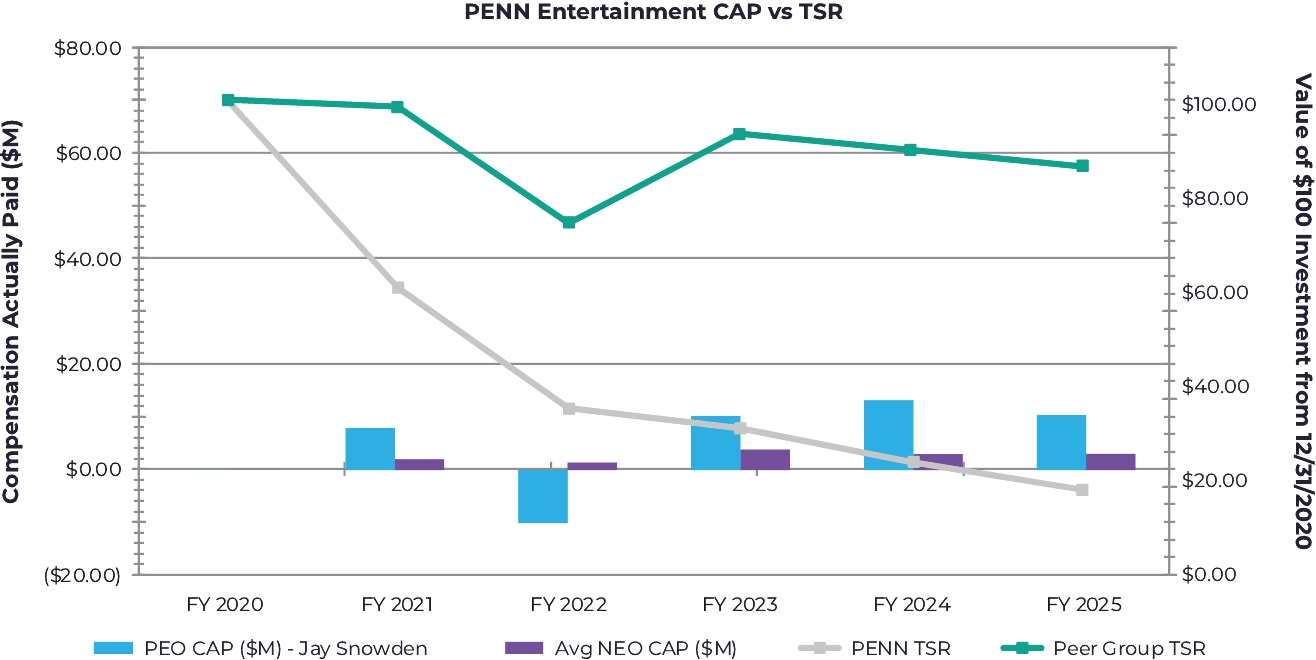
Description of Relationship Between PEO and Average Non-PEO NEO Compensation Actually Paid and Company TSR
The following chart sets forth the relationship between Compensation Actually Paid to our PEO, the average of Compensation Actually Paid to our Non-PEO NEOs, and cumulative TSR of the Company and the peer group (the Russell 3000 Casino & Gambling Index) over the five most recently completed fiscal years.
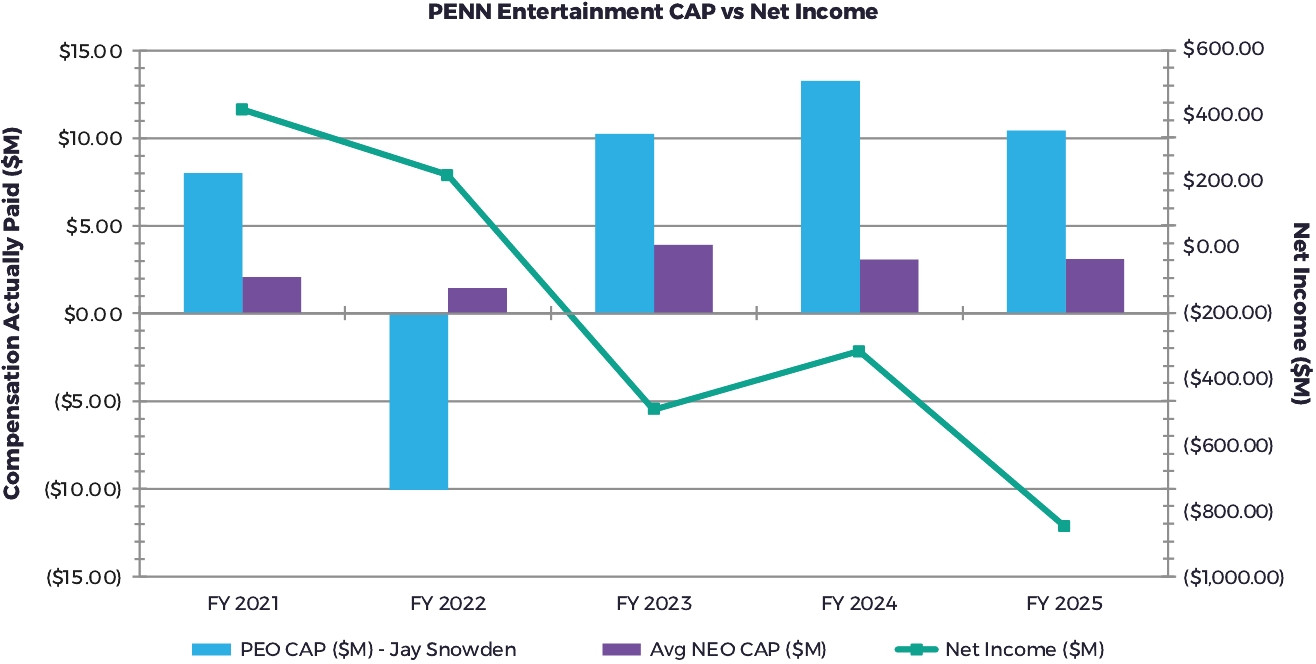
Description of Relationship Between PEO and Average Non-PEO NEO Compensation Actually Paid and Net Income
The following chart sets forth the relationship between Compensation Actually Paid (CAP) to our PEO, the average of Compensation Actually Paid to our Non-PEO NEOs, and our Net Income during the five most recently completed fiscal years. While the Company does not use net income as a performance measure in the overall executive compensation program, the measure of net income is correlated with the measure Adjusted EBITDAR, which the Company does use when setting goals in the Company’s STIP and LTIP.
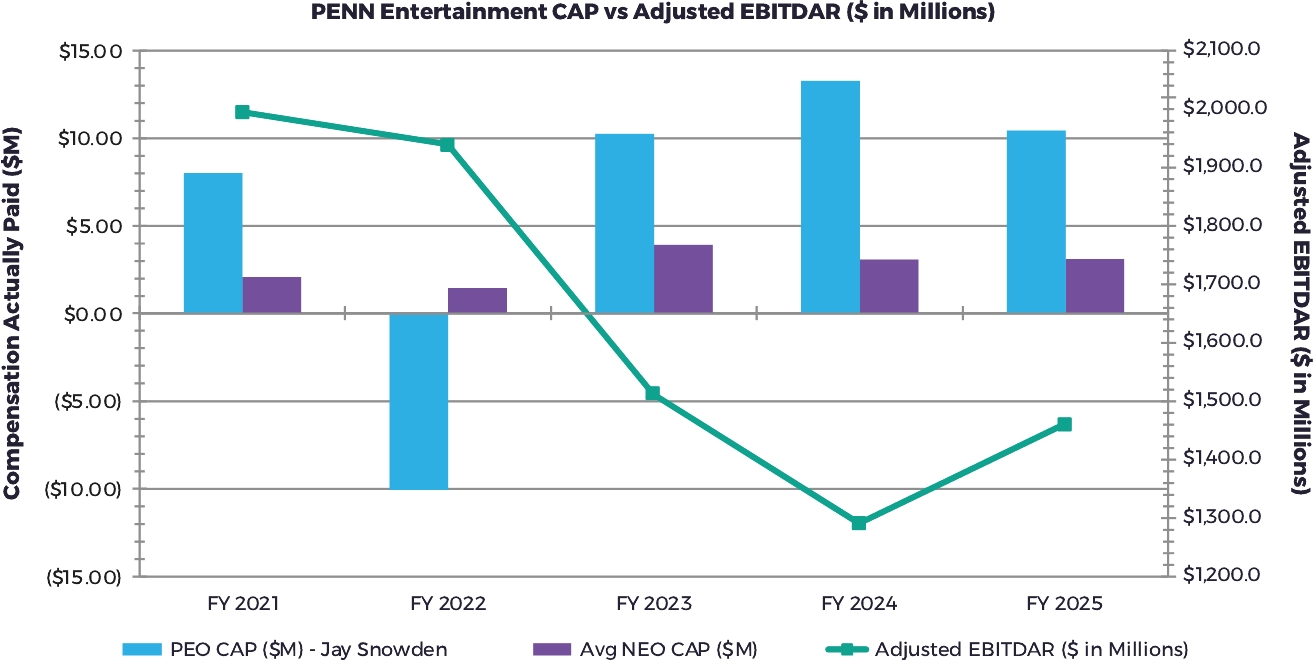
Description of Relationship Between PEO and Average Non-PEO NEO Compensation Actually Paid and Adjusted EBITDAR
The following chart sets forth the relationship between Compensation Actually Paid (CAP) to our PEO, the average of Compensation Actually Paid to our non-PEO NEOs, and our Adjusted EBITDAR during the five most recently completed fiscal years. While the Company uses numerous measures, both financial and non-financial, for the purpose of evaluating performance for the Company’s compensation programs, the Company has determined that Adjusted EBITDAR is the most important financial performance measure used to link the Company’s financial performance to compensation actually paid to the Company’s NEOs for the most recently completed fiscal year.
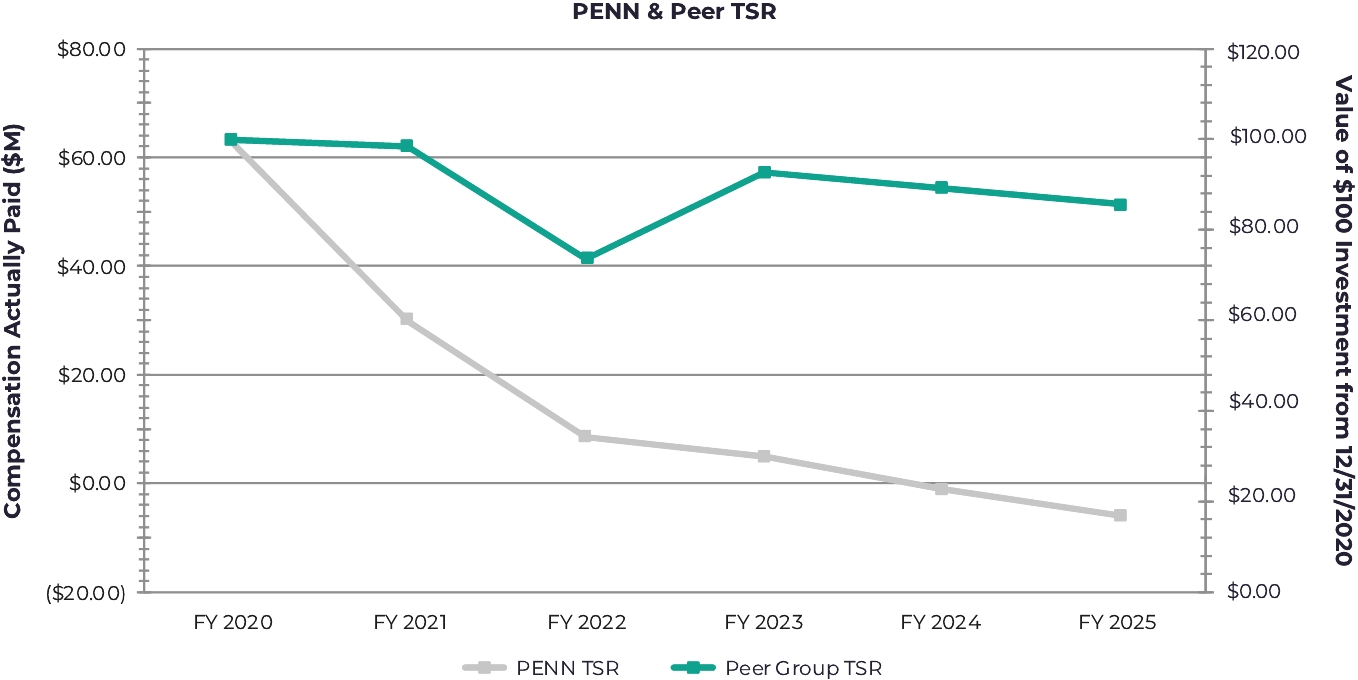
Description of Relationship Between Company TSR and Peer Group TSR
The following chart compares our cumulative TSR over the five most recently completed fiscal years to that of the peer group (the Russell 3000 Casino & Gambling Index) over the same period.
Most Important Financial Performance Measures
The below table represents the most important financial performance measures used to link compensation actually paid to our NEOs to the Company’s performance for the most recently completed fiscal year, as further described in “Executive Compensation – Compensation Discussion and Analysis” of this Proxy Statement.
Adjusted EBITDAR | ||
Retail Adjusted EBITDAR | ||
Interactive Adjusted EBITDA | ||
8 | The Company believes Adjusted EBITDAR is the financial performance measure most closely linked to the calculation of compensation actually paid. Adjusted EBITDAR is a non-GAAP financial measure. For a definition and reconciliation of this non-GAAP financial measure to the most directly comparable GAAP measure, see Appendix B to this Proxy Statement entitled “Reconciliation of GAAP to Non-GAAP Financial Measures.” |