Pay vs Performance Disclosure - USD ($)
|
12 Months Ended |
Dec. 31, 2025 |
Dec. 31, 2024 |
Dec. 31, 2023 |
| Pay vs Performance Disclosure |
|
|
|
| Pay vs Performance Disclosure, Table |
| | | | | | | | | | | | | | | | | | | | | | | | | | | | Year | Summary compensation table total for PEO(1) | Compensation actually paid to PEO(1) | Average summary compensation table total for non-PEO named executive officers(2) | Average compensation actually paid to non-PEO named executive officers(2) | Value of initial fixed $100 investment based on: | Net income ($M)(5) |
Adjusted Net Income ($M)(6)
| Total Shareholder return(3) | Peer group total shareholder return(4) | | 2025 | 17,845,830 | 28,266,163 | 2,316,590 | 2,283,468 | 271 | 142 | 701.4 | 749.6 | | 2024 | 33,469,277 | 108,213,011 | 6,496,724 | 12,743,329 | 236 | 134 | 438.7 | 616.2 | | 2023 | 105,361,975(7) | 155,064,225 | 14,102,125(7) | 19,399,781 | 124 | 104 | 167.1 | 449.3 |
|
|
|
| Company Selected Measure Name |
Adjusted Net Income
|
|
|
| Named Executive Officers, Footnote |
For each of the years presented in the table, our principal executive officer (“PEO”) is our Chief Executive Officer, Mark Barrocas.
|
|
|
| Peer Group Issuers, Footnote |
The peer group used for this purpose is the following published industry index: S&P 500 Consumer Discretionary Sector Index.
|
|
|
| PEO Total Compensation Amount |
$ 17,845,830
|
$ 33,469,277
|
$ 105,361,975
|
| PEO Actually Paid Compensation Amount |
$ 28,266,163
|
108,213,011
|
155,064,225
|
| Adjustment To PEO Compensation, Footnote |
For each of the years presented in the table, our principal executive officer (“PEO”) is our Chief Executive Officer, Mark Barrocas. The amount of “Compensation Actually Paid” to Mr. Barrocas is computed in accordance with Item 402(v) of Regulation S-K. This amount does not reflect the total compensation actually realized or received by Mr. Barrocas. In accordance with Item 402(v) of Regulation S-K, these amounts reflect “Total” compensation as set forth in the Summary Compensation Table for each year, adjusted as shown below. Equity values are calculated in accordance with FASB ASC Topic 718, and the valuation assumptions used to calculate fair values did not materially differ from those disclosed at the time of grant.
| | | | | | | | | | | | | Compensation Actually Paid to PEO | 2025 | 2024 | 2023 | | Summary Compensation Table Total | 17,845,830 | 33,469,277 | 105,361,975 | Less, value of “Stock Awards” reported in Summary Compensation Table | 0 | (21,498,702) | (64,894,074) | Less, change in pension value and Non-Qualified Deferred Compensation earnings | 0 | 0 | 0 | Plus, year-end fair value of outstanding and unvested equity awards granted in the year | 0 | 0 | 107,726,037 | Plus (less), year over year change in fair value of outstanding and unvested equity awards granted in prior years | 6,803,397 | 43,225,433 | 0 | Plus (less), year over year change in fair value of equity awards granted in prior years that vested in the year | 3,616,937 | 53,017,003 | 6,870,287 | Plus change in dividends accrued | 0 | 0 | 0 | | Compensation Actually Paid to PEO | 28,266,163 | 108,213,011 | 155,064,225 |
|
|
|
| Non-PEO NEO Average Total Compensation Amount |
$ 2,316,590
|
6,496,724
|
14,102,125
|
| Non-PEO NEO Average Compensation Actually Paid Amount |
$ 2,283,468
|
12,743,329
|
19,399,781
|
| Adjustment to Non-PEO NEO Compensation Footnote |
For each of the years presented in the table, our non-principal executive officers who are NEOs (“non-PEO NEOs”) are Adam Quigley, Patraic Reagan, Pedro J. Lopez-Baldrich and Neil Shah with respect to fiscal year 2025, Patraic Reagan, Larry Flynn, Pedro J. Lopez-Baldrich and Neil Shah with respect to fiscal year 2024, and Larry Flynn, Pedro J. Lopez-Baldrich and Neil Shah with respect to fiscal year 2023.
| | | | | | | | | | | | | Compensation Actually Paid to Non-PEO NEOs | 2025 | 2024 | 2023 | | Average Summary Compensation Table Total | 2,316,590 | 6,496,724 | 14,102,125 | Less, value of “Stock Awards” reported in Summary Compensation Table | (134,338) | (2,774,587) | (6,681,341) | Less, change in pension value and Non-Qualified Deferred Compensation earnings | 0 | 0 | 0 | Plus, year-end fair value of outstanding and unvested equity awards granted in the year | 122,083 | 2,072,275 | 11,978,997 | Plus (less), year over year change in fair value of outstanding and unvested equity awards granted in prior years | (330,075) | 3,592,196 | 0 | Plus (less), year over year change in fair value of equity awards granted in prior years that vested in the year | 309,208 | 3,356,721 | 0 | Plus change in dividends accrued | 0 | 0 | 0 | | Compensation Actually Paid to Non-PEO NEOs | 2,283,468 | 12,743,329 | 19,399,781 |
|
|
|
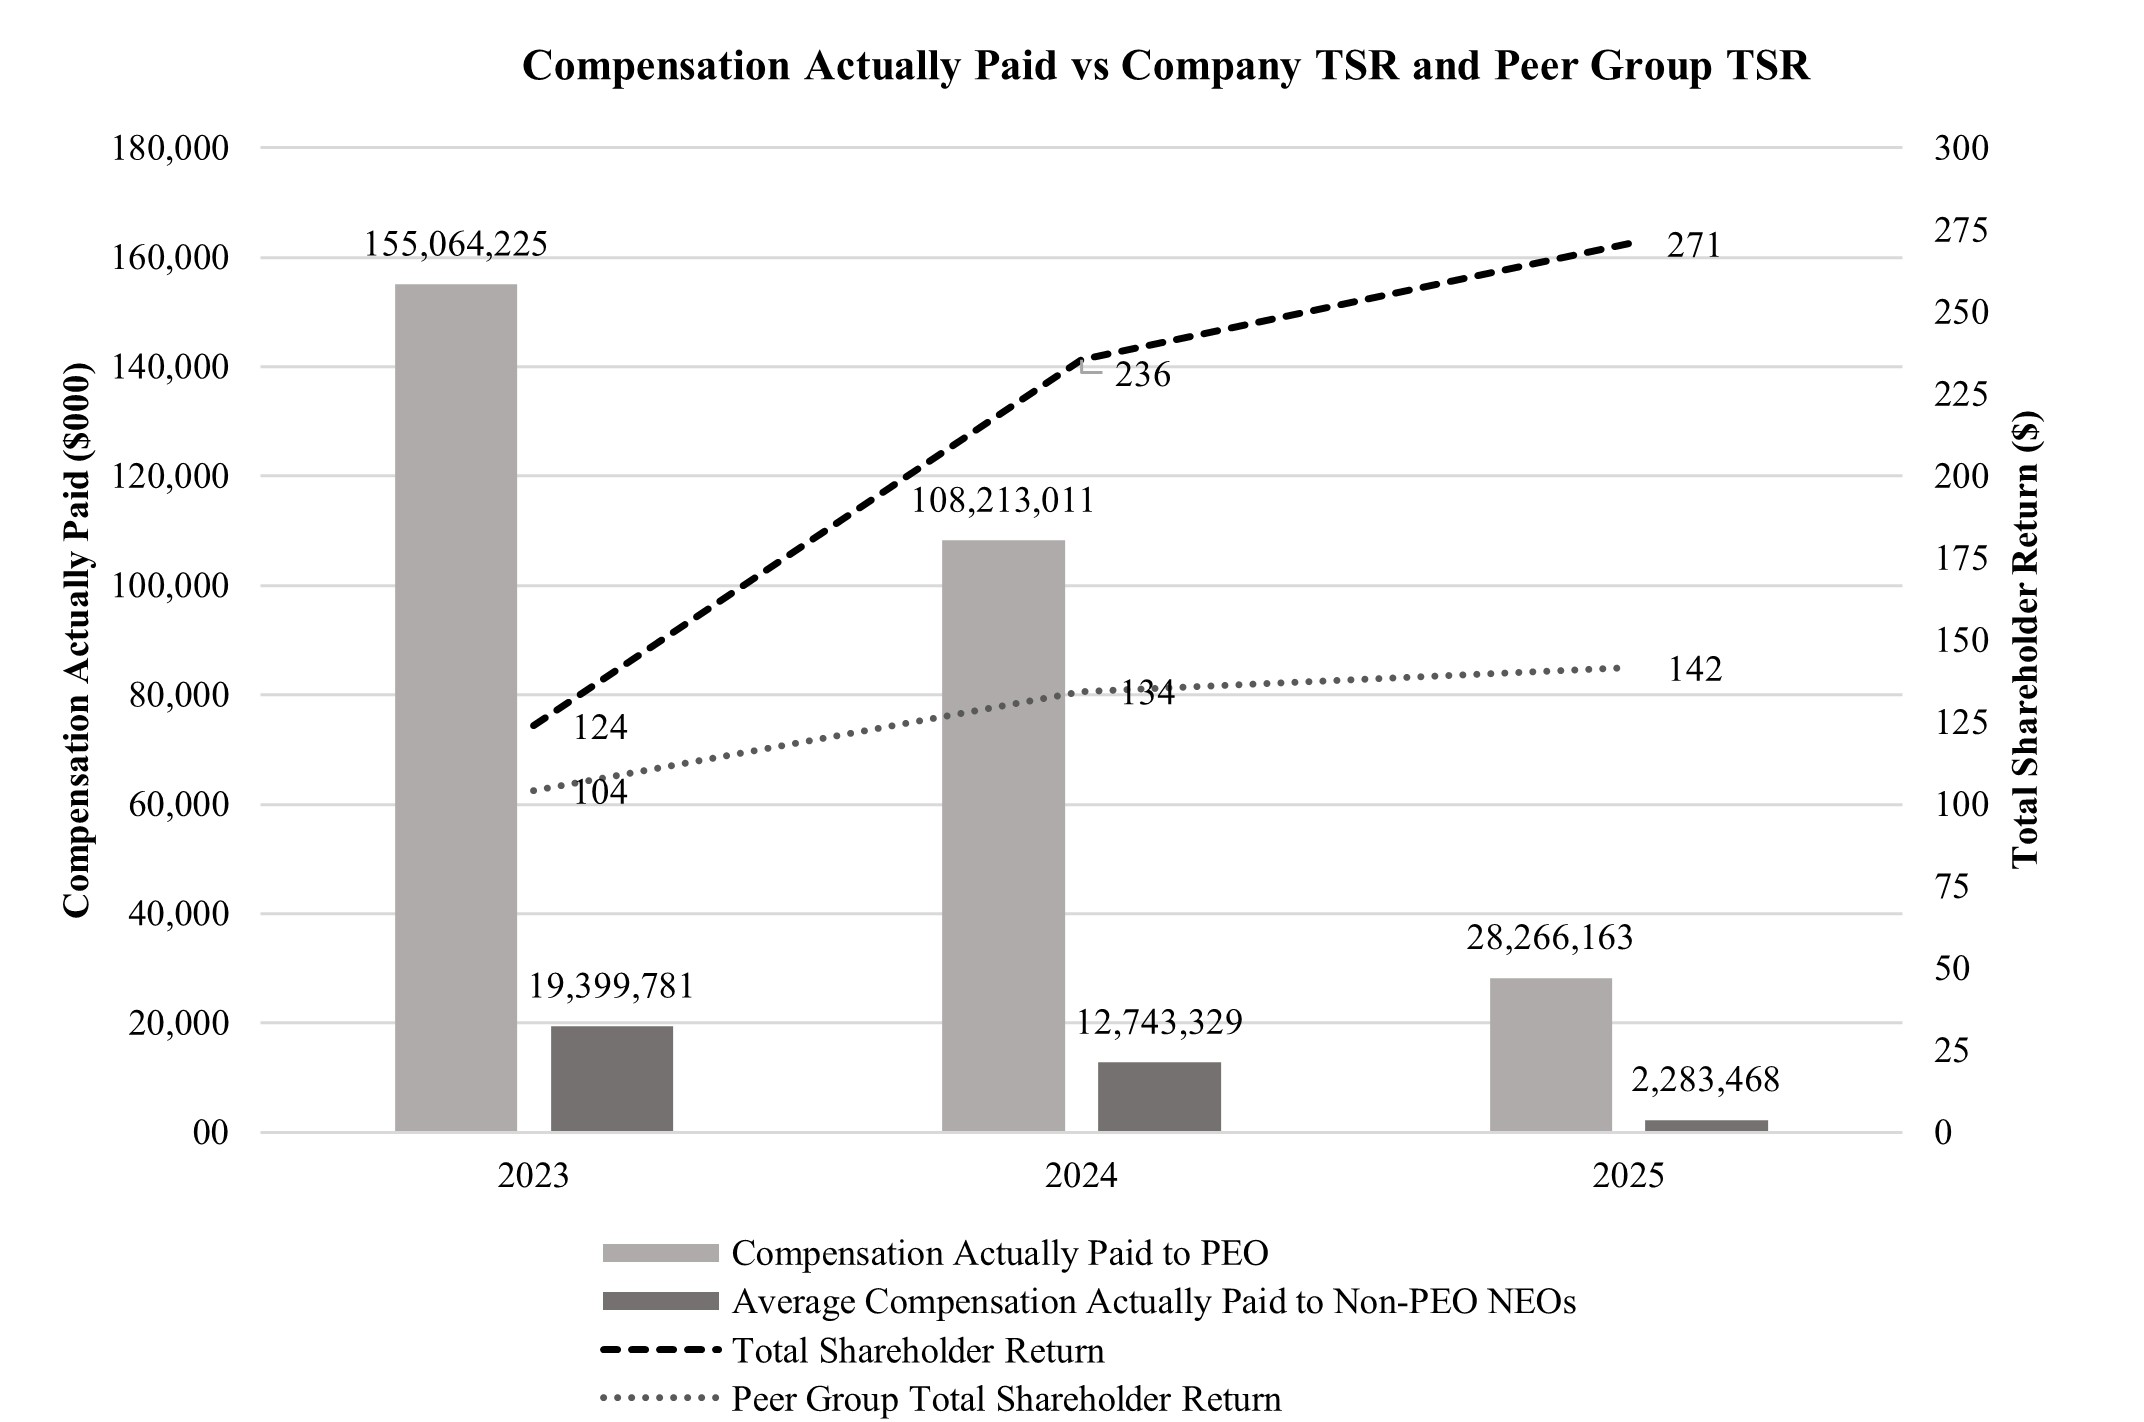
| Compensation Actually Paid vs. Total Shareholder Return |
The following graph illustrates the relationship between Compensation Actually Paid for the PEO and average non-PEO NEO and the Total Shareholder Return of SharkNinja and the S&P 500 Consumer Discretionary Index for the fiscal years ended December 31, 2025, 2024, and 2023.
|
|
|
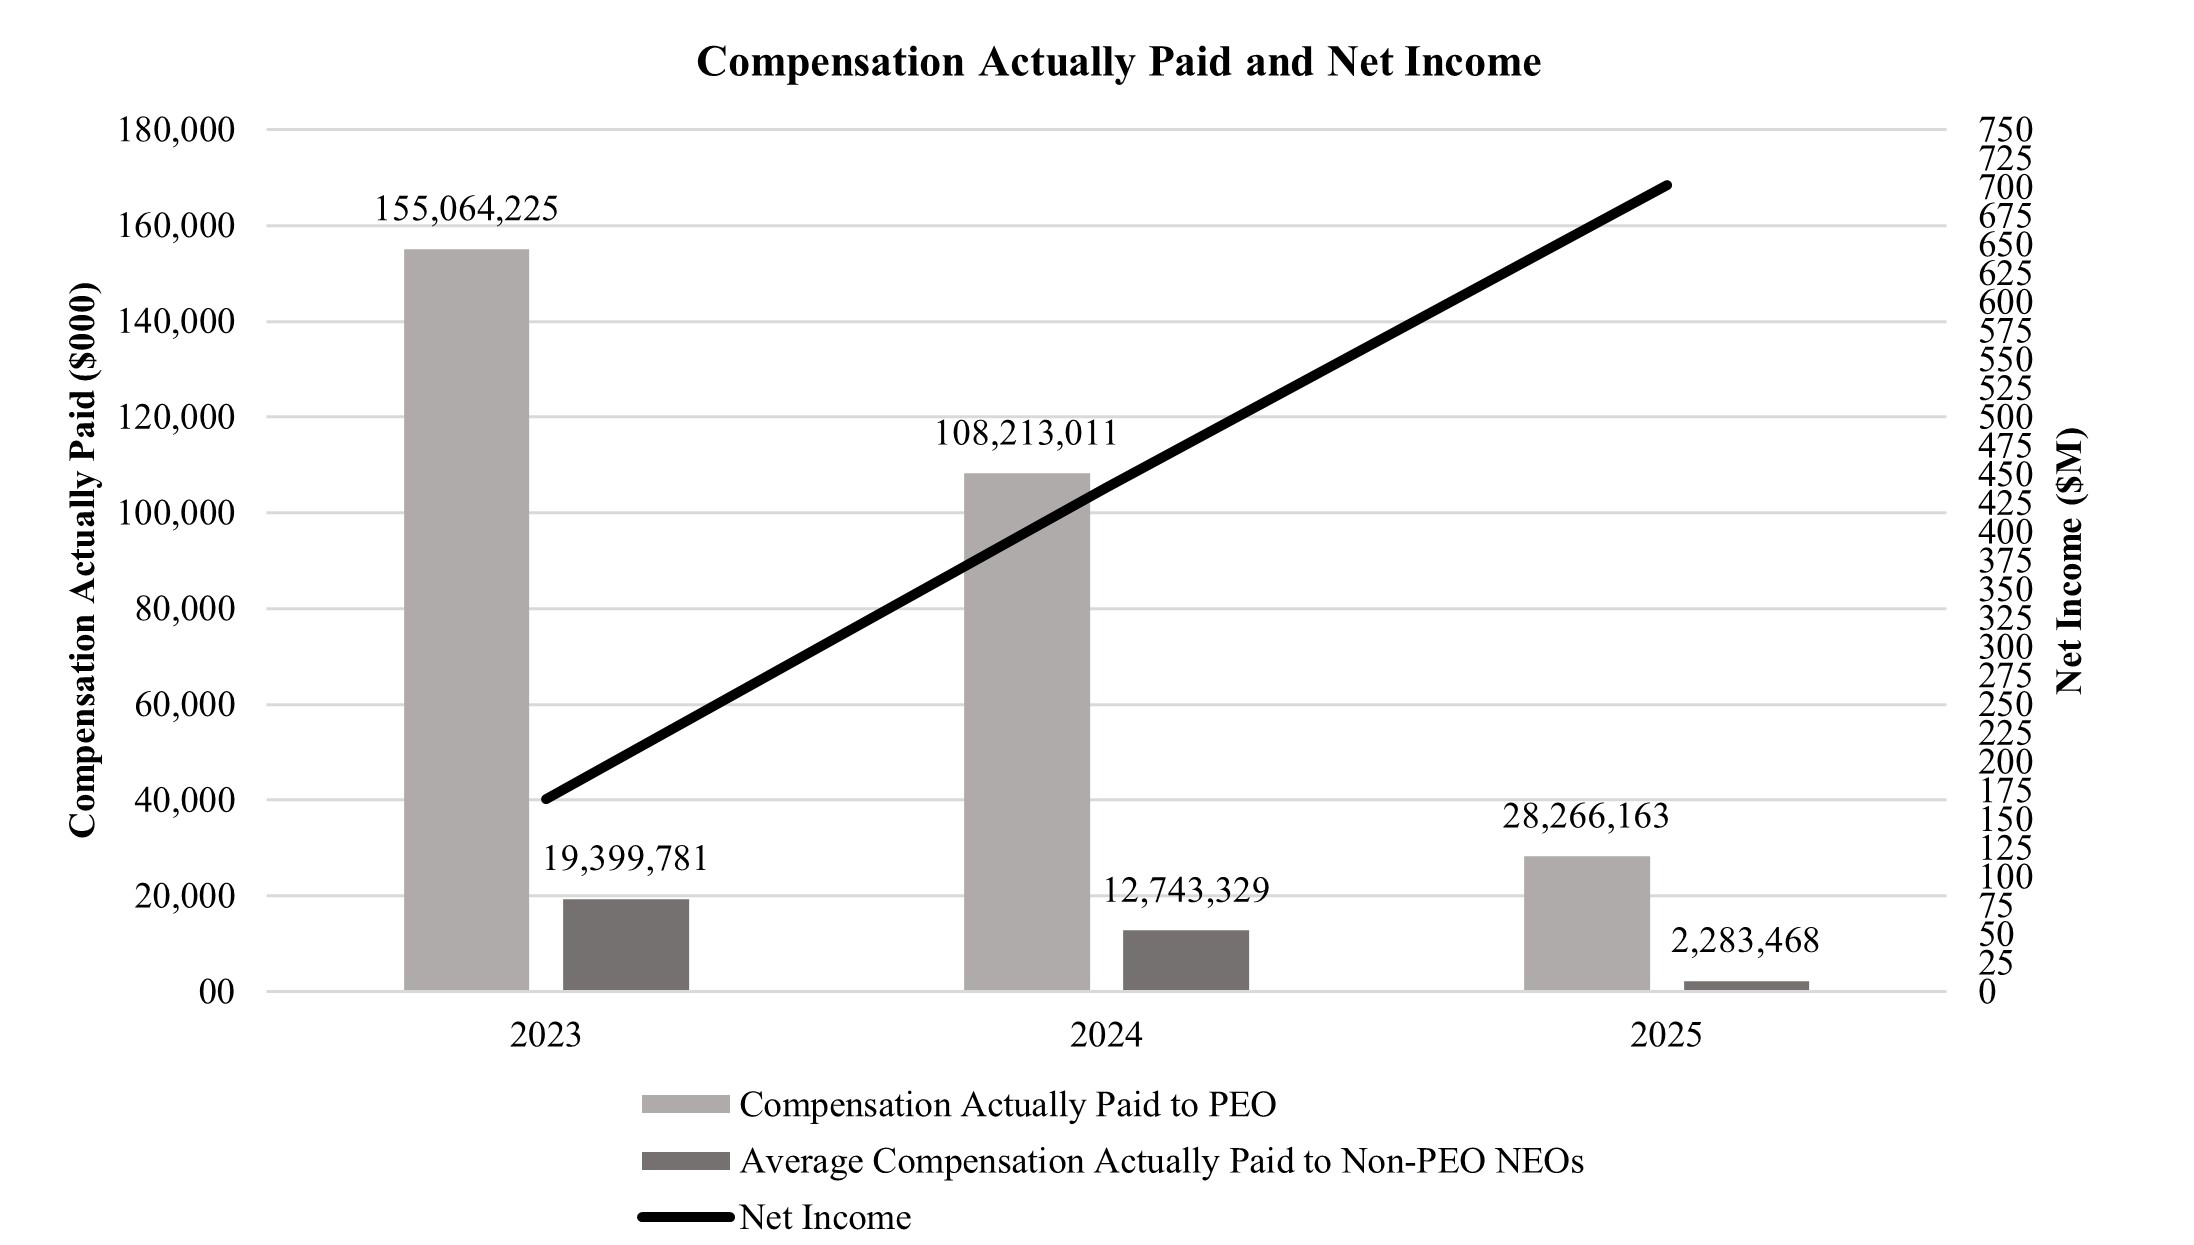
| Compensation Actually Paid vs. Net Income |
The following graph illustrates the relationship between Compensation Actually Paid for the PEO and average non-PEO NEO and the Company’s Net Income for the fiscal years ended December 31, 2025, 2024, and 2023.
|
|
|
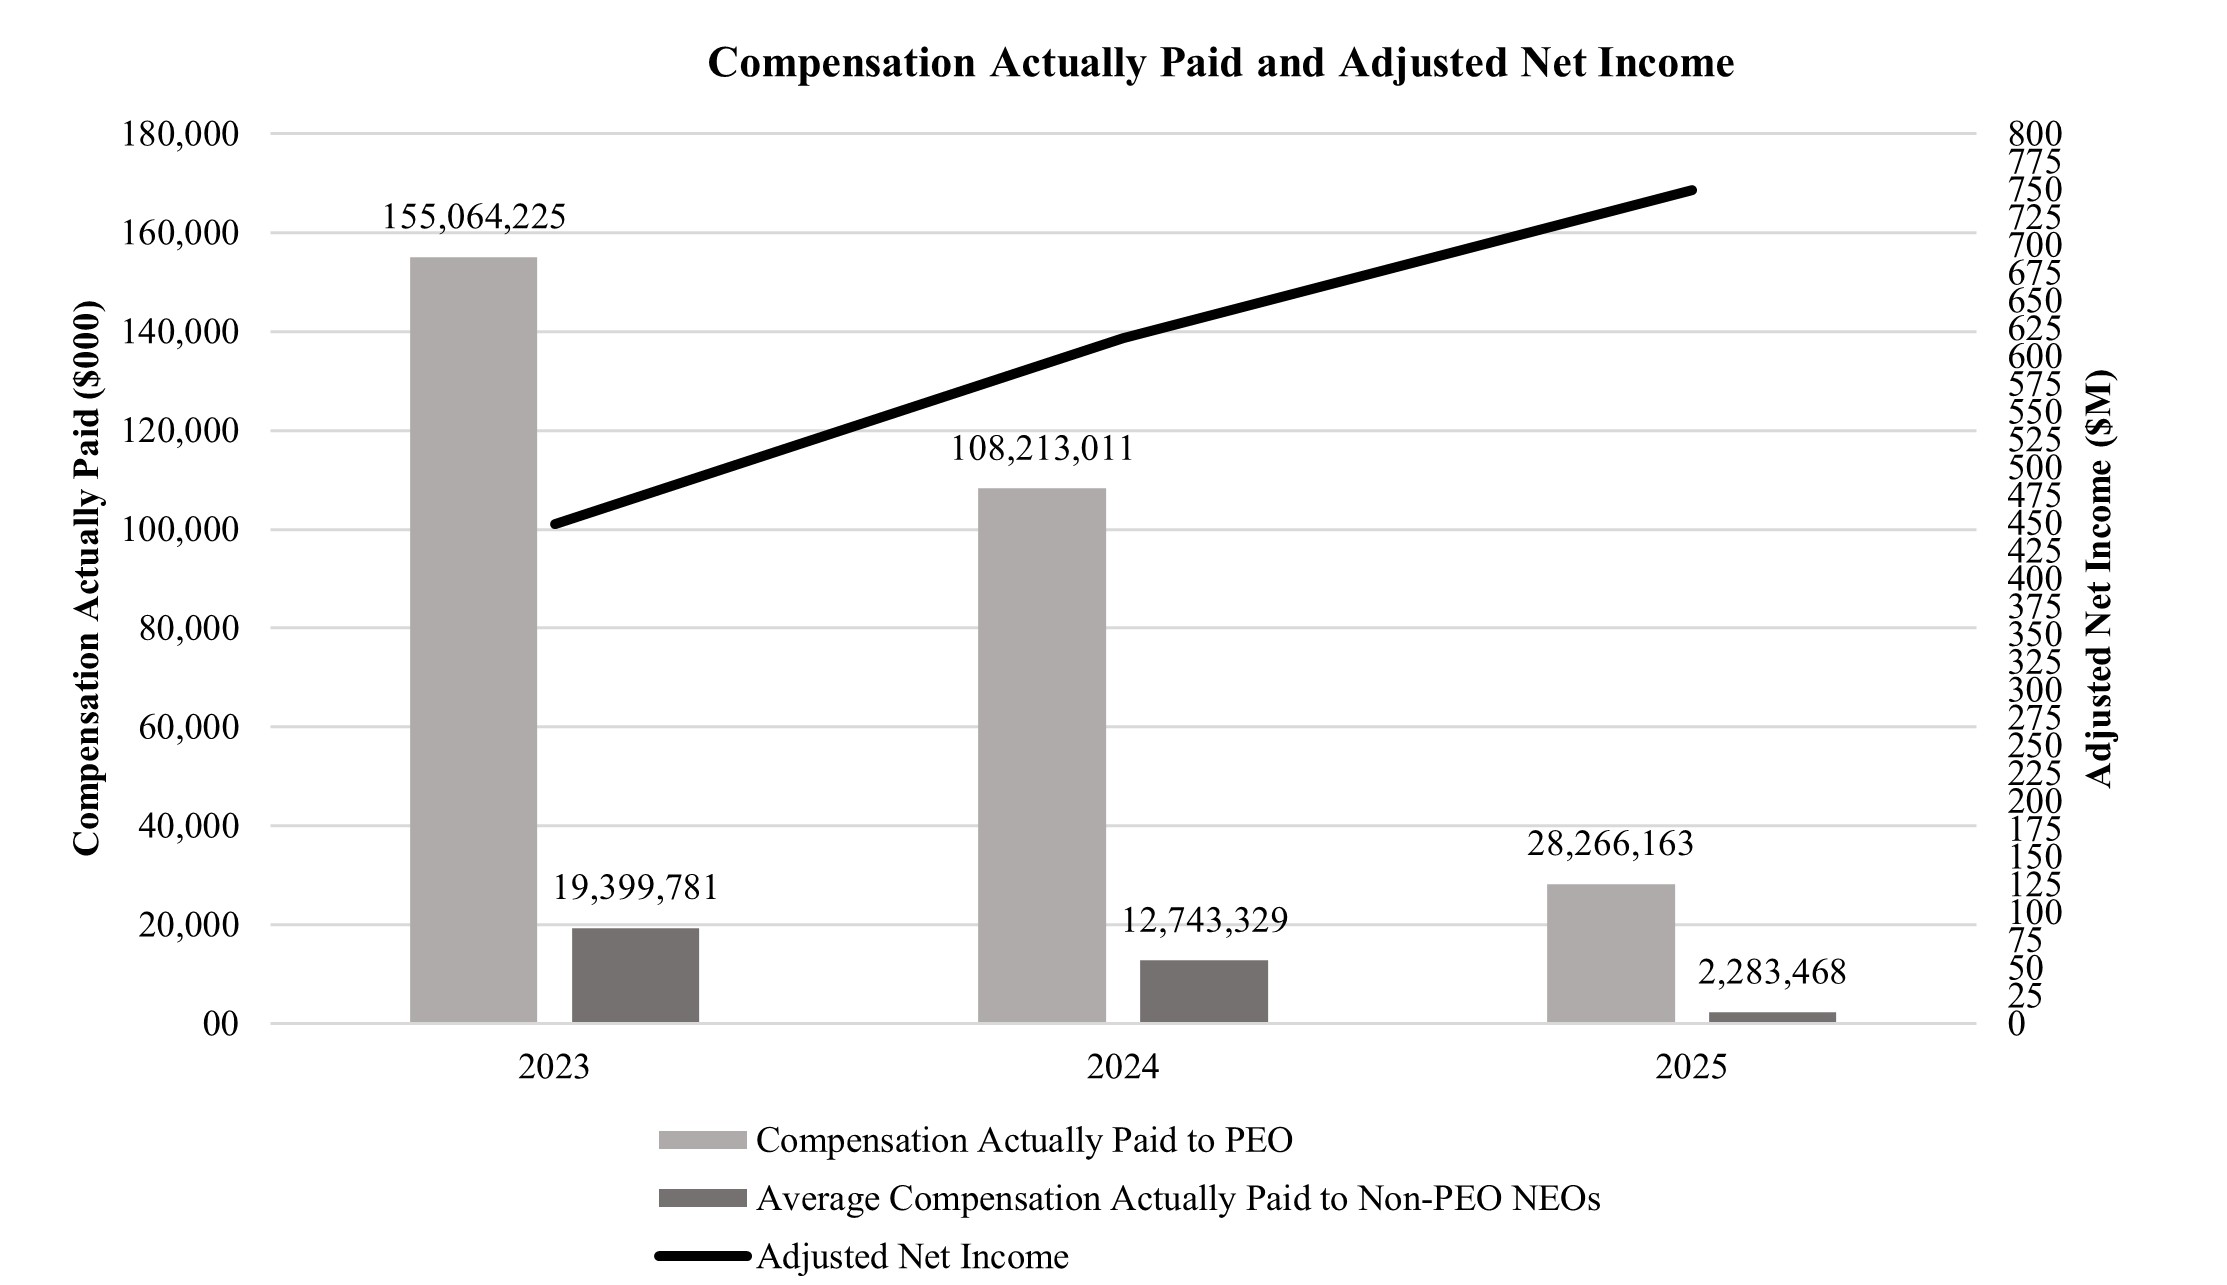
| Compensation Actually Paid vs. Company Selected Measure |
The following graph illustrates the relationship between Compensation Actually Paid for the PEO and average non-PEO NEO and the Company’s Adjusted Net Income for the fiscal years ended December 31, 2025, 2024, and 2023.
|
|
|
| Total Shareholder Return Vs Peer Group |
The following graph illustrates the relationship between Compensation Actually Paid for the PEO and average non-PEO NEO and the Total Shareholder Return of SharkNinja and the S&P 500 Consumer Discretionary Index for the fiscal years ended December 31, 2025, 2024, and 2023.
|
|
|
| Tabular List, Table |
The most important financial performance measures used by the Company to link executive compensation actually paid to the Company’s NEOs, for the most recently completed fiscal year, to the Company’s performance are as follows: | | | | Key Financial Performance Measures | | Adj. Net Income | | Adj. Net Sales | | Adj. Net Operating Cash Inflows |
|
|
|
| Total Shareholder Return Amount |
$ 271
|
236
|
124
|
| Peer Group Total Shareholder Return Amount |
142
|
134
|
104
|
| Net Income (Loss) |
$ 701,400,000
|
$ 438,700,000
|
$ 167,100,000
|
| Company Selected Measure Amount |
749,600,000
|
616,200,000
|
449,300,000
|
| PEO Name |
Officer, Mark Barrocas
|
Officer, Mark Barrocas
|
Officer, Mark Barrocas
|
| Additional 402(v) Disclosure |
Total Shareholder Return (“TSR”) is calculated by dividing (a) the sum of (i) the cumulative amount of dividends for the measurement period, assuming dividend reinvestment, and (ii) the difference between the Company’s share price at the end of each fiscal year shown and the beginning of the measurement period, and the beginning of the measurement period by (b) the Company’s share price at the beginning of the measurement period. The beginning of the measurement period for each year in the table is July 31, 2023.Represents the amount of Net Income reflected in the Company’s audited financial statements for the applicable year. (6)Adjusted Net Income is a non-GAAP measure. See Annex A for a reconciliation of Adjusted Net Income to the most directly comparable GAAP financial measure. (7)Upon the U.S. listing, Mr. Barrocas received greater compensation than in typical years for his service as PEO because of compensation arrangements entered into in connection with the U.S. listing and in recognition of his status as CEO. Other NEOs also received greater compensation than in typical years for their service as NEOs because of compensation arrangements entered into in connection with the U.S. listing.
|
|
|
| Measure:: 1 |
|
|
|
| Pay vs Performance Disclosure |
|
|
|
| Name |
Adj. Net Income
|
|
|
| Non-GAAP Measure Description |
Adjusted Net Income is a non-GAAP measure. See Annex A for a reconciliation of Adjusted Net Income to the most directly comparable GAAP financial measure.
|
|
|
| Measure:: 2 |
|
|
|
| Pay vs Performance Disclosure |
|
|
|
| Name |
Adj. Net Sales
|
|
|
| Measure:: 3 |
|
|
|
| Pay vs Performance Disclosure |
|
|
|
| Name |
Adj. Net Operating Cash Inflows
|
|
|
| PEO | Aggregate Change in Present Value of Accumulated Benefit for All Pension Plans Reported in Summary Compensation Table |
|
|
|
| Pay vs Performance Disclosure |
|
|
|
| Adjustment to Compensation, Amount |
$ 0
|
$ 0
|
$ 0
|
| PEO | Aggregate Grant Date Fair Value of Equity Award Amounts Reported in Summary Compensation Table |
|
|
|
| Pay vs Performance Disclosure |
|
|
|
| Adjustment to Compensation, Amount |
0
|
(21,498,702)
|
(64,894,074)
|
| PEO | Year-end Fair Value of Equity Awards Granted in Covered Year that are Outstanding and Unvested |
|
|
|
| Pay vs Performance Disclosure |
|
|
|
| Adjustment to Compensation, Amount |
0
|
0
|
107,726,037
|
| PEO | Year-over-Year Change in Fair Value of Equity Awards Granted in Prior Years That are Outstanding and Unvested |
|
|
|
| Pay vs Performance Disclosure |
|
|
|
| Adjustment to Compensation, Amount |
6,803,397
|
43,225,433
|
0
|
| PEO | Change in Fair Value as of Vesting Date of Prior Year Equity Awards Vested in Covered Year |
|
|
|
| Pay vs Performance Disclosure |
|
|
|
| Adjustment to Compensation, Amount |
3,616,937
|
53,017,003
|
6,870,287
|
| PEO | Dividends or Other Earnings Paid on Equity Awards not Otherwise Reflected in Total Compensation for Covered Year |
|
|
|
| Pay vs Performance Disclosure |
|
|
|
| Adjustment to Compensation, Amount |
0
|
0
|
0
|
| Non-PEO NEO | Aggregate Change in Present Value of Accumulated Benefit for All Pension Plans Reported in Summary Compensation Table |
|
|
|
| Pay vs Performance Disclosure |
|
|
|
| Adjustment to Compensation, Amount |
0
|
0
|
0
|
| Non-PEO NEO | Aggregate Grant Date Fair Value of Equity Award Amounts Reported in Summary Compensation Table |
|
|
|
| Pay vs Performance Disclosure |
|
|
|
| Adjustment to Compensation, Amount |
(134,338)
|
(2,774,587)
|
(6,681,341)
|
| Non-PEO NEO | Year-end Fair Value of Equity Awards Granted in Covered Year that are Outstanding and Unvested |
|
|
|
| Pay vs Performance Disclosure |
|
|
|
| Adjustment to Compensation, Amount |
122,083
|
2,072,275
|
11,978,997
|
| Non-PEO NEO | Year-over-Year Change in Fair Value of Equity Awards Granted in Prior Years That are Outstanding and Unvested |
|
|
|
| Pay vs Performance Disclosure |
|
|
|
| Adjustment to Compensation, Amount |
(330,075)
|
3,592,196
|
0
|
| Non-PEO NEO | Change in Fair Value as of Vesting Date of Prior Year Equity Awards Vested in Covered Year |
|
|
|
| Pay vs Performance Disclosure |
|
|
|
| Adjustment to Compensation, Amount |
309,208
|
3,356,721
|
0
|
| Non-PEO NEO | Dividends or Other Earnings Paid on Equity Awards not Otherwise Reflected in Total Compensation for Covered Year |
|
|
|
| Pay vs Performance Disclosure |
|
|
|
| Adjustment to Compensation, Amount |
$ 0
|
$ 0
|
$ 0
|