Pay vs Performance Disclosure - USD ($)
Dec. 31, 2025
Dec. 31, 2024
Dec. 31, 2023
Item 402(v) Pay Versus Performance
The disclosure included in this section is prescribed by SEC rules and does not necessarily align with how the Company or the Compensation Committee view the link between the Company’s performance and named executive officer (“NEO”) pay.
Required Tabular Disclosure of Pay Versus Performance
The amounts in the table set forth below under the headings “Compensation Actually Paid to PEO” and “Average Compensation Actually Paid to Non-PEO NEOs” have been calculated in a manner consistent with Item 402(v) of Regulation S-K. Use of the term “compensation actually paid” (“CAP”) is required by the SEC’s rules and as a result of the calculation methodology required by the SEC, such amounts differ from compensation actually received by the individuals and the compensation decisions described in the Executive Compensation.
Value of Initial Fixed $100 Investment Based on: | ||||||||||||||||||
Year | Summary Compensation Table Total for PEO ($)(1)(2) | Compensation Actually Paid to PEO ($)(1)(3) | Average Summary Compensation Table Total for Non-PEO NEOs ($)(1)(2) | Average Compensation Actually Paid to Non-PEO NEOs ($)(1)(3) | Total Shareholder Return ($)(4) | Net Income (Loss) ($ Million)(5) | ||||||||||||
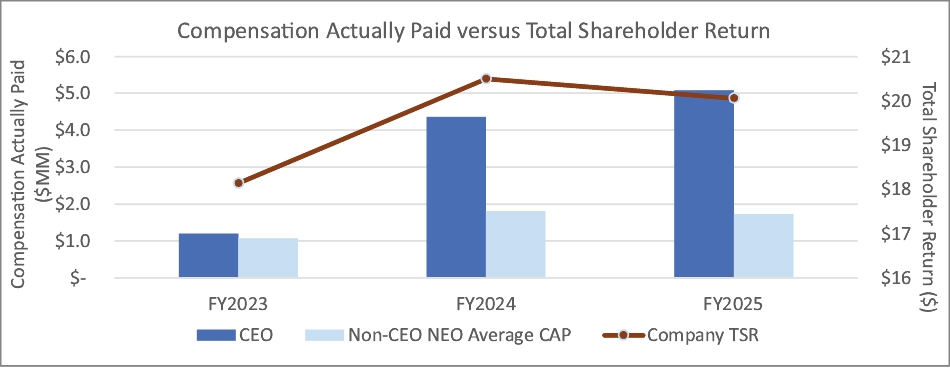
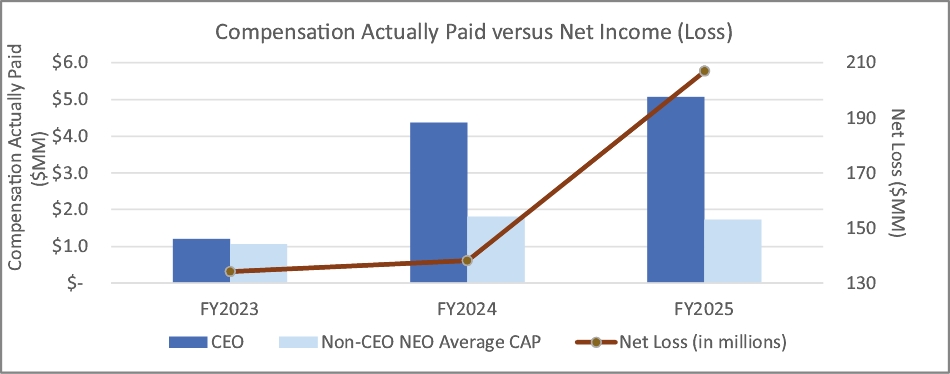
2025 | 3,579,202 | 5,078,233 | 1,360,163 | 1,725,415 | 20.06 | (206.7) | ||||||||||||
2024 | 3,672,746 | 4,367,052 | 1,564,076 | 1,812,051 | 20.50 | (138.2) | ||||||||||||
2023 | 2,453,184 | 1,202,088 | 1,484,344 | 1,064,962 | 18.14 | (134.2) | ||||||||||||
(1) | The following individuals are our PEO and other non-PEO NEOs for each fiscal year: |
Year | PEO | Non-PEO NEOs | ||||
2025 | Douglas Love | Ted Yednock and Jennifer Lew | ||||
2024 | Douglas Love | Jamie Dananberg and Ted Yednock | ||||
2023 | Douglas Love | Ted Yednock and Rick Artis | ||||
(2) | Represents the amount of total compensation reported for Douglas Love (our Chief Executive Officer) and the average total compensation for our non-PEO NEOs for each corresponding year in the “Total” column of the Summary Compensation Table. Refer to “Executive Compensation-Summary Compensation Table.” |
(3) | Represents the amount of CAP to Douglas Love and the average amount of CAP to our Non-PEO NEOs, respectively, as computed in accordance with Item 402(v) of Regulation S-K. The dollar amounts do not reflect the actual amount of compensation earned by or paid to our NEOs during the applicable year. In accordance with the requirements of Item 402(v) of Regulation S-K, the following adjustments were made to the reported total compensation for each year to determine the CAP: |
2023 | 2024 | 2025 | ||||||||||||||||
PEO | Average Non- PEO NEOs | PEO | Average Non- PEO NEOs | PEO | Average Non- PEO NEOs | |||||||||||||
Total Compensation as reported on the 2025 Summary Compensation Table (“SCT”) | 2,453,184 | 1,484,344 | 3,672,746 | 1,564,076 | 3,579,202 | 1,360,163 | ||||||||||||
Less: Grant Date Fair Value of Equity Awards as reported in SCT(a) | (1,473,062) | (736,774) | (2,661,939) | (849,126) | (2,522,260) | (641,258) | ||||||||||||
Add: Year-End Fair Value of unvested Equity Awards Granted in the Year(b) | 846,371 | 450,472 | 2,075,305 | 706,089 | 4,397,157 | 1,179,940 | ||||||||||||
Add: Vesting date Fair Value of Awards Granted during the Year vested during the Year(b) | 166,151 | 18,553 | 666,310 | 162,463 | 609,909 | 127,883 | ||||||||||||
Add/(less): Year over Year Change in Fair Value of Outstanding and Unvested Equity Awards as of Year End(b) | (412,800) | (76,252) | 201,334 | 85,217 | (171,029) | (44,855) | ||||||||||||
Add/(less): Year over Year Change in Fair Value of Equity Awards Granted in Prior Year vested in the Year(b) | (377,757) | (75,382) | 413,296 | 143,332 | (814,746) | (256,458) | ||||||||||||
Add: Change in Fair Value of Awards Granted during Prior Year that were Forfeited during the Year as of Prior Year End | — | — | — | — | — | — | ||||||||||||
2023 | 2024 | 2025 | ||||||||||||||||
PEO | Average Non- PEO NEOs | PEO | Average Non- PEO NEOs | PEO | Average Non- PEO NEOs | |||||||||||||
Add: Change in Fair Value of Option awards or Stock Awards modified during the Year | — | — | — | — | — | — | ||||||||||||
Total Adjustments | (1,251,096) | (419,382) | 694,306 | 247,975 | 1,499,031 | 365,252 | ||||||||||||
Compensation Actually Paid | 1,202,088 | 1,064,962 | 4,367,052 | 1,812,051 | 5,078,233 | 1,725,415 | ||||||||||||
(a) | The amounts reflect the aggregate grant-date fair value reported in the “Stock Awards” and “Option Awards” columns in the Summary Compensation Table for the applicable fiscal year. |
(b) | The fair values of stock options included in the CAP to our PEO and the Average CAP to our NEOs are calculated at the required measurement dates, consistent with the approach used to value the awards at the grant date as described in our Annual Report on Form 10-K for the year ended December 31, 2025. Changes to the stock option fair values are based on the updated stock price at the respective measurement dates, in addition to updated expected option term, implied volatility of our stock over the updated expected option term, and risk-free rate assumptions. For all years presented, the meaningful increases or decreases in the year-end stock option fair value from the fair value on the grant date were primarily driven by changes in the stock price. |
(4) | The amounts reflect the cumulative total shareholder return of our common stock at the end of each fiscal year. In each case, assume an initial investment of $100 on December 31, 2022. |
(5) | The dollar amounts reported represent the net income reflected in the Company’s audited financial statements for the applicable year. |
(1) | The following individuals are our PEO and other non-PEO NEOs for each fiscal year: |
Year | PEO | Non-PEO NEOs | ||||
2025 | Douglas Love | Ted Yednock and Jennifer Lew | ||||
2024 | Douglas Love | Jamie Dananberg and Ted Yednock | ||||
2023 | Douglas Love | Ted Yednock and Rick Artis | ||||
(3) | Represents the amount of CAP to Douglas Love and the average amount of CAP to our Non-PEO NEOs, respectively, as computed in accordance with Item 402(v) of Regulation S-K. The dollar amounts do not reflect the actual amount of compensation earned by or paid to our NEOs during the applicable year. In accordance with the requirements of Item 402(v) of Regulation S-K, the following adjustments were made to the reported total compensation for each year to determine the CAP: |
2023 | 2024 | 2025 | ||||||||||||||||
PEO | Average Non- PEO NEOs | PEO | Average Non- PEO NEOs | PEO | Average Non- PEO NEOs | |||||||||||||
Total Compensation as reported on the 2025 Summary Compensation Table (“SCT”) | 2,453,184 | 1,484,344 | 3,672,746 | 1,564,076 | 3,579,202 | 1,360,163 | ||||||||||||
Less: Grant Date Fair Value of Equity Awards as reported in SCT(a) | (1,473,062) | (736,774) | (2,661,939) | (849,126) | (2,522,260) | (641,258) | ||||||||||||
Add: Year-End Fair Value of unvested Equity Awards Granted in the Year(b) | 846,371 | 450,472 | 2,075,305 | 706,089 | 4,397,157 | 1,179,940 | ||||||||||||
Add: Vesting date Fair Value of Awards Granted during the Year vested during the Year(b) | 166,151 | 18,553 | 666,310 | 162,463 | 609,909 | 127,883 | ||||||||||||
Add/(less): Year over Year Change in Fair Value of Outstanding and Unvested Equity Awards as of Year End(b) | (412,800) | (76,252) | 201,334 | 85,217 | (171,029) | (44,855) | ||||||||||||
Add/(less): Year over Year Change in Fair Value of Equity Awards Granted in Prior Year vested in the Year(b) | (377,757) | (75,382) | 413,296 | 143,332 | (814,746) | (256,458) | ||||||||||||
Add: Change in Fair Value of Awards Granted during Prior Year that were Forfeited during the Year as of Prior Year End | — | — | — | — | — | — | ||||||||||||
2023 | 2024 | 2025 | ||||||||||||||||
PEO | Average Non- PEO NEOs | PEO | Average Non- PEO NEOs | PEO | Average Non- PEO NEOs | |||||||||||||
Add: Change in Fair Value of Option awards or Stock Awards modified during the Year | — | — | — | — | — | — | ||||||||||||
Total Adjustments | (1,251,096) | (419,382) | 694,306 | 247,975 | 1,499,031 | 365,252 | ||||||||||||
Compensation Actually Paid | 1,202,088 | 1,064,962 | 4,367,052 | 1,812,051 | 5,078,233 | 1,725,415 | ||||||||||||
(a) | The amounts reflect the aggregate grant-date fair value reported in the “Stock Awards” and “Option Awards” columns in the Summary Compensation Table for the applicable fiscal year. |
(b) | The fair values of stock options included in the CAP to our PEO and the Average CAP to our NEOs are calculated at the required measurement dates, consistent with the approach used to value the awards at the grant date as described in our Annual Report on Form 10-K for the year ended December 31, 2025. Changes to the stock option fair values are based on the updated stock price at the respective measurement dates, in addition to updated expected option term, implied volatility of our stock over the updated expected option term, and risk-free rate assumptions. For all years presented, the meaningful increases or decreases in the year-end stock option fair value from the fair value on the grant date were primarily driven by changes in the stock price. |