
Exhibit 99.2 2 65 86 246 198 47 237 155 33 NASDAQ GLOBAL: NWFL 66 145 185 147 97 81 209 218 221 241 Q1 2026 Earnings Presentation 231 217 245 156 170 40 171 117 229 87 96 149 A P R I L 2 7 , 2 0 2 6 92 148 Additional Colors
Forward -looking Statements and Additional Information 2 65 86 246 This presentation contains forward-looking statements within the meaning of the federal securities laws that are made by Norwood Financial Corp (“Norwood”). All statements other than statements of historical 198 fact are statements that could be deemed forward-looking statements, including all statements regarding the intent, belief or current expectations of Norwood and members of its board of directors and senior 47 management teams. Investors and security holders are cautioned that such statements are predictions, and are not guarantees of future performance. Actual events or results may differ materially. Expected financial results or other plans are subject to a number of known and unknown risks, uncertainties and assumptions that are difficult to assess and are subject to change based on factors which are, in many 237 instances, beyond Norwood’s control. 155 Additional risks and uncertainties may include, but are not limited to, the risk that expected cost savings, revenue synergies and other financial benefits from the recently completed merger with PB Bankshares, 33 Inc. (“PB Bankshares”) may not be realized or take longer than expected to realize; the merger may be more expensive to complete than anticipated, including as a result of unexpected factors or events; the integration of PB Bankshares’ business and operations with those of Norwood may take longer than anticipated, may be more costly than anticipated and may have unanticipated adverse results relating to 66 Norwood’s existing businesses; the anticipated cost savings and other synergies of the merger may take longer to be realized or may not be achieved in their entirety, and attrition in key client, partner and other 145 relationships relating to the merger may be greater than expected; the ability to achieve anticipated merger-related operational efficiencies; the ability to enhance revenue through increased market penetration, 185 expanded lending capacity and product offerings; changes in monetary and fiscal policies of the Federal Reserve Board and the U. S. Government, particularly related to changes in interest rates; changes in general economic conditions, especially the effects of current fluctuations in tariff policies, impacts of workforce deportations, the proliferation of legal actions challenging government policies, and substantial 147 reductions in force of government and non-government organization employees, all of which may put pressure on supply chains and exacerbate market volatility; occurrence of natural or man-made disasters or 97 calamities, including health emergencies, the spread of infectious diseases, pandemics or outbreaks of hostilities, or the effects of climate change, and the ability of Norwood and its customers to deal effectively 81 with disruptions caused by the foregoing; legislative or regulatory changes; downturn in demand for loan, deposit and other financial services in our market area; increased competition from other banks and non- bank providers of financial services; technological changes and increased technology-related costs; and changes in accounting principles, or the application of generally accepted accounting principles. 209 218 Due to these and other possible uncertainties and risks, Norwood can give no assurance that the results contemplated in the forward-looking statements will be realized, and readers are cautioned not to place 221 undue reliance on the forward-looking statements contained in this presentation. Forward-looking statements are based on information currently available to Norwood, and Norwood assumes no obligation and disclaim any intent to update any such forward-looking statements. All forward-looking statements, express or implied, included in the presentation are qualified in their entirety by this cautionary statement. 241 NON-GAAP FINANCIAL MEASURES 231 217 In addition to results presented in accordance with GAAP, this presentation includes certain non-GAAP financial measures. Norwood believes these non-GAAP financial measures provide additional information that is useful to investors in helping to understand underlying financial performance and condition and trends of Norwood. 245 Non-GAAP financial measures have inherent limitations. Readers should be aware of these limitations and should be cautious with respect to the use of such measures. To compensate for these limitations, non- 156 GAAP measures are used as comparative tools, together with GAAP measures, to assist in the evaluation of operating performance or financial condition. These measures are also calculated using the appropriate 170 GAAP or regulatory components in their entirety and are computed in a manner intended to facilitate consistent period-to-period comparisons. Norwood’s method of calculating these non-GAAP measures may differ from methods used by other companies. These non-GAAP measures should not be considered in isolation or as a substitute or an alternative for those financial measures prepared in accordance with GAAP 40 or in-effect regulatory requirements. Numbers in this presentation may not sum due to rounding. 171 Where non-GAAP financial measures are used, the most directly comparable GAAP or regulatory financial measure, as well as the reconciliation to the most directly comparable GAAP or regulatory financial 117 measure, can be found in this presentation. 229 87 96 149 92 N O R W O O D F I N A N C I A L C O R P 148 N A S D A Q G L O B A L : N W F L Additional Colors
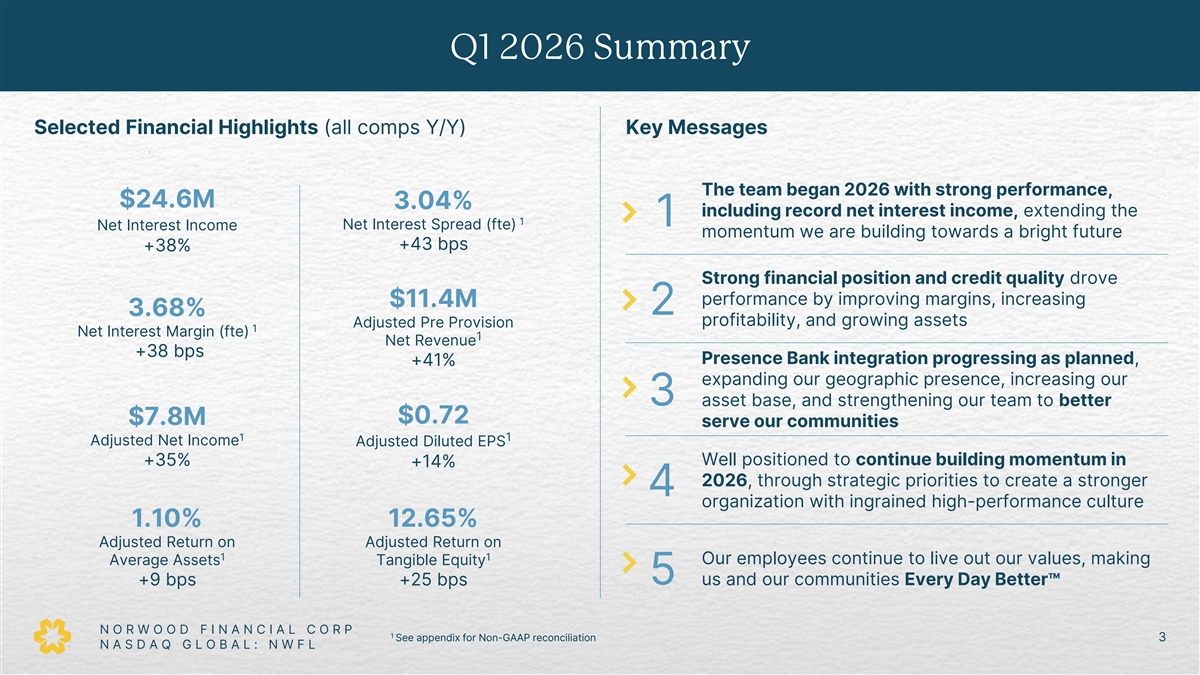
Q1 2026 Summary 2 65 86 246 Selected Financial Highlights (all comps Y/Y) Key Messages 198 47 237 155 The team began 2026 with strong performance, 33 $24.6M 3.04% including record net interest income, extending the 1 1 Net Interest Income Net Interest Spread (fte) 66 momentum we are building towards a bright future 145 +43 bps +38% 185 Strong financial position and credit quality drove 147 97 performance by improving margins, increasing $11.4M 81 2 3.68% profitability, and growing assets Adjusted Pre Provision 1 Net Interest Margin (fte) 1 209 Net Revenue 218 +38 bps Presence Bank integration progressing as planned, +41% 221 expanding our geographic presence, increasing our 241 3 asset base, and strengthening our team to better 231 217 $0.72 $7.8M serve our communities 1 1 Adjusted Net Income Adjusted Diluted EPS 245 Well positioned to continue building momentum in +35% +14% 156 170 2026, through strategic priorities to create a stronger 4 organization with ingrained high-performance culture 40 171 1.10% 12.65% 117 Adjusted Return on Adjusted Return on 1 1 229 Average Assets Tangible Equity Our employees continue to live out our values, making 87 5 us and our communities Every Day Better +9 bps +25 bps 96 149 92 N O R W O O D F I N A N C I A L C O R P 1 See appendix for Non-GAAP reconciliation 3 148 N A S D A Q G L O B A L : N W F L Additional Colors
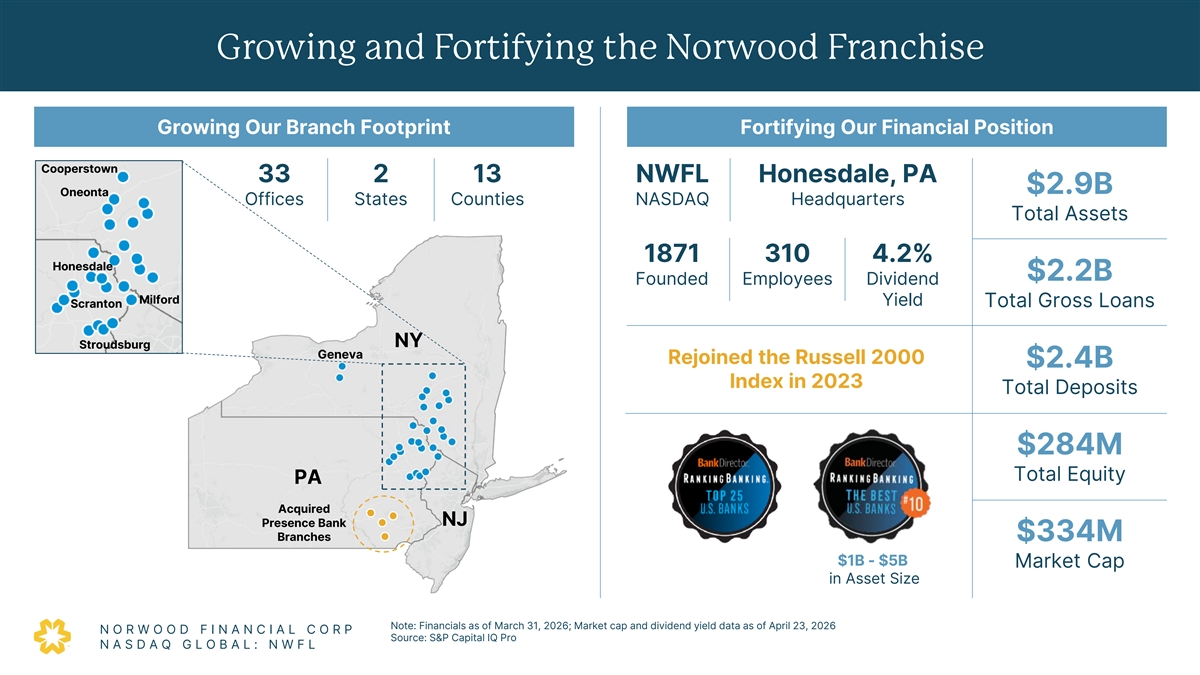
Growing and Fortifying the Norwood Franchise 2 65 86 246 Growing Our Branch Footprint Fortifying Our Financial Position 198 47 Cooperstown 237 33 2 13 NWFL Honesdale, PA 155 $2.9B Oneonta Offices States Counties NASDAQ Headquarters 33 Total Assets 66 145 185 1871 310 4.2% Honesdale $2.2B Founded Employees Dividend 147 97 Milford Yield Scranton Total Gross Loans 81 209 NY Stroudsburg 218 Geneva Rejoined the Russell 2000 $2.4B 221 Index in 2023 Total Deposits 241 231 217 $284M 245 156 Total Equity 170 PA 40 Acquired 171 NJ Presence Bank 117 Branches $334M 229 $1B - $5B Market Cap 87 in Asset Size 96 149 Note: Financials as of March 31, 2026; Market cap and dividend yield data as of April 23, 2026 92 N O R W O O D F I N A N C I A L C O R P Source: S&P Capital IQ Pro 148 N A S D A Q G L O B A L : N W F L Additional Colors
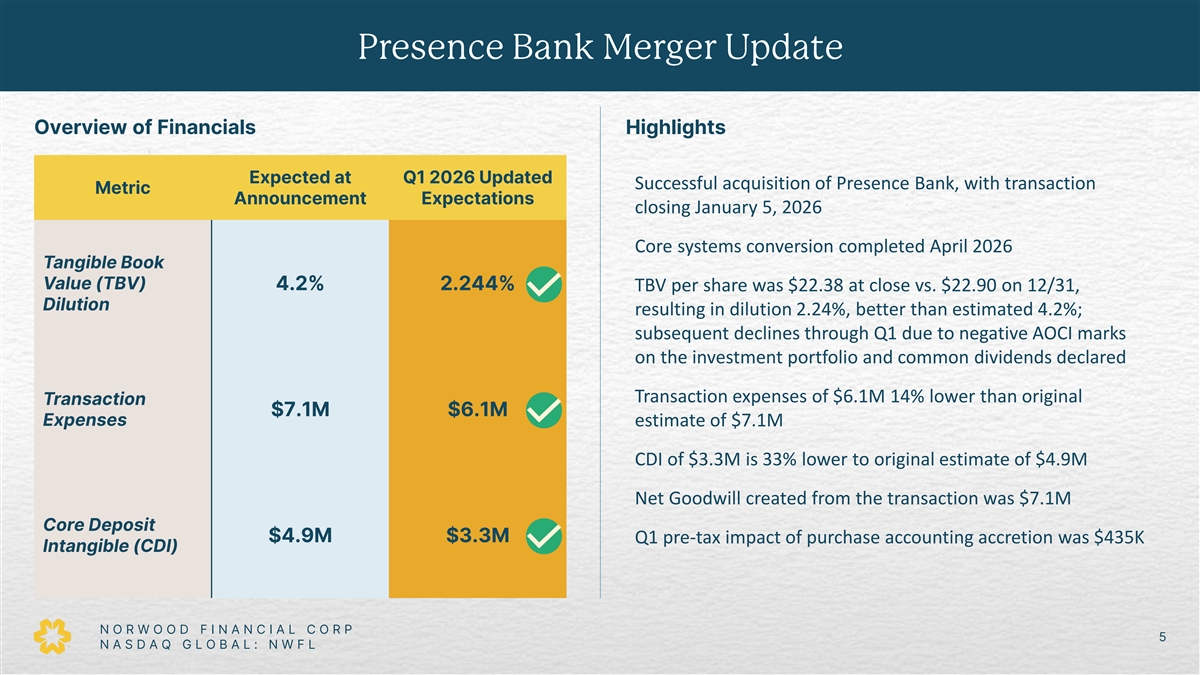
Presence Bank Merger Update 2 65 86 246 Overview of Financials Highlights 198 47 237 Expected at Q1 2026 Updated Successful acquisition of Presence Bank, with transaction 155 Metric Announcement Expectations 33 closing January 5, 2026 66 145 Core systems conversion completed April 2026 185 Tangible Book 147 Value (TBV) 4.2% 2.244% TBV per share was $22.38 at close vs. $22.90 on 12/31, 97 Dilution 81 resulting in dilution 2.24%, better than estimated 4.2%; subsequent declines through Q1 due to negative AOCI marks 209 218 on the investment portfolio and common dividends declared 221 241 Transaction expenses of $6.1M 14% lower than original Transaction 231 $7.1M $6.1M 217 Expenses estimate of $7.1M 245 CDI of $3.3M is 33% lower to original estimate of $4.9M 156 170 Net Goodwill created from the transaction was $7.1M 40 171 Core Deposit 117 $4.9M $3.3M Q1 pre-tax impact of purchase accounting accretion was $435K Intangible (CDI) 229 87 96 149 92 N O R W O O D F I N A N C I A L C O R P 5 148 N A S D A Q G L O B A L : N W F L Additional Colors
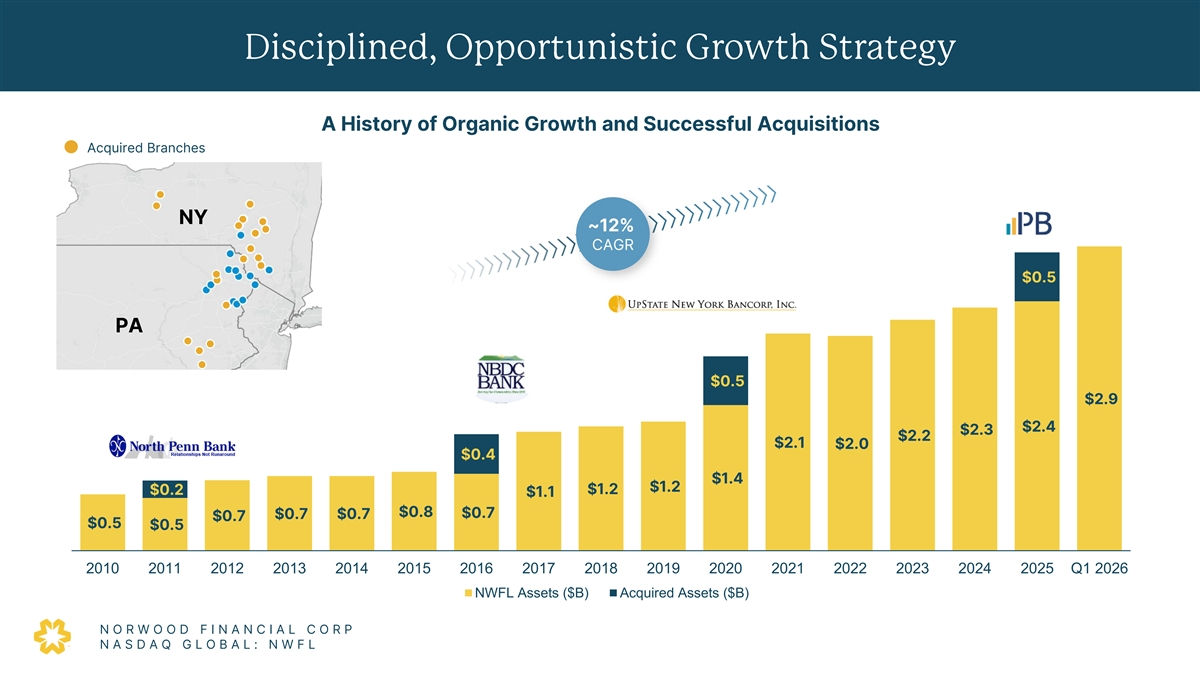
Disciplined, Opportunistic Growth Strategy 2 65 86 246 A History of Organic Growth and Successful Acquisitions 198 Acquired Branches 47 237 155 33 NY ~12% 66 145 CAGR 185 $0.5 147 97 81 PA 209 218 221 $0.5 241 $2.9 231 217 $2.4 $2.3 $2.2 $2.1 $2.0 245 $0.4 156 170 $1.4 $1.2 $1.2 $0.2 $1.1 40 $0.8 $0.7 $0.7 $0.7 $0.7 171 $0.5 $0.5 117 229 2010 2011 2012 2013 2014 2015 2016 2017 2018 2019 2020 2021 2022 2023 2024 2025 Q1 2026 87 96 NWFL Assets ($B) Acquired Assets ($B) 149 92 N O R W O O D F I N A N C I A L C O R P 148 N A S D A Q G L O B A L : N W F L Additional Colors
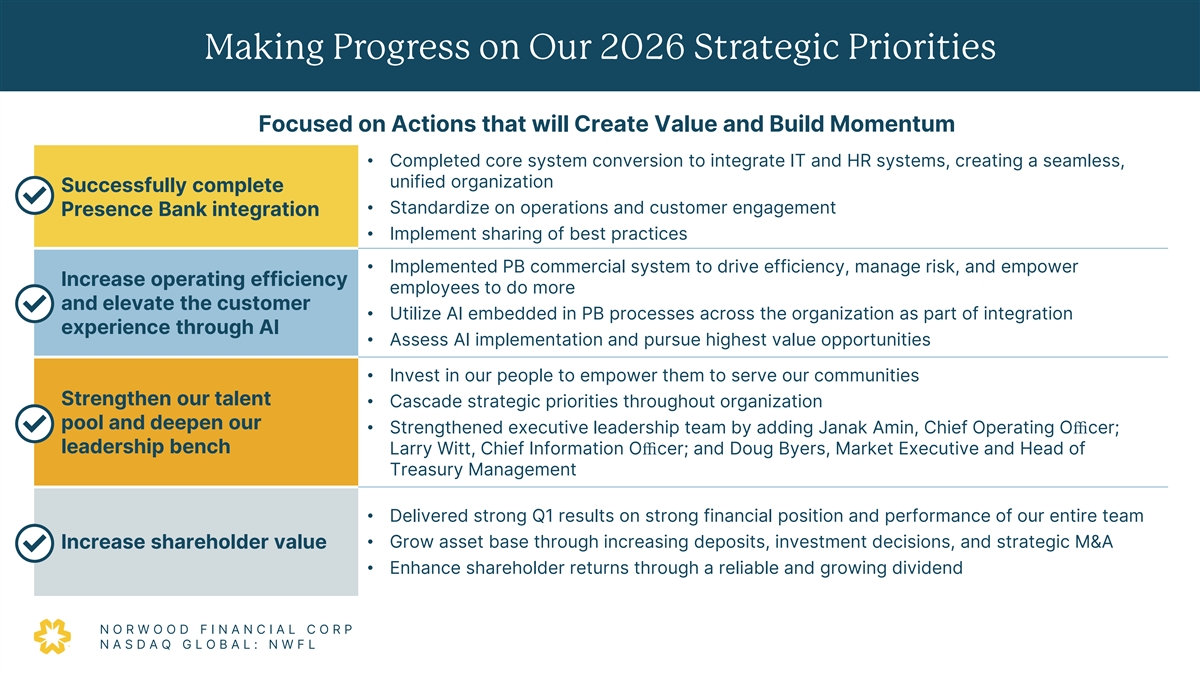
Making Progress on Our 2026 Strategic Priorities 2 65 86 246 Focused on Actions that will Create Value and Build Momentum 198 47 • Completed core system conversion to integrate IT and HR systems, creating a seamless, 237 unified organization Successfully complete 155 33 • Standardize on operations and customer engagement Presence Bank integration 66 • Implement sharing of best practices 145 185 • Implemented PB commercial system to drive efficiency, manage risk, and empower Increase operating efficiency 147 employees to do more 97 and elevate the customer 81 • Utilize AI embedded in PB processes across the organization as part of integration experience through AI 209 • Assess AI implementation and pursue highest value opportunities 218 221 • Invest in our people to empower them to serve our communities 241 Strengthen our talent • Cascade strategic priorities throughout organization 231 217 pool and deepen our • Strengthened executive leadership team by adding Janak Amin, Chief Operating Officer; leadership bench Larry Witt, Chief Information Officer; and Doug Byers, Market Executive and Head of 245 156 Treasury Management 170 40 • Delivered strong Q1 results on strong financial position and performance of our entire team 171 117 • Grow asset base through increasing deposits, investment decisions, and strategic M&A Increase shareholder value 229 • Enhance shareholder returns through a reliable and growing dividend 87 96 149 92 N O R W O O D F I N A N C I A L C O R P 148 N A S D A Q G L O B A L : N W F L Additional Colors
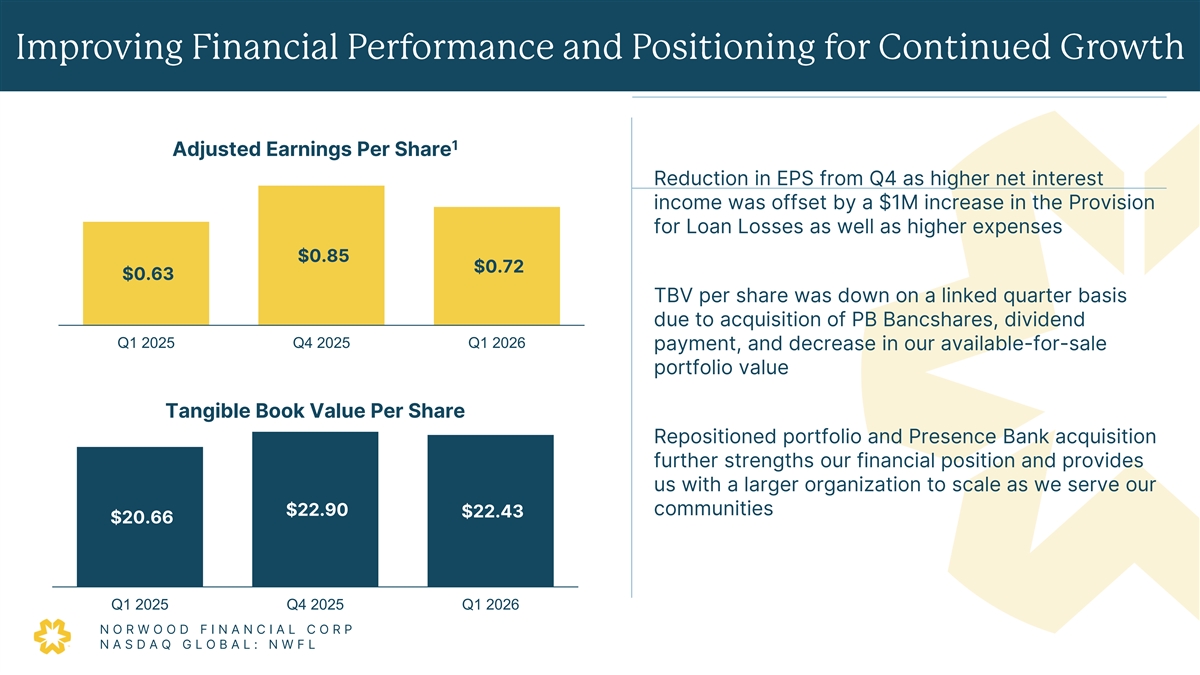
Improving Financial Performance and Positioning for Continued Growth 2 65 86 246 198 1 47 Adjusted Earnings Per Share 237 Reduction in EPS from Q4 as higher net interest 155 33 income was offset by a $1M increase in the Provision for Loan Losses as well as higher expenses 66 145 185 $0.85 $0.72 $0.63 147 97 TBV per share was down on a linked quarter basis 81 due to acquisition of PB Bancshares, dividend 209 Q1 2025 Q4 2025 Q1 2026 payment, and decrease in our available-for-sale 218 221 portfolio value 241 231 Tangible Book Value Per Share 217 Repositioned portfolio and Presence Bank acquisition 245 further strengths our financial position and provides 156 170 us with a larger organization to scale as we serve our 40 communities $22.90 $22.43 171 $20.66 117 229 87 96 Q1 2025 Q4 2025 Q1 2026 149 92 N O R W O O D F I N A N C I A L C O R P 148 N A S D A Q G L O B A L : N W F L 1) See appendix for Non-GAAP reconciliation Additional Colors
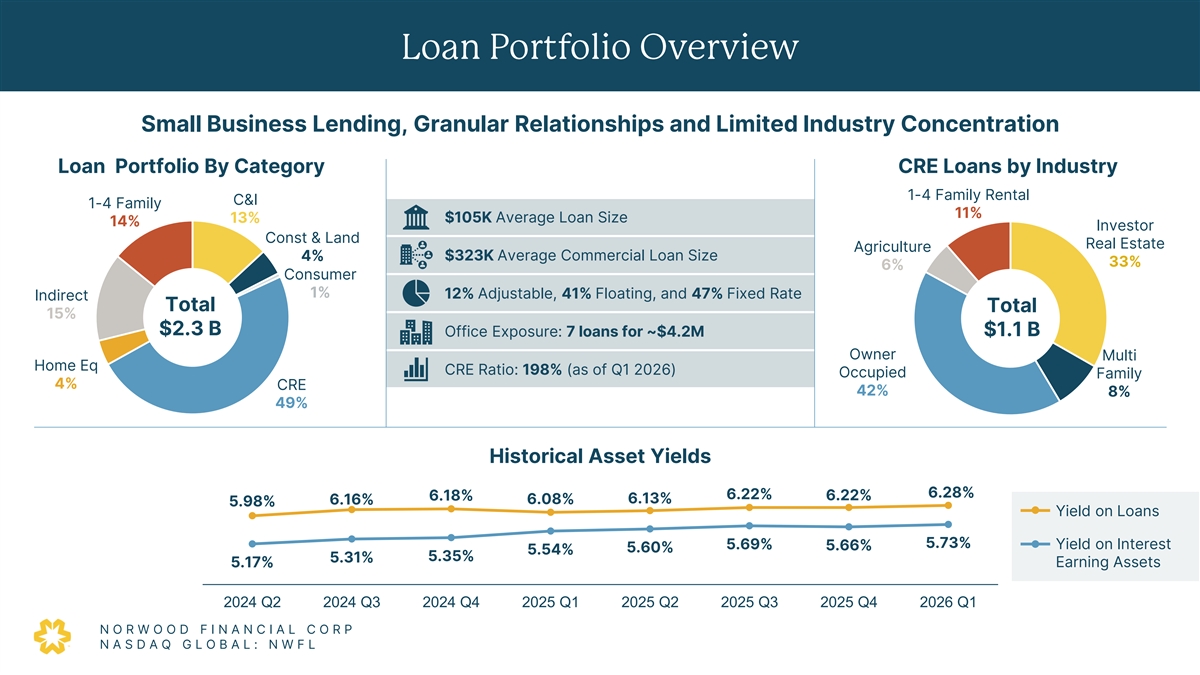
Loan Portfolio Overview 2 65 86 246 Small Business Lending, Granular Relationships and Limited Industry Concentration 198 47 Loan Portfolio By Category CRE Loans by Industry 237 155 1-4 Family Rental C&I 33 1-4 Family 11% 13% $105K Average Loan Size 14% Investor 66 Const & Land 145 Real Estate Agriculture 185 4% $323K Average Commercial Loan Size 33% 6% Consumer 147 1% 12% Adjustable, 41% Floating, and 47% Fixed Rate 97 Indirect Total Total 81 15% $2.3 B $1.1 B Office Exposure: 7 loans for ~$4.2M 209 218 Owner Multi 221 Home Eq CRE Ratio: 198% (as of Q1 2026) Occupied Family 4% CRE 241 42% 8% 231 49% 217 245 Historical Asset Yields 156 170 6.28% 6.22% 6.22% 6.18% 6.08% 6.13% 6.16% 5.98% 40 Yield on Loans 171 117 5.73% 5.69% 5.66% Yield on Interest 5.60% 5.54% 5.35% 5.31% 229 5.17% Earning Assets 87 96 2024 Q2 2024 Q3 2024 Q4 2025 Q1 2025 Q2 2025 Q3 2025 Q4 2026 Q1 149 92 N O R W O O D F I N A N C I A L C O R P 148 N A S D A Q G L O B A L : N W F L Additional Colors
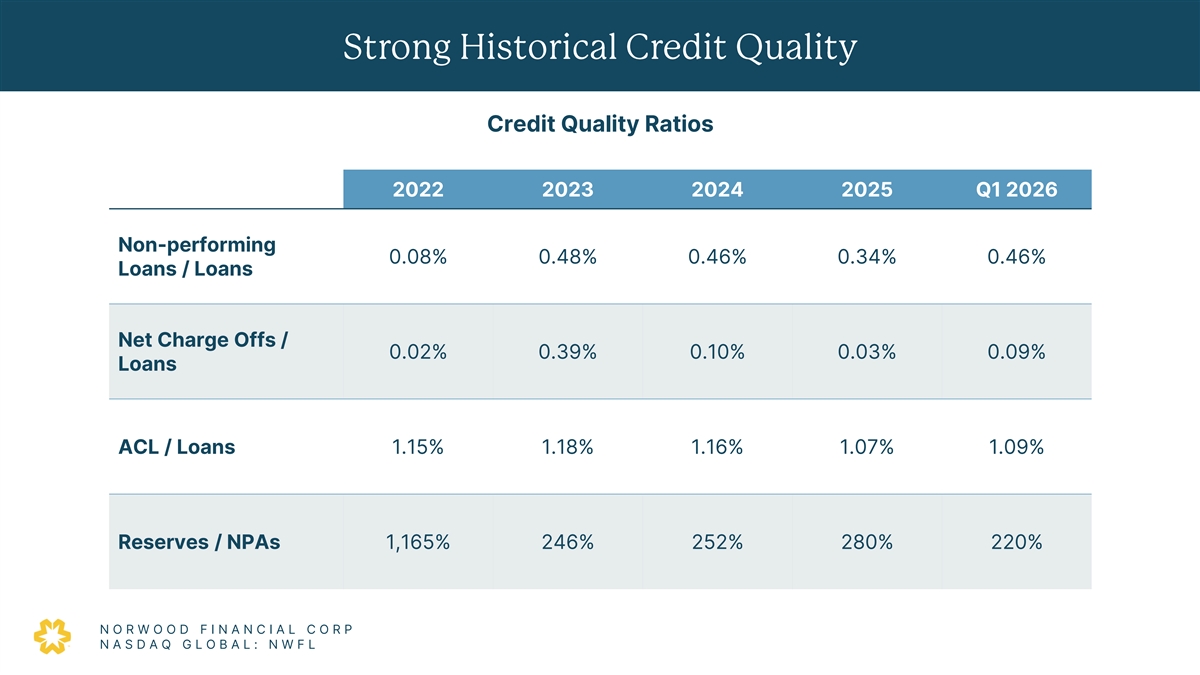
Strong Historical Credit Quality 2 65 86 246 Credit Quality Ratios 198 47 237 155 2022 2023 2024 2025 Q1 2026 33 66 145 Non-performing 185 0.08% 0.48% 0.46% 0.34% 0.46% Loans / Loans 147 97 81 209 Net Charge Offs / 218 0.02% 0.39% 0.10% 0.03% 0.09% 221 Loans 241 231 217 ACL / Loans 1.15% 1.18% 1.16% 1.07% 1.09% 245 156 170 40 171 117 Reserves / NPAs 1,165% 246% 252% 280% 220% 229 87 96 149 92 N O R W O O D F I N A N C I A L C O R P 148 N A S D A Q G L O B A L : N W F L Additional Colors
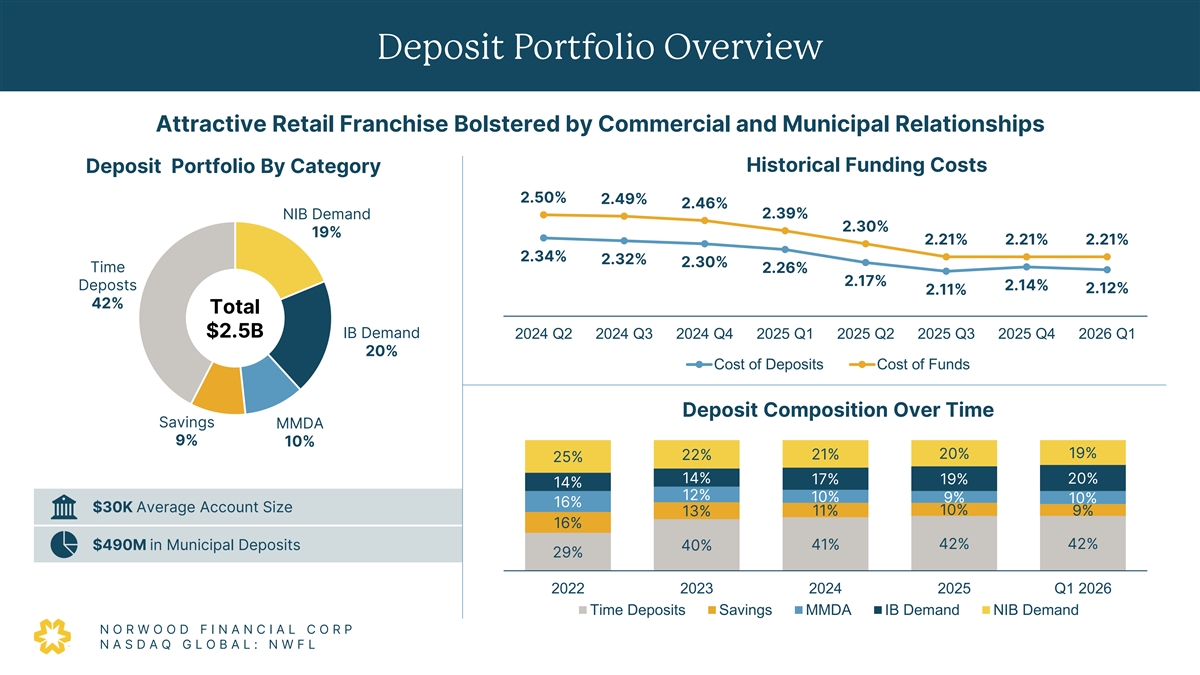
Deposit Portfolio Overview 2 65 86 246 Attractive Retail Franchise Bolstered by Commercial and Municipal Relationships 198 47 Historical Funding Costs Deposit Portfolio By Category 237 155 2.50% 2.49% 33 2.46% 2.39% NIB Demand 2.30% 66 19% 2.21% 2.21% 2.21% 145 185 2.34% 2.32% 2.30% Time 2.26% 2.17% 147 Deposts 2.14% 2.12% 2.11% 97 42% Total 81 $2.5B IB Demand 2024 Q2 2024 Q3 2024 Q4 2025 Q1 2025 Q2 2025 Q3 2025 Q4 2026 Q1 209 218 20% 221 Cost of Deposits Cost of Funds 241 231 Deposit Composition Over Time 217 Savings MMDA 9% 10% 245 20% 19% 22% 21% 25% 156 170 14% 20% 17% 19% 14% 12% 10% 9% 10% 16% 40 $30K Average Account Size 10% 13% 11% 9% 171 16% 117 42% 42% $490M in Municipal Deposits 41% 40% 29% 229 87 96 2022 2023 2024 2025 Q1 2026 Time Deposits Savings MMDA IB Demand NIB Demand 149 92 N O R W O O D F I N A N C I A L C O R P 148 N A S D A Q G L O B A L : N W F L Additional Colors
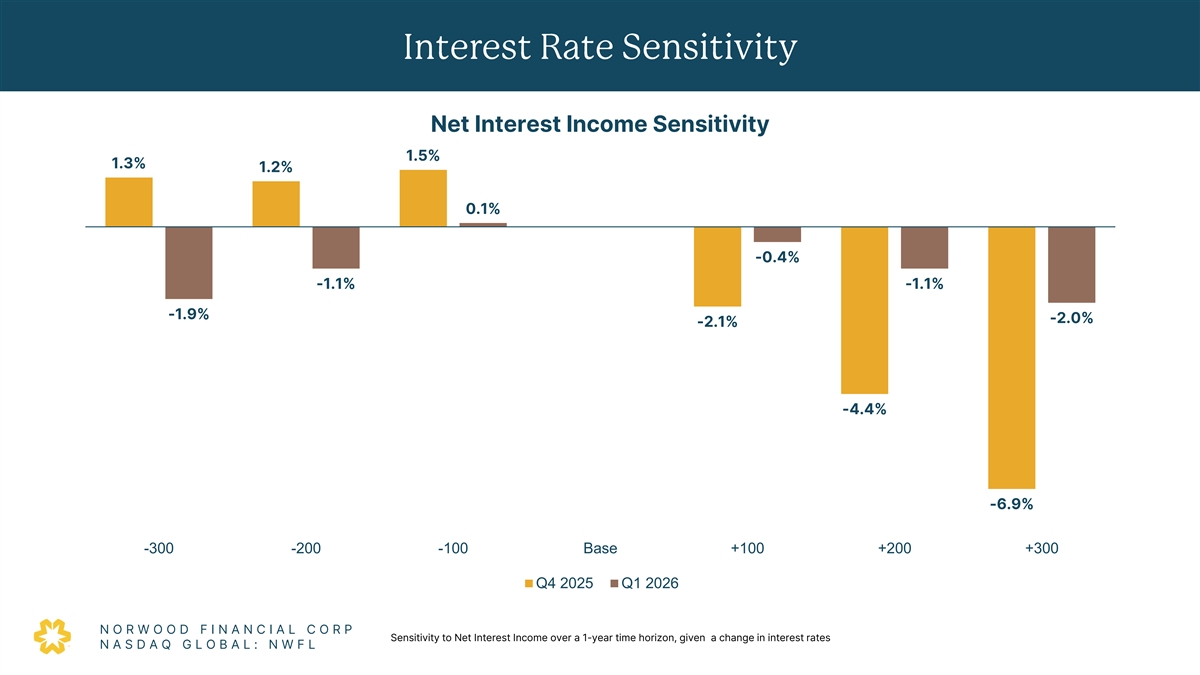
Interest Rate Sensitivity 2 65 86 246 Net Interest Income Sensitivity 198 47 1.5% 1.3% 1.2% 237 155 33 0.1% 66 145 185 -0.4% 147 -1.1% -1.1% 97 81 -1.9% -2.0% -2.1% 209 218 221 241 231 -4.4% 217 245 156 170 40 -6.9% 171 117 -300 -200 -100 Base +100 +200 +300 229 87 Q4 2025 Q1 2026 96 149 92 N O R W O O D F I N A N C I A L C O R P Sensitivity to Net Interest Income over a 1-year time horizon, given a change in interest rates 148 N A S D A Q G L O B A L : N W F L Additional Colors
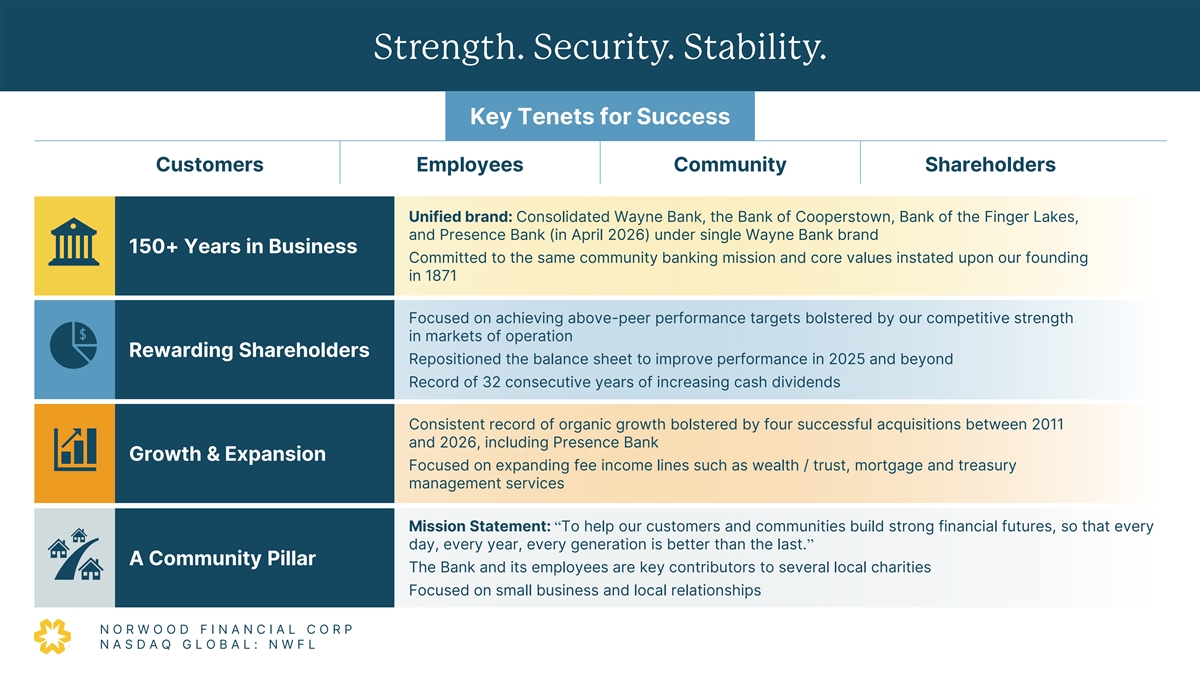
Strength. Security. Stability. 2 65 86 Key Tenets for Success 246 198 47 Customers Employees Community Shareholders 237 155 33 Unified brand: Consolidated Wayne Bank, the Bank of Cooperstown, Bank of the Finger Lakes, 66 and Presence Bank (in April 2026) under single Wayne Bank brand 145 150+ Years in Business 185 Committed to the same community banking mission and core values instated upon our founding in 1871 147 97 81 Focused on achieving above-peer performance targets bolstered by our competitive strength in markets of operation 209 218 Rewarding Shareholders Repositioned the balance sheet to improve performance in 2025 and beyond 221 Record of 32 consecutive years of increasing cash dividends 241 231 217 Consistent record of organic growth bolstered by four successful acquisitions between 2011 and 2026, including Presence Bank 245 Growth & Expansion 156 Focused on expanding fee income lines such as wealth / trust, mortgage and treasury 170 management services 40 171 Mission Statement: “To help our customers and communities build strong financial futures, so that every 117 day, every year, every generation is better than the last.” 229 A Community Pillar The Bank and its employees are key contributors to several local charities 87 96 Focused on small business and local relationships 149 92 N O R W O O D F I N A N C I A L C O R P 148 N A S D A Q G L O B A L : N W F L Additional Colors
Investment Proposition 2 65 86 246 198 47 237 155 33 Strong local ties providing consistent 66 Disciplined underwriting culture 145 and sound growth opportunities 185 147 97 81 Experienced Executive Team, aligned Granular loan and deposit portfolio 209 with Board of Directors, focused on 218 tied to our community 221 delivering shareholder return 241 231 217 Well-positioned to take Attractive financial profile enhanced advantage of market dislocation 245 by recent repositioning 156 and M&A opportunities 170 40 171 117 229 Strength. Security. Stability. 87 96 149 92 N O R W O O D F I N A N C I A L C O R P 148 N A S D A Q G L O B A L : N W F L Additional Colors

2 65 86 246 198 47 237 155 33 66 145 185 147 97 81 209 APPENDIX 218 221 241 231 217 245 156 170 40 171 117 229 87 96 149 92 148 Additional Colors
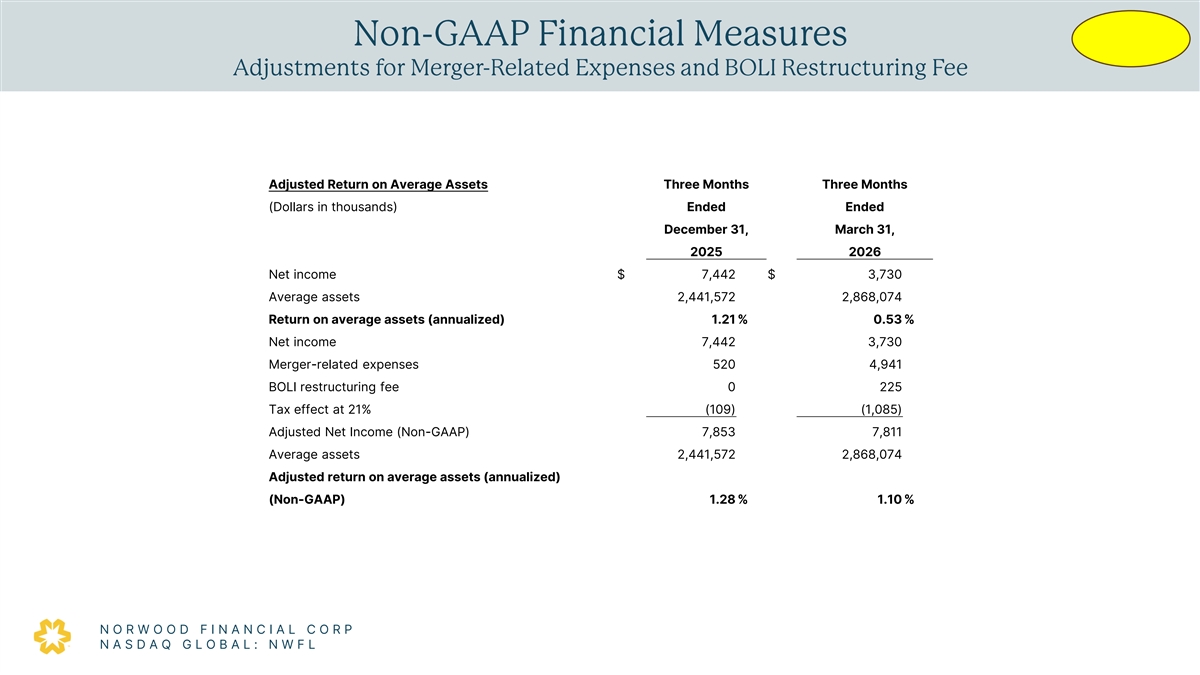
Non -GAAP Financial Measures 2 Adjustments for Merger -Related Expenses and BOLI Restructuring Fee 65 86 246 198 47 237 Adjusted Return on Average Assets Three Months Three Months 155 33 (Dollars in thousands) Ended Ended December 31, March 31, 66 145 2025 2026 185 Net income $ 7,442 $ 3,730 147 97 Average assets 2,441,572 2,868,074 81 Return on average assets (annualized) 1.21 % 0.53 % 209 Net income 7,442 3,730 218 221 Merger-related expenses 520 4,941 BOLI restructuring fee 0 225 241 231 Tax effect at 21% (109) (1,085) 217 Adjusted Net Income (Non-GAAP) 7,853 7,811 245 Average assets 2,441,572 2,868,074 156 Adjusted return on average assets (annualized) 170 (Non-GAAP) 1.28 % 1.10 % 40 171 117 229 87 96 149 92 N O R W O O D F I N A N C I A L C O R P 148 N A S D A Q G L O B A L : N W F L Additional Colors
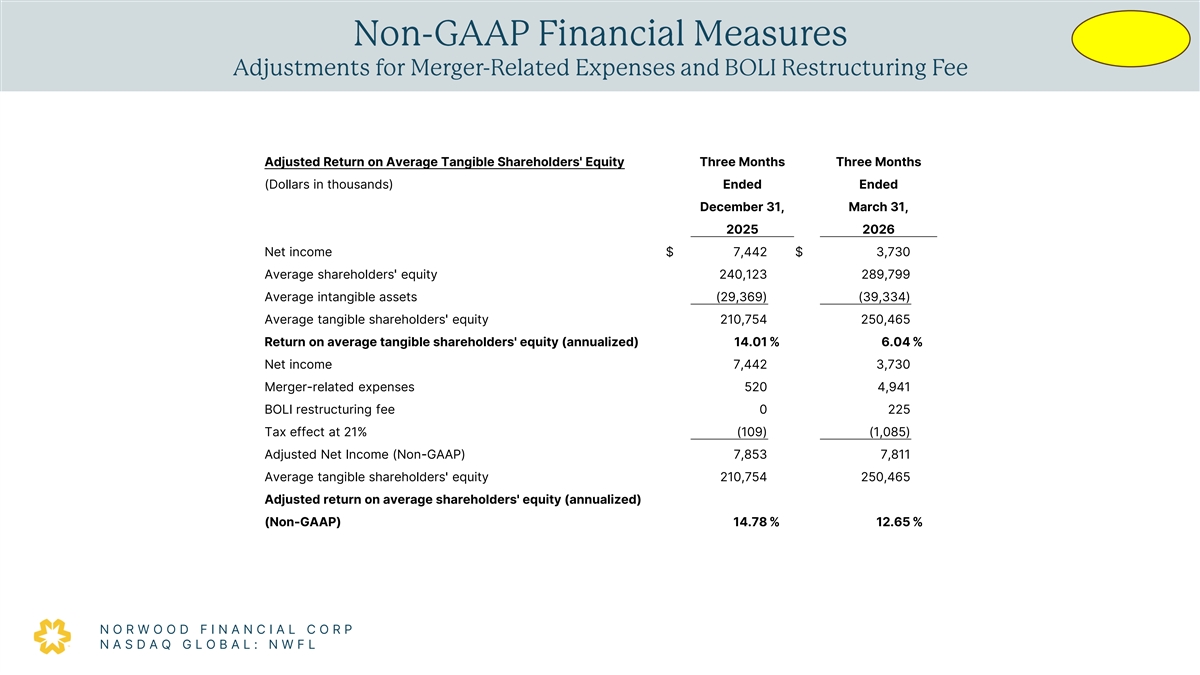
Non -GAAP Financial Measures 2 Adjustments for Merger -Related Expenses and BOLI Restructuring Fee 65 86 246 198 47 Adjusted Return on Average Tangible Shareholders' Equity Three Months Three Months 237 (Dollars in thousands) Ended Ended 155 33 December 31, March 31, 2025 2026 66 145 Net income $ 7,442 $ 3,730 185 Average shareholders' equity 240,123 289,799 147 97 Average intangible assets (29,369) (39,334) 81 Average tangible shareholders' equity 210,754 250,465 209 Return on average tangible shareholders' equity (annualized) 14.01 % 6.04 % 218 221 Net income 7,442 3,730 Merger-related expenses 520 4,941 241 231 BOLI restructuring fee 0 225 217 Tax effect at 21% (109) (1,085) 245 Adjusted Net Income (Non-GAAP) 7,853 7,811 156 Average tangible shareholders' equity 210,754 250,465 170 Adjusted return on average shareholders' equity (annualized) 40 171 (Non-GAAP) 14.78 % 12.65 % 117 229 87 96 149 92 N O R W O O D F I N A N C I A L C O R P 148 N A S D A Q G L O B A L : N W F L Additional Colors
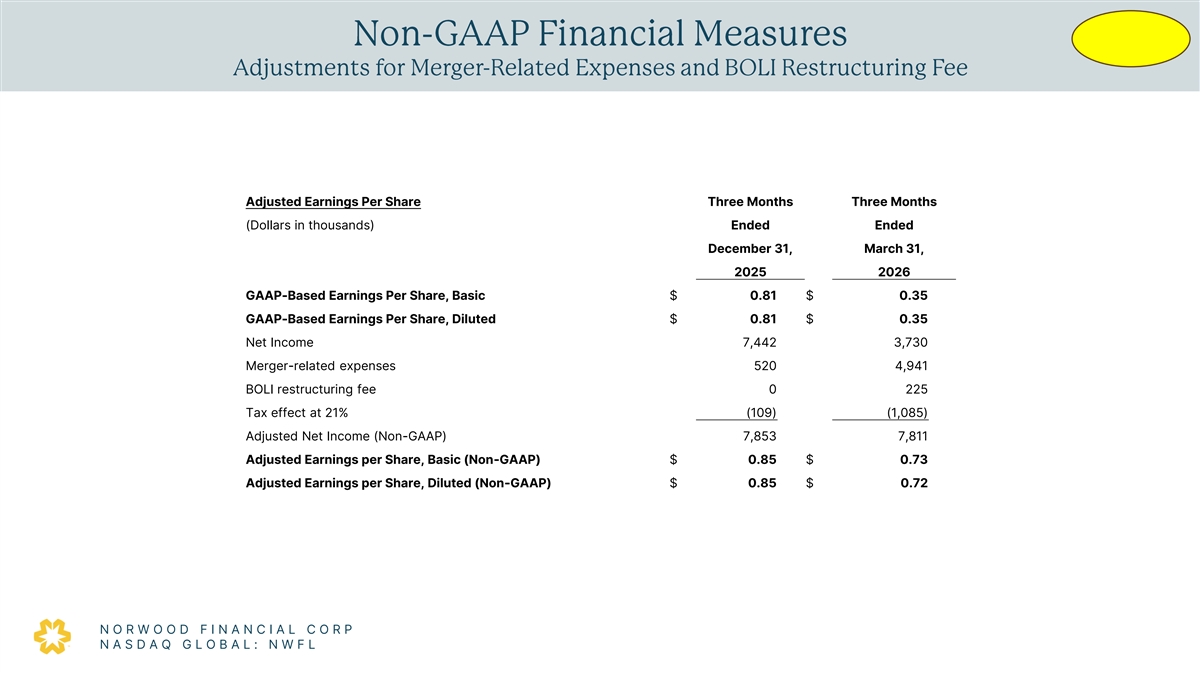
Non -GAAP Financial Measures 2 Adjustments for Merger -Related Expenses and BOLI Restructuring Fee 65 86 246 198 47 237 155 Adjusted Earnings Per Share Three Months Three Months 33 (Dollars in thousands) Ended Ended 66 145 December 31, March 31, 185 2025 2026 147 GAAP-Based Earnings Per Share, Basic $ 0.81 $ 0.35 97 81 GAAP-Based Earnings Per Share, Diluted $ 0.81 $ 0.35 209 Net Income 7,442 3,730 218 221 Merger-related expenses 520 4,941 BOLI restructuring fee 0 225 241 231 Tax effect at 21% (109) (1,085) 217 Adjusted Net Income (Non-GAAP) 7,853 7,811 245 Adjusted Earnings per Share, Basic (Non-GAAP) $ 0.85 $ 0.73 156 170 Adjusted Earnings per Share, Diluted (Non-GAAP) $ 0.85 $ 0.72 40 171 117 229 87 96 149 92 N O R W O O D F I N A N C I A L C O R P 148 N A S D A Q G L O B A L : N W F L Additional Colors
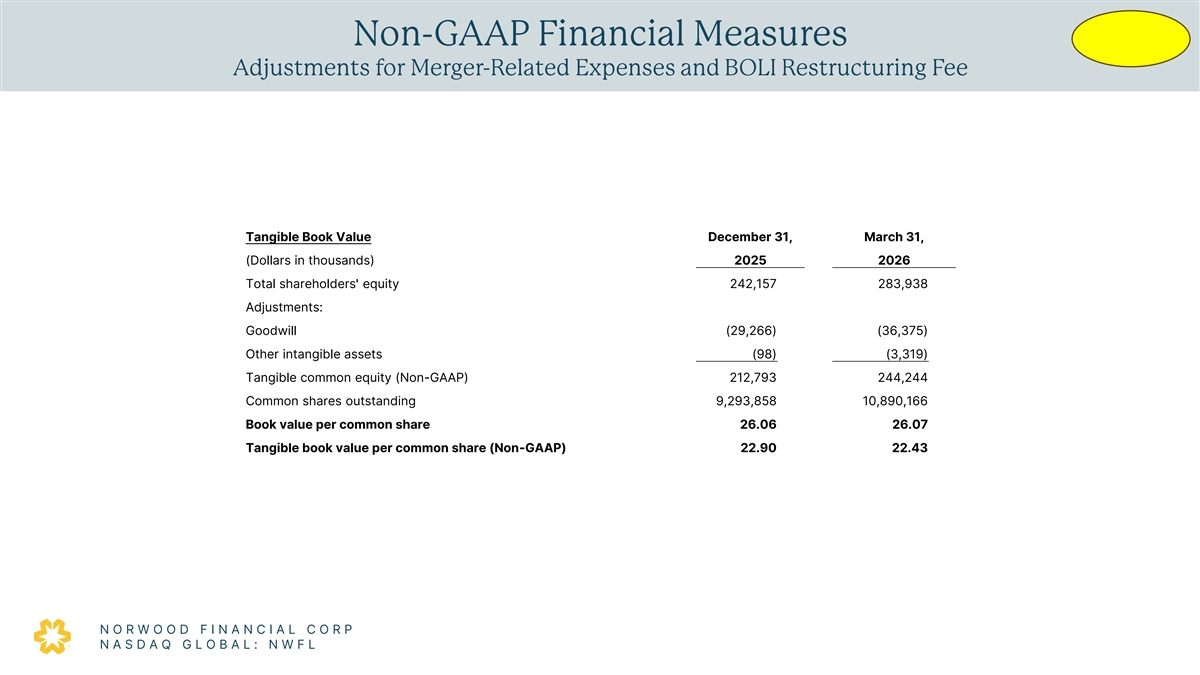
Non -GAAP Financial Measures 2 Adjustments for Merger -Related Expenses and BOLI Restructuring Fee 65 86 246 198 47 237 155 33 66 Tangible Book Value December 31, March 31, 145 185 (Dollars in thousands) 2025 2026 147 Total shareholders' equity 242,157 283,938 97 Adjustments: 81 Goodwill (29,266) (36,375) 209 218 Other intangible assets (98) (3,319) 221 Tangible common equity (Non-GAAP) 212,793 244,244 241 Common shares outstanding 9,293,858 10,890,166 231 217 Book value per common share 26.06 26.07 Tangible book value per common share (Non-GAAP) 22.90 22.43 245 156 170 40 171 117 229 87 96 149 92 N O R W O O D F I N A N C I A L C O R P 148 N A S D A Q G L O B A L : N W F L Additional Colors
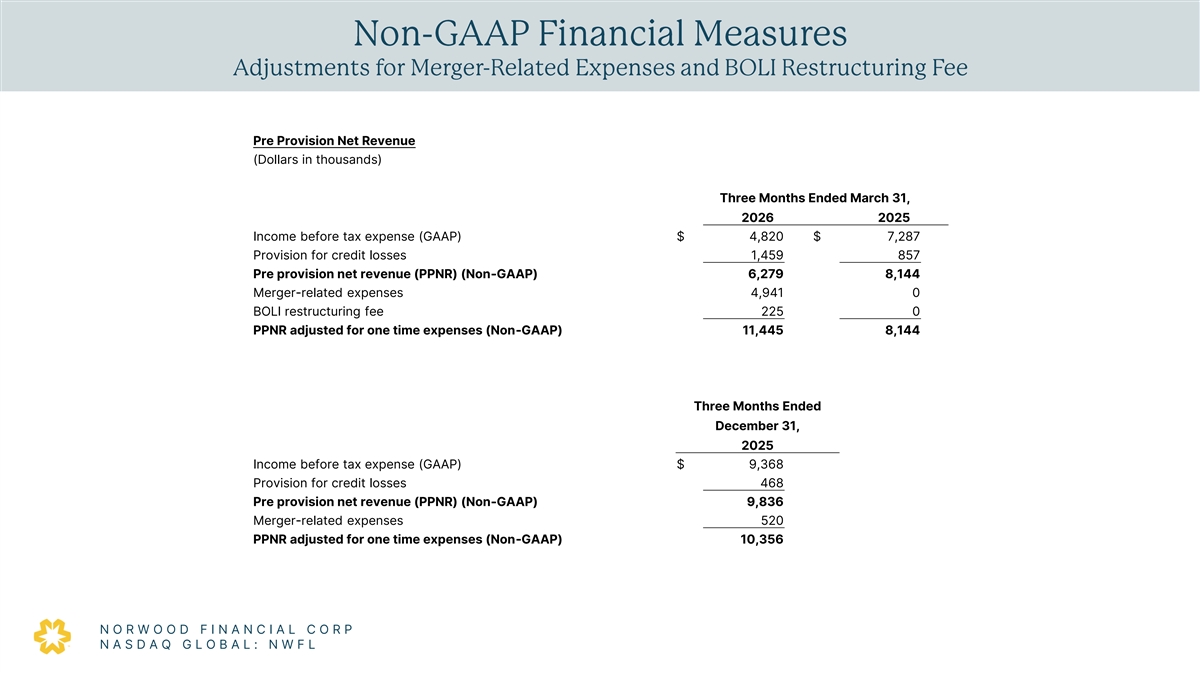
Non -GAAP Financial Measures 2 Adjustments for Merger -Related Expenses and BOLI Restructuring Fee 65 86 246 198 Pre Provision Net Revenue 47 (Dollars in thousands) 237 155 Three Months Ended March 31, 33 2026 2025 66 Income before tax expense (GAAP) $ 4,820 $ 7,287 145 Provision for credit losses 1,459 857 185 Pre provision net revenue (PPNR) (Non-GAAP) 6,279 8,144 147 Merger-related expenses 4,941 0 97 81 BOLI restructuring fee 225 0 PPNR adjusted for one time expenses (Non-GAAP) 11,445 8,144 209 218 221 241 231 Three Months Ended 217 December 31, 2025 245 Income before tax expense (GAAP) $ 9,368 156 170 Provision for credit losses 468 Pre provision net revenue (PPNR) (Non-GAAP) 9,836 40 171 Merger-related expenses 520 117 PPNR adjusted for one time expenses (Non-GAAP) 10,356 229 87 96 149 92 N O R W O O D F I N A N C I A L C O R P 148 N A S D A Q G L O B A L : N W F L Additional Colors

2 65 86 246 198 47 237 155 33 66 145 185 147 97 81 209 218 Thank You 221 241 231 217 245 156 170 40 171 117 229 87 96 149 92 148 Additional Colors