Pay vs Performance Disclosure - USD ($)
Dec. 31, 2022
Aug. 08, 2022
Dec. 31, 2025
Dec. 31, 2024
Dec. 31, 2023
Dec. 31, 2022
Dec. 31, 2021
Pay Versus Performance Disclosure
In accordance with rules adopted by the SEC pursuant to the Dodd-Frank Wall Street Reform and Consumer Protection Act of 2010, we provide the following disclosure regarding executive compensation for our principal executive officers, or PEOs, and
Non-PEO
NEOs and company performance for the fiscal years listed below. The compensation & people committee did not consider the pay versus performance disclosure below in making its compensation decisions for any of the years shown. For discussion of how our compensation & people committee seeks to align pay with performance when making compensation decisions, please review Compensation Discussion and Analysis beginning on page 40 of this Proxy Statement. Year |
Summary Compensation Table Total for PEO 1(1) ($) |
Summary Compensation Table Total for PEO 2(1) ($) |
Compensation Actually Paid to PEO 1 (1)(2)(3) ($) |
Compensation Actually Paid to PEO 2(1)(2)(3) ($) |
Average Summary Compensation Table Total for Non-PEO NEOs(1) ($) |
Average Compensation Actually Paid to Non-PEO NEOs(1)(2)(3) ($) |
Value of Initial Fixed $100 Investment based on:(4) |
Net Income ($ Millions) |
Net Product Revenue(5) ($ Millions) |
|||||||||||||||||||||||||||||||
Total Shareholder Return ($) |
Peer Group Total Shareholder Return ($) |
|||||||||||||||||||||||||||||||||||||||
2025 |
— | 5,370,389 | — | 5,976,610 | 2,444,836 | 2,239,171 | 62.82 | 119.92 | (413 | ) | 54.03 | |||||||||||||||||||||||||||||
2024 |
— | 6,776,359 | — | 12,973,276 | 2,462,405 | 3,526,736 | 75.84 | 90.58 | 674 | 36.50 | ||||||||||||||||||||||||||||||
2023 |
— | 3,416,453 | — | 2,214,078 | 2,436,689 | 2,165,913 | 51.40 | 91.84 | (352 | ) | 26.82 | |||||||||||||||||||||||||||||
2022 |
4,911,049 | 11,744,447 | 3,809,001 | 11,143,330 | 1,958,794 | 1,440,120 | 64.80 | 88.53 | (232 | ) | 11.74 | |||||||||||||||||||||||||||||
2021 |
6,519,427 | — | 1,457,816 | — | 2,188,153 | 857,046 | 75.86 | 99.37 | 1,605 | 0.00 | ||||||||||||||||||||||||||||||
| (1) | Jacqualyn A. Fouse, Ph.D. (PEO 1) was our PEO for 2021 and until August 8, 2022. Brian Goff (PEO 2) has been our PEO since August 8, 2022. The individuals comprising the Non-PEO NEOs for each year presented are listed below. |
2021 |
2022 |
2023-2024 |
2025 | |||
| Jonathan Biller | Jonathan Biller | Sarah Gheuens, M.D., Ph.D. | Cecilia Jones | |||
| Christopher Bowden | Bruce Car, Ph.D. | Cecilia Jones | James Burns | |||
| Bruce Car, Ph.D. | Sarah Gheuens, M.D., Ph.D. | James Burns | Sarah Gheuens, M.D., Ph.D. | |||
| Sarah Gheuens, M.D., Ph.D. | Richa Poddar | Tsveta Milanova | Krishnan Viswanadhan, Pharm.D | |||
| Richa Poddar | Cecilia Jones | |||||
| Darrin Miles | James Burns |
| (2) | The amounts shown for Compensation Actually Paid have been calculated in accordance with Item 402(v) of Regulation S-K and do not reflect the actual amount of compensation actually earned, realized, or received by the company’s NEOs during the applicable years. These amounts reflect the Summary Compensation Table Total with certain adjustments as described in footnote 3 below. |
| (3) | Compensation Actually Paid reflects the exclusions and inclusions of certain amounts for the PEOs and the Non-PEO NEOs as set forth below. Equity values are calculated in accordance with FASB ASC Topic 718. Amounts in the Exclusion of Stock Awards and Option Awards column for PEO 2 and the non-PEO NEOs are the totals from the Stock Awards and Option Awards columns set forth in the Summary Compensation Table. |
Year |
Summary Compensation Table Total for PEO 2 ($) |
Exclusion of Stock Awards and Option Awards for PEO 2 ($) |
Inclusion of Equity Values for PEO 2 ($) |
Compensation Actually Paid to PEO 2 ($) |
||||||||||||
2025 |
5,370,389 | (3,918,932 | ) | 4,525,153 | 5,976,610 | |||||||||||
Year |
Average Summary Compensation Table Total for Non-PEO NEOs ($) |
Average Exclusion of Stock Awards and Option Awards for Non-PEO NEOs ($) |
Average Inclusion of Equity Values for Non-PEO NEOs ($) |
Average Compensation Actually Paid to Non-PEO NEOs ($) |
||||||||||||
2025 |
2,444,836 | (1,597,065 | ) | 1,391,400 | 2,239,171 | |||||||||||
The amounts in the Inclusion of Equity Values in the tables above are derived from the amounts set forth in the following tables:
Year |
Year-End FairValue of Equity Awards Granted During Year That Remained Unvested as of Last Day of Year for PEO 2 ($) |
Change in Fair Value from Last Day of Prior Year to Last Day of Year of Unvested Equity Awards Granted in any Prior Year for PEO 2 ($) |
Vesting-Date Fair Value of Equity Awards Granted During Year that Vested During Year for PEO 2 ($) |
Change in Fair Value from Last Day of Prior Year to Vesting Date of Unvested Equity Awards Granted in any Prior Year that Vested During Year for PEO 2 ($) |
Fair Value at Last Day of Prior Year of Equity Awards Forfeited During Year for PEO 2 ($) |
Total—Inclusion of Equity Values for PEO 2 ($) |
||||||||||||||||||
2025 |
3,224,443 | (1,046,174 | ) | — | 2,346,884 | — | 4,525,153 | |||||||||||||||||
Year |
Average Year-End Fair Value of Equity Awards Granted During Year That Remained Unvested as of Last Day of Year for Non-PEO NEOs ($) |
Average Change in Fair Value from Last Day of Prior Year to Last Day of Year of Unvested Equity Awards Granted in any Prior Year for Non-PEO NEOs($) |
Average Vesting- Date Fair Value of Equity Awards Granted During Year that Vested During Year for Non-PEO NEOs($) |
Average Change in Fair Value from Last Day of Prior Year to Vesting Date of Unvested Equity Awards Granted in any Prior Year that Vested During Year for Non-PEO NEOs($) |
Average Fair Value at Last Day of Prior Year of Equity Awards Forfeited During Year for Non-PEO NEOs ($) |
Total—Average Inclusion of Equity Values for Non-PEO NEOs ($) |
||||||||||||||||||
2025 |
1,302,731 | (214,864 | ) | — | 303,532 | — | 1,391,400 | |||||||||||||||||
| (4) | The peer group TSR set forth in this table utilizes the NASDAQ Biotechnology Index (“NASDAQ Biotech Index”), which we also utilize in the stock performance graph required by Item 201(e) of Regulation S-K included in our Annual Report on Form 10-K for the year ended December 31, 2025, filed with the SEC on February 12, 2026. The comparison assumes $100 was invested for the period starting December 31, 2020, through the end of the listed year in the company and in the NASDAQ Biotech Index, respectively. Historical stock performance is not necessarily indicative of future stock performance. |
| (5) | We determined net product revenue to be the most important financial performance measure used to link company performance to Compensation Actually Paid to our PEO and Non-PEO NEOs in 2025. This performance measure may not have been the most important financial performance measure for 2021 and we may determine a different financial performance measure to be the most important financial performance measure in future years. Assumptions used in revenue recognition are described in Note 2, Summary of Significant Accounting Policies, to our Consolidated Financial Statements in our Annual Report on Form 10-K for the year ended December 31, 2025, filed with the SEC on February 12, 2026. |
2021 |
2022 |
2023-2024 |
2025 | |||
| Jonathan Biller | Jonathan Biller | Sarah Gheuens, M.D., Ph.D. | Cecilia Jones | |||
| Christopher Bowden | Bruce Car, Ph.D. | Cecilia Jones | James Burns | |||
| Bruce Car, Ph.D. | Sarah Gheuens, M.D., Ph.D. | James Burns | Sarah Gheuens, M.D., Ph.D. | |||
| Sarah Gheuens, M.D., Ph.D. | Richa Poddar | Tsveta Milanova | Krishnan Viswanadhan, Pharm.D | |||
| Richa Poddar | Cecilia Jones | |||||
| Darrin Miles | James Burns |
| (4) | The peer group TSR set forth in this table utilizes the NASDAQ Biotechnology Index (“NASDAQ Biotech Index”), which we also utilize in the stock performance graph required by Item 201(e) of Regulation S-K included in our Annual Report on Form 10-K for the year ended December 31, 2025, filed with the SEC on February 12, 2026. The comparison assumes $100 was invested for the period starting December 31, 2020, through the end of the listed year in the company and in the NASDAQ Biotech Index, respectively. Historical stock performance is not necessarily indicative of future stock performance. |
Compensation Actually Paid reflects the exclusions and inclusions of certain amounts for the PEOs and the
Non-PEO
NEOs as set forth below. Equity values are calculated in accordance with FASB ASC Topic 718. Amounts in the Exclusion of Stock Awards and Option Awards column for PEO 2 and the non-PEO
NEOs are the totals from the Stock Awards and Option Awards columns set forth in the Summary Compensation Table. Year |
Summary Compensation Table Total for PEO 2 ($) |
Exclusion of Stock Awards and Option Awards for PEO 2 ($) |
Inclusion of Equity Values for PEO 2 ($) |
Compensation Actually Paid to PEO 2 ($) |
||||||||||||
2025 |
5,370,389 | (3,918,932 | ) | 4,525,153 | 5,976,610 | |||||||||||
The amounts in the Inclusion of Equity Values in the tables above are derived from the amounts set forth in the following tables:
Year |
Year-End FairValue of Equity Awards Granted During Year That Remained Unvested as of Last Day of Year for PEO 2 ($) |
Change in Fair Value from Last Day of Prior Year to Last Day of Year of Unvested Equity Awards Granted in any Prior Year for PEO 2 ($) |
Vesting-Date Fair Value of Equity Awards Granted During Year that Vested During Year for PEO 2 ($) |
Change in Fair Value from Last Day of Prior Year to Vesting Date of Unvested Equity Awards Granted in any Prior Year that Vested During Year for PEO 2 ($) |
Fair Value at Last Day of Prior Year of Equity Awards Forfeited During Year for PEO 2 ($) |
Total—Inclusion of Equity Values for PEO 2 ($) |
||||||||||||||||||
2025 |
3,224,443 | (1,046,174 | ) | — | 2,346,884 | — | 4,525,153 | |||||||||||||||||
Compensation Actually Paid reflects the exclusions and inclusions of certain amounts for the PEOs and the
Non-PEO
NEOs as set forth below. Equity values are calculated in accordance with FASB ASC Topic 718. Amounts in the Exclusion of Stock Awards and Option Awards column for PEO 2 and the non-PEO
NEOs are the totals from the Stock Awards and Option Awards columns set forth in the Summary Compensation Table. Year |
Average Summary Compensation Table Total for Non-PEO NEOs ($) |
Average Exclusion of Stock Awards and Option Awards for Non-PEO NEOs ($) |
Average Inclusion of Equity Values for Non-PEO NEOs ($) |
Average Compensation Actually Paid to Non-PEO NEOs ($) |
||||||||||||
2025 |
2,444,836 | (1,597,065 | ) | 1,391,400 | 2,239,171 | |||||||||||
The amounts in the Inclusion of Equity Values in the tables above are derived from the amounts set forth in the following tables:
Year |
Average Year-End Fair Value of Equity Awards Granted During Year That Remained Unvested as of Last Day of Year for Non-PEO NEOs ($) |
Average Change in Fair Value from Last Day of Prior Year to Last Day of Year of Unvested Equity Awards Granted in any Prior Year for Non-PEO NEOs($) |
Average Vesting- Date Fair Value of Equity Awards Granted During Year that Vested During Year for Non-PEO NEOs($) |
Average Change in Fair Value from Last Day of Prior Year to Vesting Date of Unvested Equity Awards Granted in any Prior Year that Vested During Year for Non-PEO NEOs($) |
Average Fair Value at Last Day of Prior Year of Equity Awards Forfeited During Year for Non-PEO NEOs ($) |
Total—Average Inclusion of Equity Values for Non-PEO NEOs ($) |
||||||||||||||||||
2025 |
1,302,731 | (214,864 | ) | — | 303,532 | — | 1,391,400 | |||||||||||||||||
Relationship Between PEO and
Non-PEO
NEO Compensation Actually Paid and Cumulative TSR The following chart sets forth the relationship between Compensation Actually Paid to our PEOs, the average of Compensation Actually Paid to our
Non-PEO
NEOs, and the company’s cumulative TSR over the five most recently completed fiscal years. The chart also compares the company’s cumulative TSR to that of the NASDAQ Biotech Index over the same period. 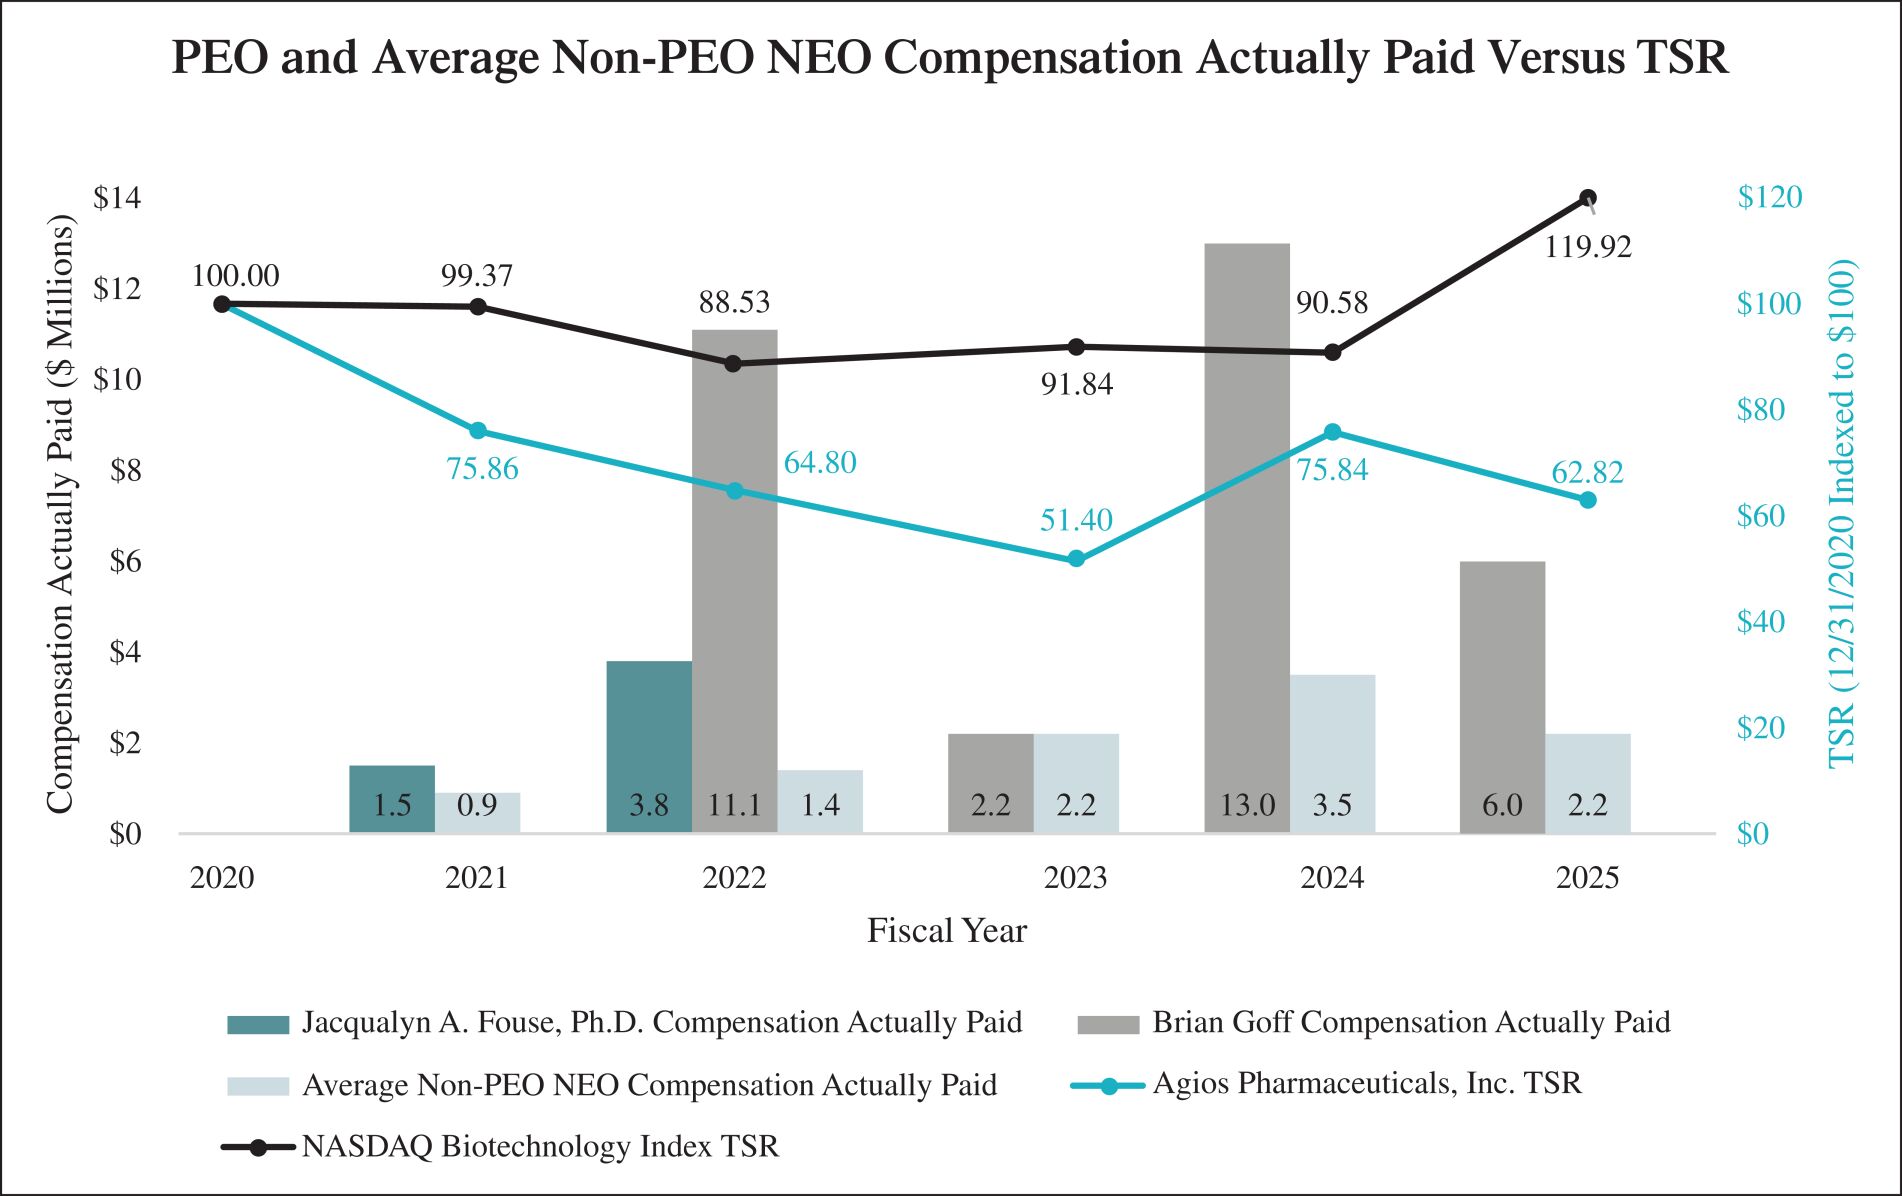
Relationship Between PEO and
Non-PEO
NEO Compensation Actually Paid and Net Income The following chart sets forth the relationship between Compensation Actually Paid to our PEOs, the average of Compensation Actually Paid to our
Non-PEO
NEOs, and our net income during the five most recently completed fiscal years. 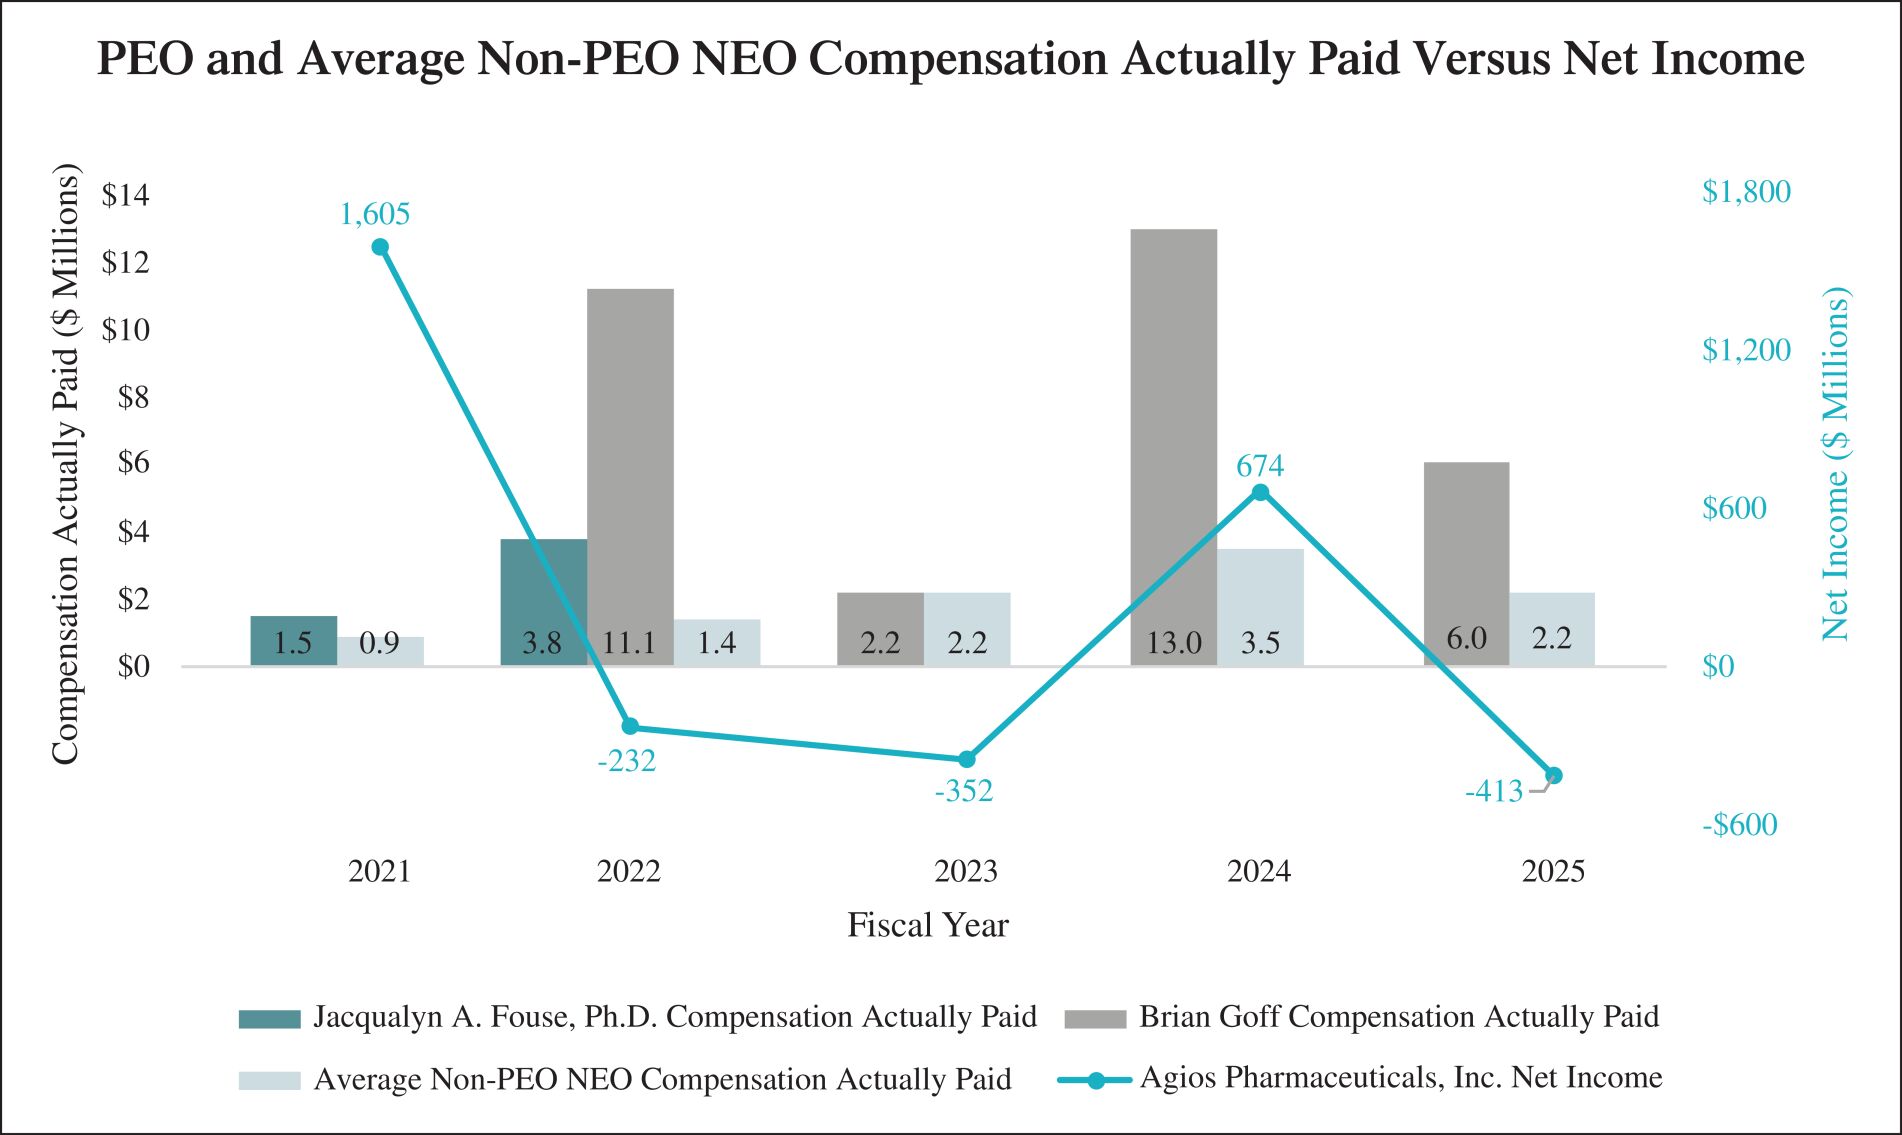
Relationship Between PEO and
Non-PEO
NEO Compensation Actually Paid and Net Product Revenue The following chart sets forth the relationship between Compensation Actually Paid to our PEOs, the average of Compensation Actually Paid to our
Non-PEO
NEOs, and our net product revenue during the five most recently completed fiscal years. 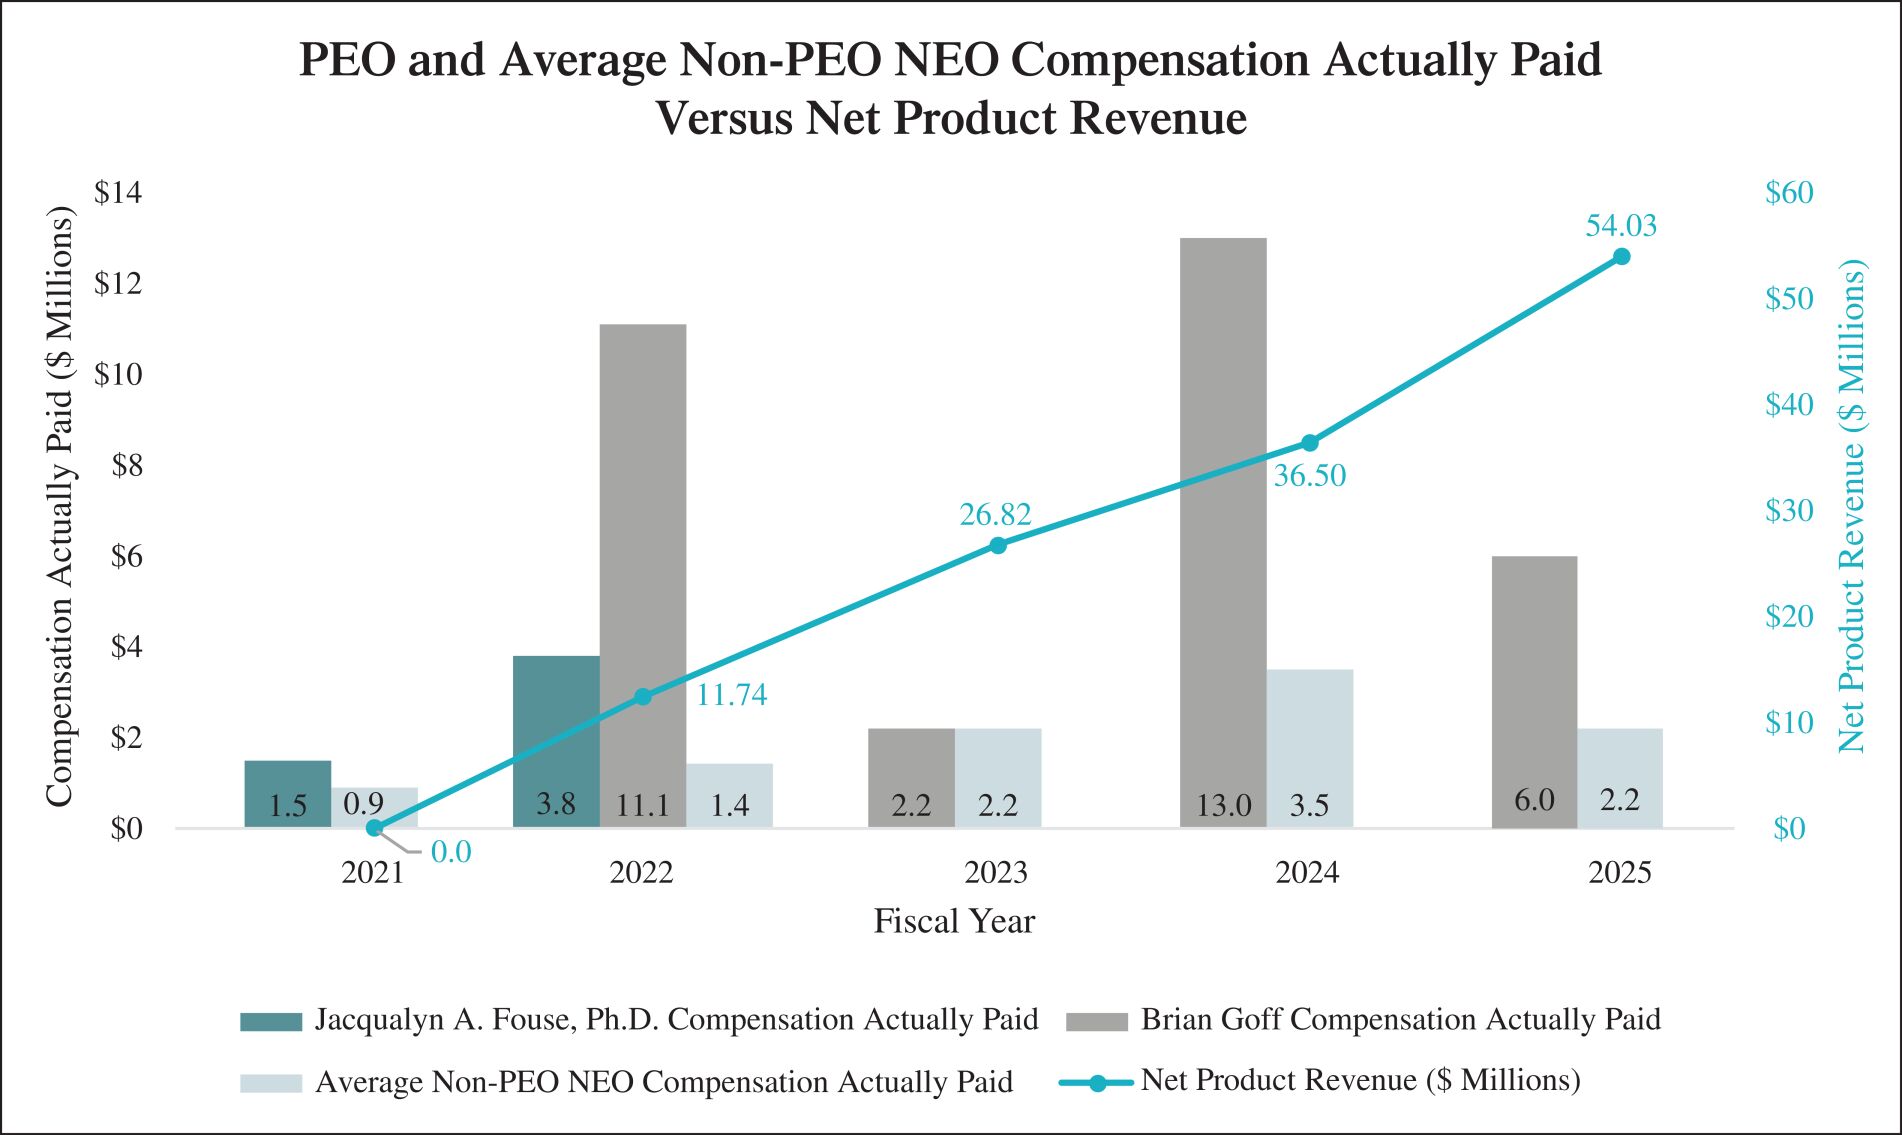
Relationship Between PEO and
Non-PEO
NEO Compensation Actually Paid and Cumulative TSR The following chart sets forth the relationship between Compensation Actually Paid to our PEOs, the average of Compensation Actually Paid to our
Non-PEO
NEOs, and the company’s cumulative TSR over the five most recently completed fiscal years. The chart also compares the company’s cumulative TSR to that of the NASDAQ Biotech Index over the same period. Tabular List of Most Important Financial and
Non-Financial
Performance Measures The following table presents the financial and
non-financial
performance measures that the company considers to have been the most important in linking Compensation Actually Paid to our PEO and other Non-PEO
NEOs for 2025 to company performance. Of these measures, as noted above, we have identified net product revenue to be the most important financial performance measure used to link company performance to Compensation Actually Paid to our PEO and Non-PEO
NEOs in 2025. Net Product Revenue Clinical Milestones Research Milestones |