In accordance with rules adopted by the SEC pursuant to the Dodd-Frank Wall Street Reform and Consumer Protection Act of 2010, we provide the following disclosure regarding executive compensation for our principal executive officer, or PEO, and Non-PEO named executive officer, or Non-PEO NEO, and Company performance for the years listed below. Our PEO is Randall D. Sampson. We have one Non-PEO NEO, which is Randy J. Dehmer, our Chief Financial Officer.
The Compensation Committee did not consider the pay versus performance disclosure below in making its pay decisions for any of the years shown.
|
Year |
Summary Compensation Table Total for PEO(1) |
Compensation Actually Paid to PEO (2) |
Average Summary Compensation Table Total for Non-PEO NEO(3) |
Average Compensation Actually Paid to Non-PEO NEO(4) |
Value of Initial Fixed $100 Investment Based on Total Shareholder Return (“TSR”)(5) |
Net Income (Loss) (6) |
||||||||||||
|
2025 |
$576,922 | $379,130 | $422,104 | $300,799 | $52 | $(529,431 | ) | |||||||||||
|
2024 |
$566,988 | $451,190 | $412,098 | $338,283 | $67 | $2,112,842 | ||||||||||||
|
2023 |
$518,927 | $304,024 | $373,613 | $252,117 | $66 | $10,563,249 |
|
(1) |
The dollar amounts reported are the amounts of total compensation reported for Mr. Sampson, our President and Chief Executive Officer, for each corresponding year in the “Total” column of the Summary Compensation Table (SCT). |
|
(2) |
The dollar amounts reported represent the amount of “compensation actually paid” to Mr. Sampson, computed in accordance with SEC regulations. The dollar amounts do not reflect the actual amount of compensation earned by or paid to Mr. Sampson during the applicable year. The following adjustments were made to Mr. Sampson’s total compensation for each year to determine “compensation actually paid” in accordance with SEC regulations: |
|
Adjustments to Determine Compensation Actually Paid for PEO |
2025 |
2024 |
2023 |
|||||||||
|
Deduction for amounts reported under the “Stock Awards” column in the SCT |
(146,250 | ) | (120,156 | ) | (117,254 | ) | ||||||
|
Deduction for fair value of awards granted during year that remain unvested as of year end |
(30,750 | ) | (3,306 | ) | (23,276 | ) | ||||||
|
(Deduction)/increase for change in fair value from prior year end to current year end of awards granted prior to year that were outstanding and unvested as of year end |
(38,633 | ) | 382 | (51,984 | ) | |||||||
|
(Deduction)/increase for change in fair value from prior year end to vesting date of awards granted prior to year that vested during year |
15,958 | 5,266 | (23,894 | ) | ||||||||
|
Increase for value of dividends paid on equity awards not otherwise reflected in fair value of awards |
1,883 | 2,016 | 1,505 | |||||||||
|
Total Adjustments |
(197,792 | ) | (115,799 | ) | (214,903 | ) | ||||||
Year-end fair values were determined based on the same methodology used for grant date fair value purposes. Deferred stock was valued based on the closing stock price on the relevant measurement date.
|
(3) |
The dollar amounts reported represent the average of the amounts reported for the NEOs as a group (excluding our PEO) in the “Total” column of the Summary Compensation Table in each applicable year. The NEO included for purposes of calculating the amounts in each applicable year is Randy J. Dehmer, our Chief Financial Officer, who is the only named executive officer other than our PEO. |
|
(4) |
The dollar amounts reported represent the amount of “compensation actually paid” to the NEOs as a group (excluding our PEO), as computed in accordance with SEC regulations. Again, the NEOs as a group (excluding our PEO) refers to Randy J. Dehmer, our Chief Financial Officer, who is the only named executive officer other than our PEO. The dollar amounts do not reflect the actual amount of compensation earned by or paid to Mr. Dehmer during the applicable year. The following adjustments were made to the Non-PEO NEO total compensation for each year to determine “compensation actually paid” in accordance with SEC regulations, using the same methodology described above in Note 2: |
|
Adjustments to Determine Compensation Actually Paid for Non-PEO NEO |
2025 |
2024 |
2023 |
|||||||||
|
Deduction for amounts reported under the “Stock Awards” Column in the SCT |
(89,700 | ) | (75,888 | ) | (66,274 | ) | ||||||
|
Deduction for fair value of awards granted during year that remain unvested as of year end |
(18,860 | ) | (2,088 | ) | (13,156 | ) | ||||||
|
(Deduction)/increase for change in fair value from prior year end to current year end of awards granted prior to year that were outstanding and unvested as of year end |
(23,460 | ) | 221 | (29,241 | ) | |||||||
|
(Deduction)/increase for change in fair value from prior year end to vesting date of awards granted prior to year that vested during year |
9,595 | 2,855 | (13,693 | ) | ||||||||
|
Increase for value of dividends paid on equity awards not otherwise reflected in fair value of awards |
1,120 | 1,085 | 868 | |||||||||
|
Total Adjustments |
(121,305 | ) | (73,816 | ) | (121,496 | ) | ||||||
|
(5) |
Cumulative TSR is calculated by dividing the sum of (i) the cumulative amount of dividends per share for the measurement period, assuming dividend reinvestment, and (ii) the difference between our share price at the end and the beginning of the measurement period by our share price at the beginning of the measurement period. We do not use TSR as a performance measure in our executive compensation program. |
|
(6) |
The dollar amounts reported represent the amount of net income reflected in our audited financial statements for the applicable year. We do not use net income as a performance measure in our executive compensation program. |
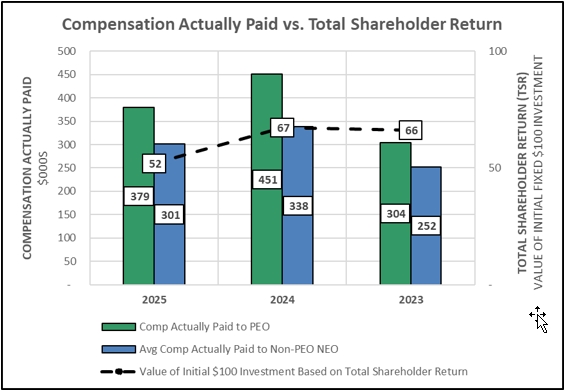
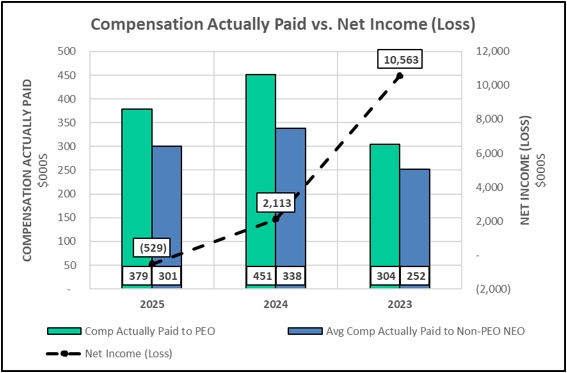
Relationship Disclosure to Pay Versus Performance Table
In accordance with rules adopted by the SEC pursuant to the Dodd-Frank Wall Street Reform and Consumer Protection Act of 2010, we provide the following descriptions of the relationships between information presented in the Pay Versus Performance table.
The charts below show, for the past three years, the relationship between the compensation actually paid (CAP) to our PEO and the compensation actually paid (CAP) to our non-PEO NEO to (i) the Company’s cumulative TSR; and (ii) the Company’s net income.