The following bar chart and table provide some indication of the risks of investing in the Fund. The Fund adopted the performance of The BeeHive Fund (the “Predecessor Fund”), a mutual fund series of Forum Funds, as the result of a reorganization of the Predecessor Fund into the Fund after the market close on December 13, 2024 (the “Reorganization”). Prior to the Reorganization, the Fund had not yet commenced operations. The Sub-Adviser served as the investment adviser to the Predecessor Fund. The returns shown for periods ending prior to the Reorganization are those of the Predecessor Fund
The following bar chart shows changes in the Fund’s and Predecessor Fund’s performance from year to year. The table shows how the Fund’s and Predecessor Fund’s average annual returns for 1-year, 5-years and 10-years compare with those of broad measures of market performance.
The Fund’s and Predecessor Fund’s past performance (before and after taxes) is not necessarily an indication of how the Fund will perform in the future. If the Predecessor Fund had been structured as an ETF its performance may have differed. You can obtain updated performance information at www.thebeehiveetf.com.
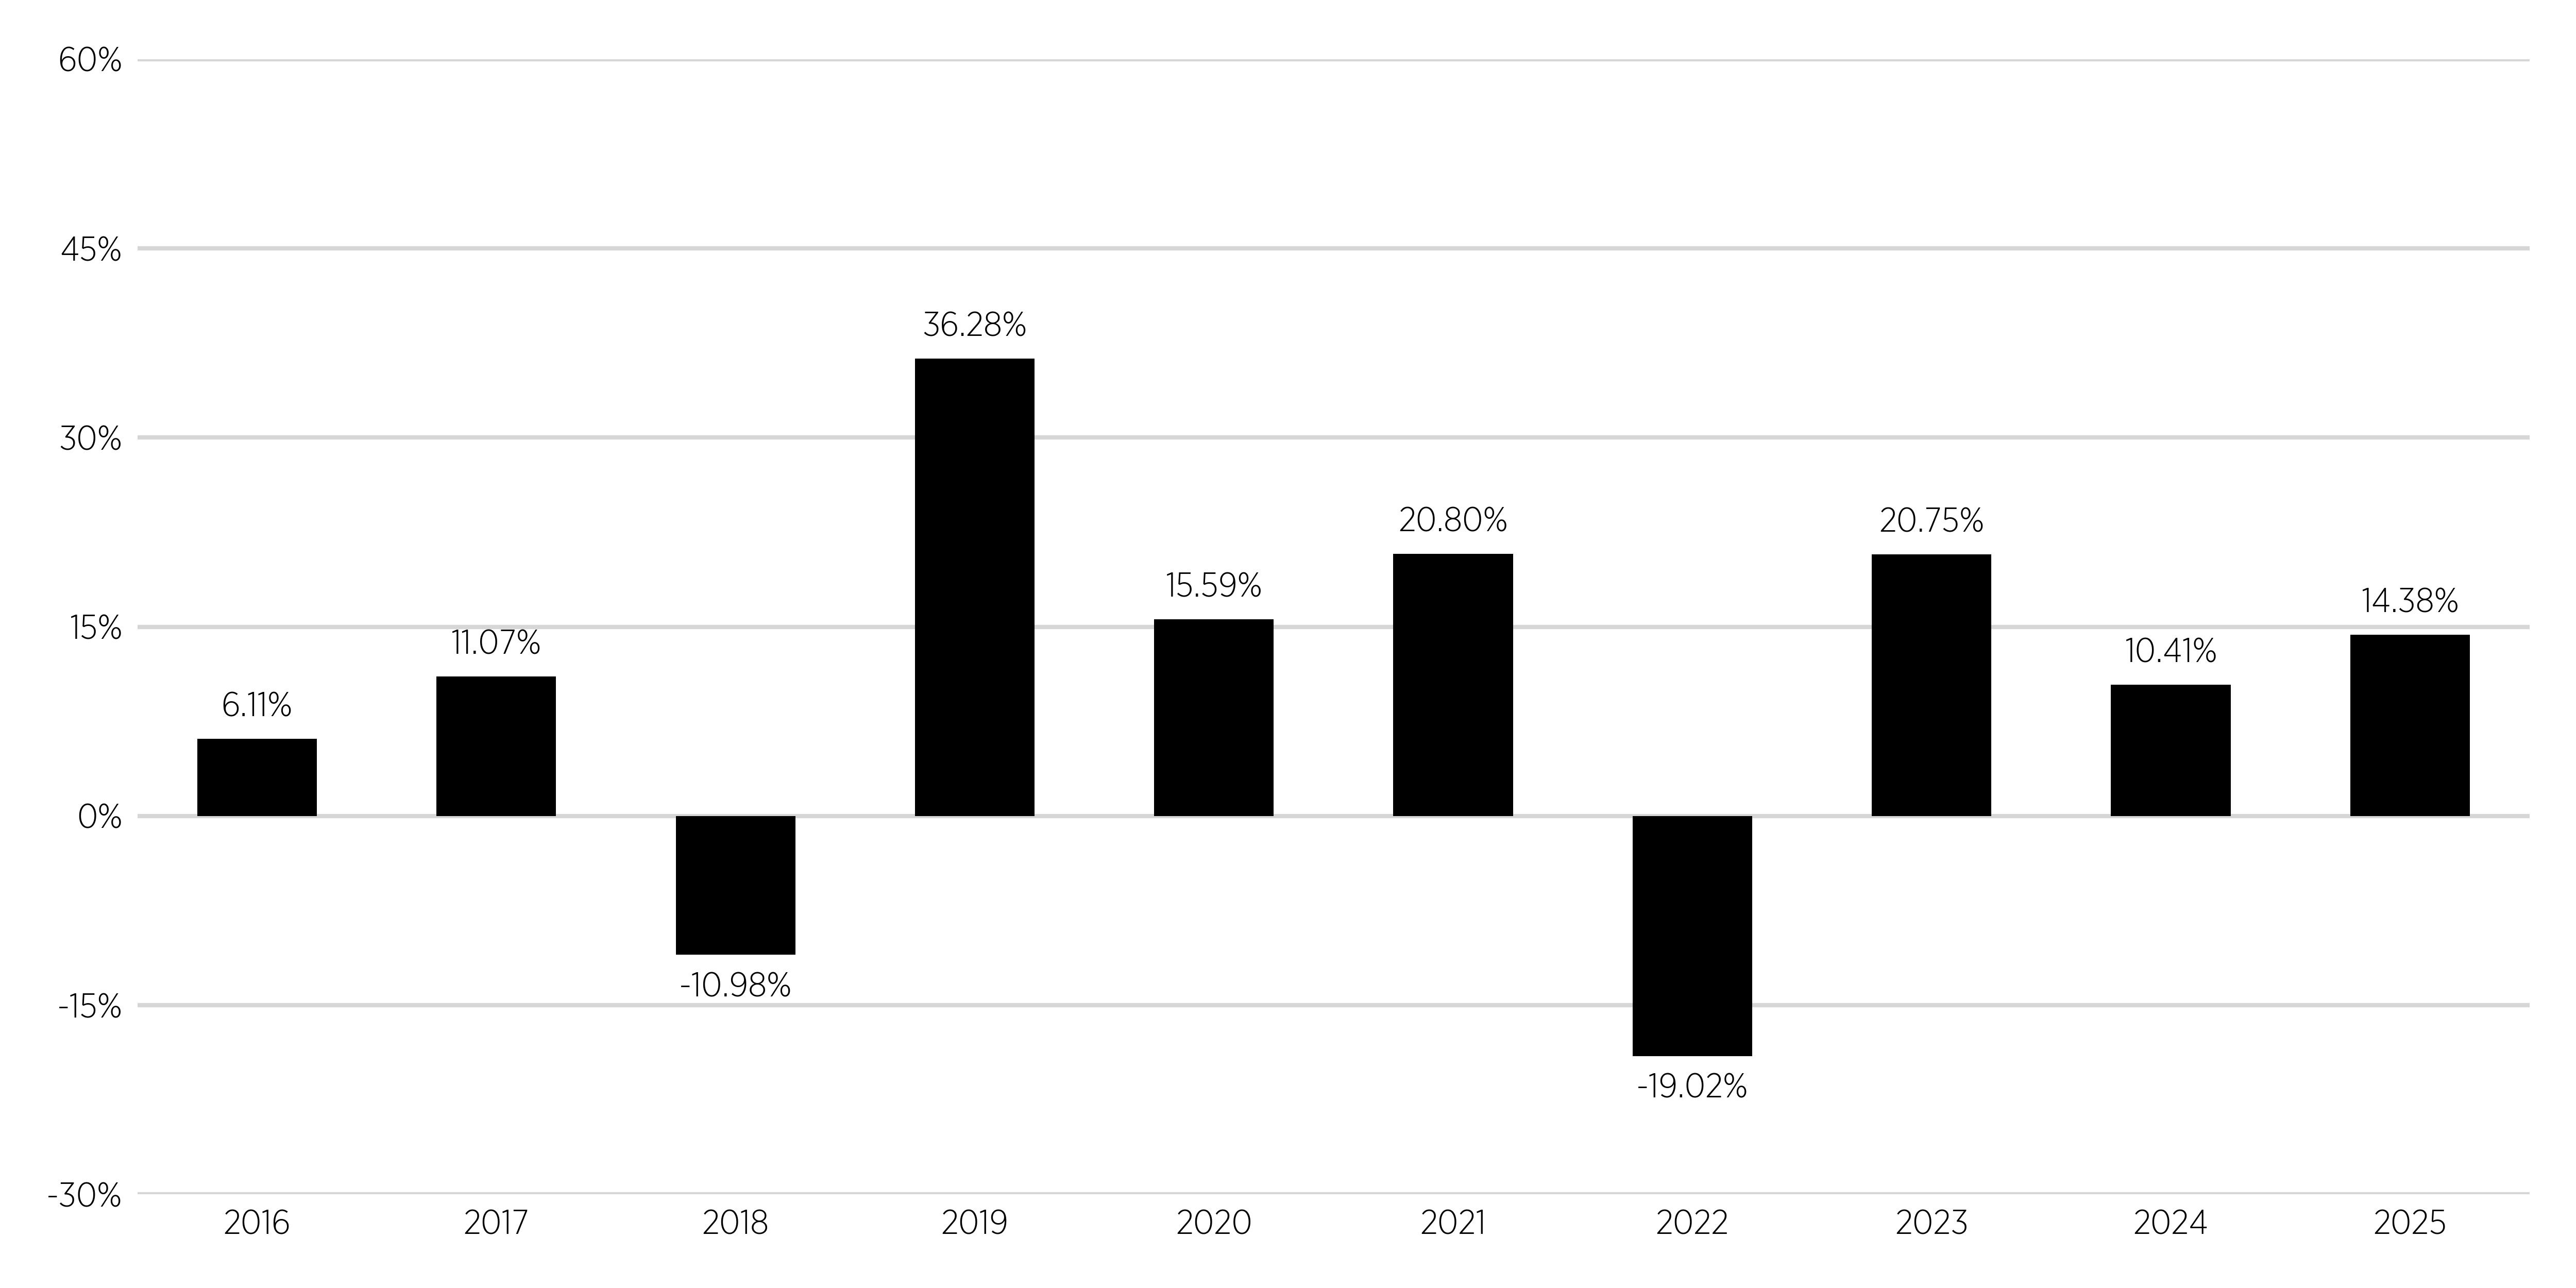
During the period shown, the highest return for a quarter was 17.02% for the quarter ended March 31, 2019, and the lowest return was -19.35% for the quarter ended March 31, 2020.
The performance information shown above is based on a calendar year. The Fund’s year-to-date return for the period ended March 31, 2026 was -6.10%.
|
|
1
Year
|
5
Years
|
10
Years
|
|---|---|---|---|
|
Return
Before Taxes
|
14.38%
|
8.32%
|
9.44%
|
|
Return
After Taxes on Distributions
|
14.28%
|
7.76%
|
8.76%
|
|
Return
After Taxes on Distributions and Sale of Shares
|
8.58%
|
6.47%
|
7.56%
|
|
S&P
500® Index
(reflects
no deduction for fees, expenses, or taxes)¹
|
17.88%
|
14.42%
|
14.82%
|
|
S&P
500® Equal Weight Index
(reflects
no deduction for fees, expenses, or taxes)²
|
11.43%
|
10.47%
|
11.71%
|
| ¹ | The S&P 500® Index is a broad-based, unmanaged measure of changes in stock market conditions based on the average performance of stocks of 500 large U.S. companies. |
| ² | The S&P 500® Equal Weight Index is the equal-weight version of the S&P 500® Index. The index includes the same constituents as the capitalization weighted S&P 500® Index, but each company is weighted equally. |
After-tax returns are calculated using the historical highest individual federal marginal income tax rates during the period covered by the table above and do not reflect the impact of state and local taxes. Actual after-tax returns depend on an investor’s tax situation and may differ from those shown. After-tax returns shown are not relevant to investors who hold their Shares through tax-deferred or other tax-advantaged arrangements such as an individual retirement account (“IRA”).