Pay vs Performance Disclosure - USD ($)
Dec. 31, 2025
Dec. 31, 2024
Dec. 31, 2023
Dec. 31, 2022
Dec. 31, 2021
| Value of Initial Fixed $100 Investment | ||||||||||||||||||||||||||
| Year | Summary Compensation Table Total for PEO(1)(2) | Compensation Actually Paid to PEO(1)(3) | Average Summary Compensation Table Total for Non-PEO NEOs(1), (2) | Average Compensation Actually Paid to Non-PEO NEOs(1), (3) | Company Total Shareholder Return(4) | Peer Group Total Shareholder Return(5) | Net Loss (in thousands)(6) | Total Revenue (in thousands)(7) | ||||||||||||||||||
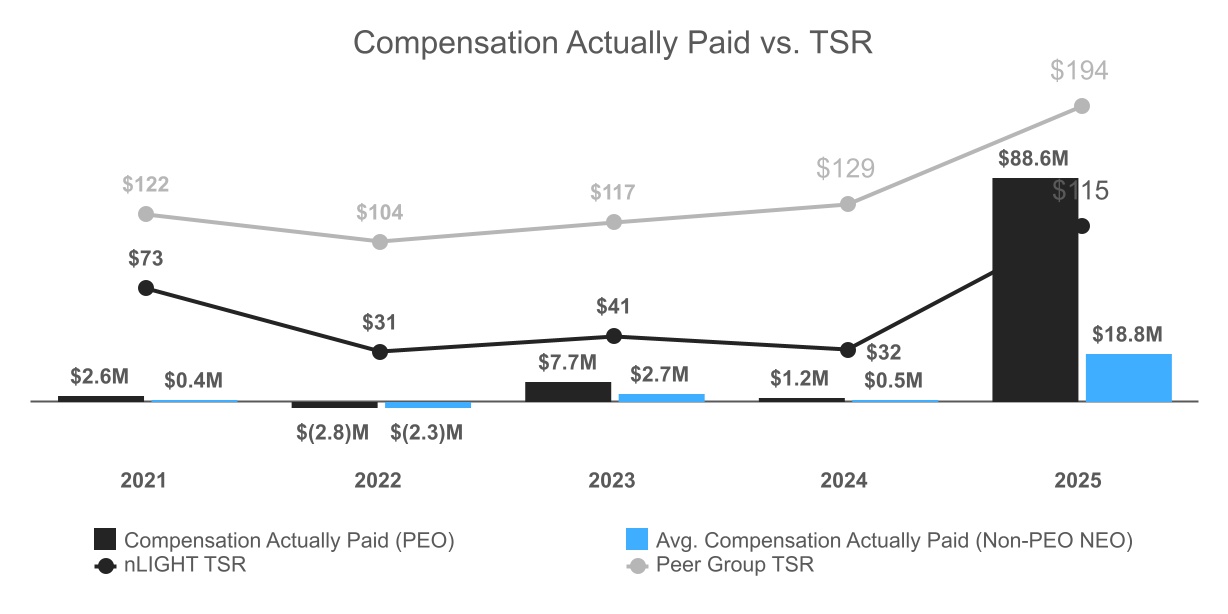
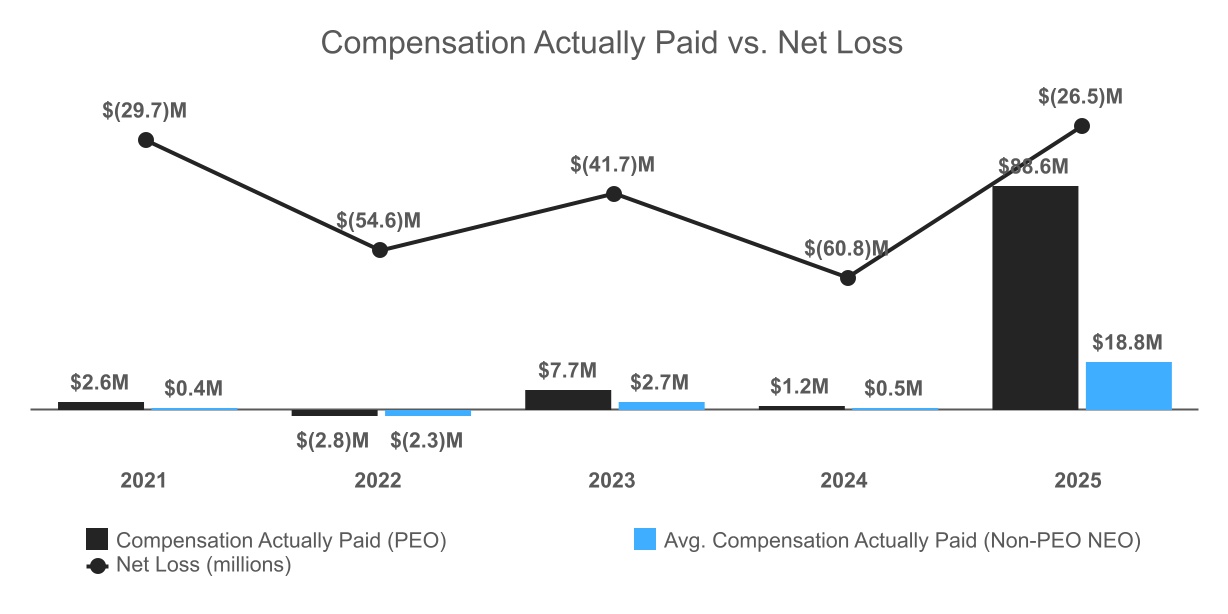
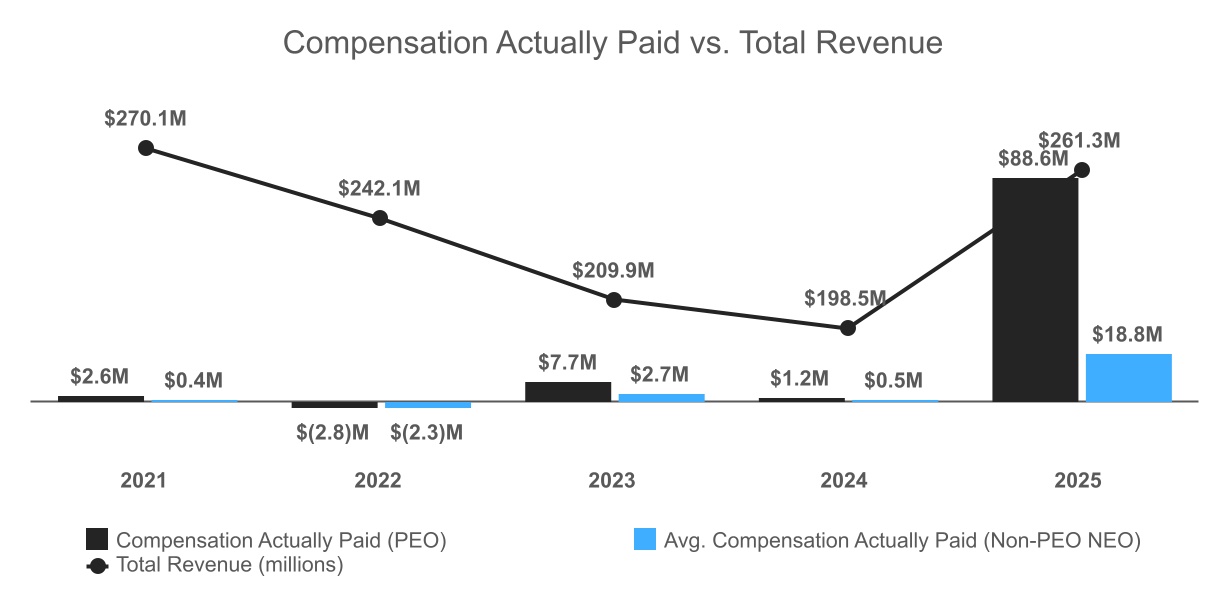
| 2025 | $ | 37,333,189 | $ | 88,597,639 | $ | 5,074,373 | $ | 18,836,913 | $ | 115 | $ | 194 | $ | (23,467) | $ | 261,330 | ||||||||||
| 2024 | 5,139,076 | 1,176,578 | 1,878,274 | 501,954 | 52 | 143 | (60,792) | 198,548 | ||||||||||||||||||
| 2023 | 4,024,164 | 7,697,077 | 1,506,406 | 2,749,232 | 67 | 130 | (41,670) | 209,921 | ||||||||||||||||||
| 2022 | 3,419,436 | (2,827,678) | 840,049 | (2,323,427) | 50 | 110 | (54,579) | 242,058 | ||||||||||||||||||
| 2021 | 5,741,065 | 2,568,562 | 2,286,632 | 430,621 | 118 | 138 | (29,669) | 270,146 | ||||||||||||||||||
(1) NEOs included in these columns reflect the following individuals:
Year | PEO | Non-PEO NEOs | ||||||
| 2025 | Scott Keeney | Joseph Corso | ||||||
| 2024 | Scott Keeney | Joseph Corso | ||||||
| 2023 | Scott Keeney | Joseph Corso | ||||||
| 2022 | Scott Keeney | Ran Bareket, Joseph Corso | ||||||
| 2021 | Scott Keeney | Ran Bareket | ||||||
(2) Amounts reflect Summary Compensation Table Total pay for our NEOs for each corresponding year.
(5) Peer Group TSR represents the cumulative return on a fixed investment of $100 in the S&P 600 Technology Hardware & Equipment (Industry Group) for the period beginning on the last trading day of fiscal year 2020 through the end of the applicable fiscal year, assuming reinvestment of dividends.
(3) Compensation Actually Paid (CAP) has been calculated based on the requirements and methodology set forth in the applicable SEC rules (Item 402(v) of Regulation S-K). The CAP calculation includes the end-of-year value of awards granted within the fiscal year, the change in fair value from prior year end of vested awards and the change in the fair value of unvested awards granted in prior years, regardless of if, when, or at which intrinsic value they will actually vest. To calculate CAP for 2025 the following amounts were deducted from and added to the total compensation number shown in the Summary Compensation Table (SCT):.
| Fiscal Year 2025 (For PEO) | Fiscal Year 2025 (Average For Non-PEO NEOs) | |||||||||||||||||||
PEO Summary Compensation Table Total(a) | $ | 37,333,189 | $ | 5,074,373 | ||||||||||||||||
Minus: Grant Date Fair Value of Equity Awards Granted in the Fiscal Year(b) | (36,085,997) | (4,397,666) | ||||||||||||||||||
Plus: Fair Value at Fiscal Year End of Outstanding and Unvested Equity Awards Granted in the Fiscal Year(c) | 61,315,275 | 9,309,142 | ||||||||||||||||||
Plus/(Minus): Change in Fair Value of Outstanding and Unvested Equity Awards Granted in Prior Fiscal Years(c) | 20,021,127 | 6,741,259 | ||||||||||||||||||
Plus: Fair Value at Vesting of Equity Awards Granted and Vested in the Fiscal Year(c) | — | — | ||||||||||||||||||
Plus/(Minus): Change in Fair Value as of the Vesting Date of Equity Awards Granted in Prior Fiscal Years that Vested in the Fiscal Year(c) | 6,014,045 | 2,109,805 | ||||||||||||||||||
| Total adjustments | 51,264,450 | 13,762,540 | ||||||||||||||||||
| Compensation Actually Paid | $ | 88,597,639 | $ | 18,836,913 | ||||||||||||||||
For purposes of the above adjustments, the fair value of equity awards on the applicable date were determined in accordance with FASB’s ASC Topic 718, using valuation methodologies that are generally consistent with those used to determine the grant-date fair value for accounting purposes.
_______________
a.We have not reported any amounts in our Summary Compensation Table with respect to “Change in Pension and Nonqualified Deferred Compensation” and, accordingly, the adjustments with respect to such items prescribed by the PvP rules are not relevant to our analysis and no adjustments have been made.
b.The amounts reflect the aggregate grant-date fair value reported in the “Stock Awards” column in the Summary Compensation Table for the applicable year.
c.In accordance with PvP Rules, the fair values of unvested and outstanding equity awards to our PEO were remeasured as of the end of each fiscal year, and as of each vesting date, during the years displayed in the table above. The assumptions used for determining the fair values shown in this table do not differ materially from those used to determine the fair values disclosed as of the grant date of such awards. Please see “Accounting Assumption Disclosures” for further discussion on the assumptions used for these remeasurements.
•Product Gross Margin
•Adjusted EBITDA
•Relative TSR
(4) Total Shareholder Return (TSR) represents the cumulative return on a fixed investment of $100 in our common stock, for the period beginning on the last trading day of fiscal year 2020 through the end of the applicable fiscal year, assuming reinvestment of dividends.
(6) The dollar amounts reported are our net income as reflected in our audited financial statements.
(7) In our assessment, total revenue is the financial performance measure that is the most important financial performance measure (other than total shareholder return) used by us in 2025 to link compensation actually paid to performance.