Pay vs Performance Disclosure
Dec. 31, 2025
USD ($)
Dec. 31, 2024
USD ($)
Dec. 31, 2023
USD ($)
Dec. 31, 2022
USD ($)
Dec. 31, 2021
USD ($)
The following table should be read in conjunction with the related footnotes set forth below and the information under the captions “Compensation Discussion and Analysis” beginning on page 47 and “Executive Compensation—Summary Compensation Table” on page 71. We summarize below the pay versus performance information for the fiscal years ended December 31, 2025 and 2024 for each of Messrs. Serrano and Mah and Ms. Nario-Eng, for the fiscal year ended December 31, 2023 for each of Messrs. Serrano and Mah, Nathan R. Reese and Ms. Nario-Eng and for the fiscal years ended December 31, 2022 and 2021 for each of Messrs. Mumma, Serrano and Reese and Ms. Nario-Eng.
| Value of Initial Fixed $100 Investment Based On: | ||||||||||||||||||||||||||||||||||||||||||||||||||
| Year | Summary Compensation Table Total for PEO (1) | Compensation Actually Paid to PEO (1) (2) | Average Summary Compensation Table Total for Non-PEO NEOs (3) | Average Compensation Actually Paid to Non-PEO NEOs (3) (4) | Total Shareholder Return (5) | Peer Group Total Shareholder Return (6) | Net Income (Loss) Attributable to Company's Common Stockholders ($ in Thousands) | Economic Return on Adjusted Book Value (7) | ||||||||||||||||||||||||||||||||||||||||||
| 2025 | $ | 8,175,251 | $ | 10,961,622 | $ | 4,189,308 | $ | 5,410,951 | $ | 91.34 | $ | 113.98 | $ | 101,106 | 11.0 | % | ||||||||||||||||||||||||||||||||||
| 2024 | $ | 3,905,297 | $ | 1,432,346 | $ | 2,246,770 | $ | 1,028,632 | $ | 66.96 | $ | 98.24 | $ | (103,785) | (11.9) | % | ||||||||||||||||||||||||||||||||||
| 2023 | $ | 5,646,654 | $ | 3,503,505 | $ | 2,307,213 | $ | 1,263,951 | $ | 83.07 | $ | 97.89 | $ | (90,035) | (12.8) | % | ||||||||||||||||||||||||||||||||||
| 2022 | $ | 4,770,331 | $ | 3,545,666 | $ | 1,539,435 | $ | 956,995 | $ | 87.66 | $ | 84.86 | $ | (340,577) | (7.4) | % | ||||||||||||||||||||||||||||||||||
| 2021 | $ | 5,384,052 | $ | 4,233,385 | $ | 2,667,344 | $ | 2,145,690 | $ | 110.65 | $ | 115.64 | $ | 144,176 | 8.7 | % | ||||||||||||||||||||||||||||||||||
(1)Amounts include compensation paid to Mr. Serrano as Chief Executive Officer for the years ended December 31, 2025, 2024 and 2023 and as Chief Executive Officer and President for the year ended December 31, 2022 and to Mr. Mumma as Chief Executive Officer for the year ended December 31, 2021. Mr. Mumma served as our Executive Chairman for the year ended December 31, 2022.
Amounts include compensation paid to Mr. Mah and Ms. Nario-Eng for the years ended December 31, 2025 and 2024, Messrs. Mah and Reese and Ms. Nario-Eng for the year ended December 31, 2023, Messrs. Mumma and Reese and Ms. Nario-Eng for the year ended December 31, 2022 and to Messrs. Serrano and Reese and Ms. Nario-Eng for the year ended December 31, 2021. Mr. Mah became an NEO on January 1, 2023. Nathan R. Reese ceased serving as the Company’s Chief Operating Officer, effective April 26, 2023.
(2)The following table reconciles Summary Compensation Table Total to Compensation Actually Paid for our PEO for the years ended December 31, 2025, 2024, 2023, 2022 and 2021:
| 2025 | 2024 | 2023 | 2022 | 2021 | |||||||||||||||||||||||||
| Reported Summary Compensation Table Total | $ | 8,175,251 | $ | 3,905,297 | $ | 5,646,654 | $ | 4,770,331 | $ | 5,384,052 | |||||||||||||||||||
| Adjustments: | |||||||||||||||||||||||||||||
| Deduction for amounts reported under the Stock Awards Column of Summary Compensation Table | (4,102,962) | (1,911,662) | (3,112,565) | (2,397,554) | (3,169,451) | ||||||||||||||||||||||||
| Increase for fair value at year-end of awards granted during year that remain unvested as of year-end | 6,786,157 | 1,490,064 | 2,074,360 | 2,020,131 | 3,377,393 | ||||||||||||||||||||||||
Increase (deduction) for change in fair value of awards granted in prior years that are outstanding and unvested as of year-end | 449,501 | (1,143,420) | (586,166) | (822,869) | (705,433) | ||||||||||||||||||||||||
Deduction for change in fair value from prior year-end to vesting date of awards granted in prior years that vested during the year | (257) | (5,321) | (518,778) | (24,373) | (653,176) | ||||||||||||||||||||||||
| Deduction for fair value at prior year-end of awards granted in prior years that failed to meet the applicable vesting conditions | (346,068) | (902,612) | — | — | — | ||||||||||||||||||||||||
| Total Adjustments | 2,786,371 | (2,472,951) | (2,143,149) | (1,224,665) | (1,150,667) | ||||||||||||||||||||||||
| Compensation Actually Paid | $ | 10,961,622 | $ | 1,432,346 | $ | 3,503,505 | $ | 3,545,666 | $ | 4,233,385 | |||||||||||||||||||
| 2025 | 2024 | 2023 | 2022 | 2021 | |||||||||||||||||||||||||
| Reported Average Summary Compensation Table Total | $ | 4,189,308 | $ | 2,246,770 | $ | 2,307,213 | $ | 1,539,435 | $ | 2,667,344 | |||||||||||||||||||
| Adjustments: | |||||||||||||||||||||||||||||
| Deduction for amounts reported under the Stock Awards Column of Summary Compensation Table | (1,769,028) | (1,035,031) | (1,037,522) | (474,366) | (1,447,278) | ||||||||||||||||||||||||
| Increase for fair value at year-end of awards granted during year that remain unvested as of year-end | 2,925,912 | 806,764 | 691,453 | 383,690 | 1,543,897 | ||||||||||||||||||||||||
Increase (deduction) for change in fair value of awards granted in prior years that are outstanding and unvested as of year-end | 237,903 | (560,087) | (180,960) | (433,587) | (334,265) | ||||||||||||||||||||||||
Deduction for change in fair value from prior year-end to vesting date of awards granted in prior years that vested during the year | (110) | (2,415) | (177,659) | (58,177) | (284,008) | ||||||||||||||||||||||||
| Deduction for fair value at prior year-end of awards granted in prior years that failed to meet the applicable vesting conditions | (173,034) | (427,369) | (338,574) | — | — | ||||||||||||||||||||||||
| Total Adjustments | 1,221,643 | (1,218,138) | (1,043,262) | (582,440) | (521,654) | ||||||||||||||||||||||||
| Average Compensation Actually Paid | $ | 5,410,951 | $ | 1,028,632 | $ | 1,263,951 | $ | 956,995 | $ | 2,145,690 | |||||||||||||||||||
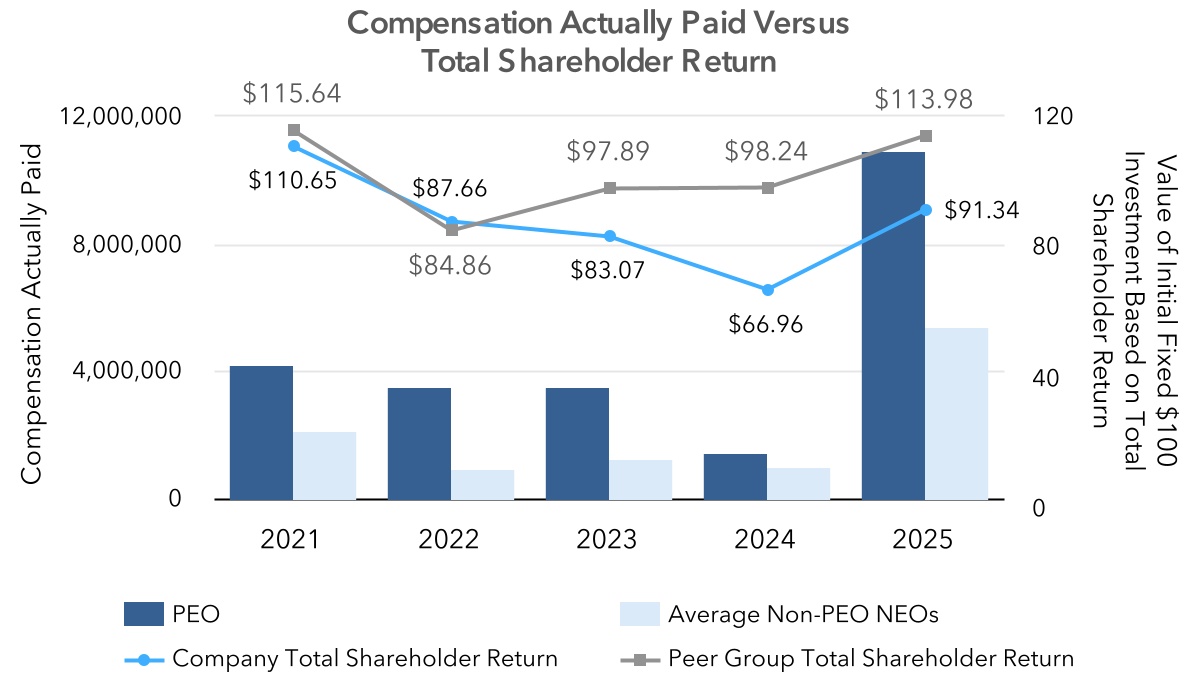
Total Shareholder Return
The following graph illustrates the relationship between compensation actually paid to our NEOs and Company and peer group total shareholder return on a cumulative basis assuming investment of $100 on December 31, 2019:
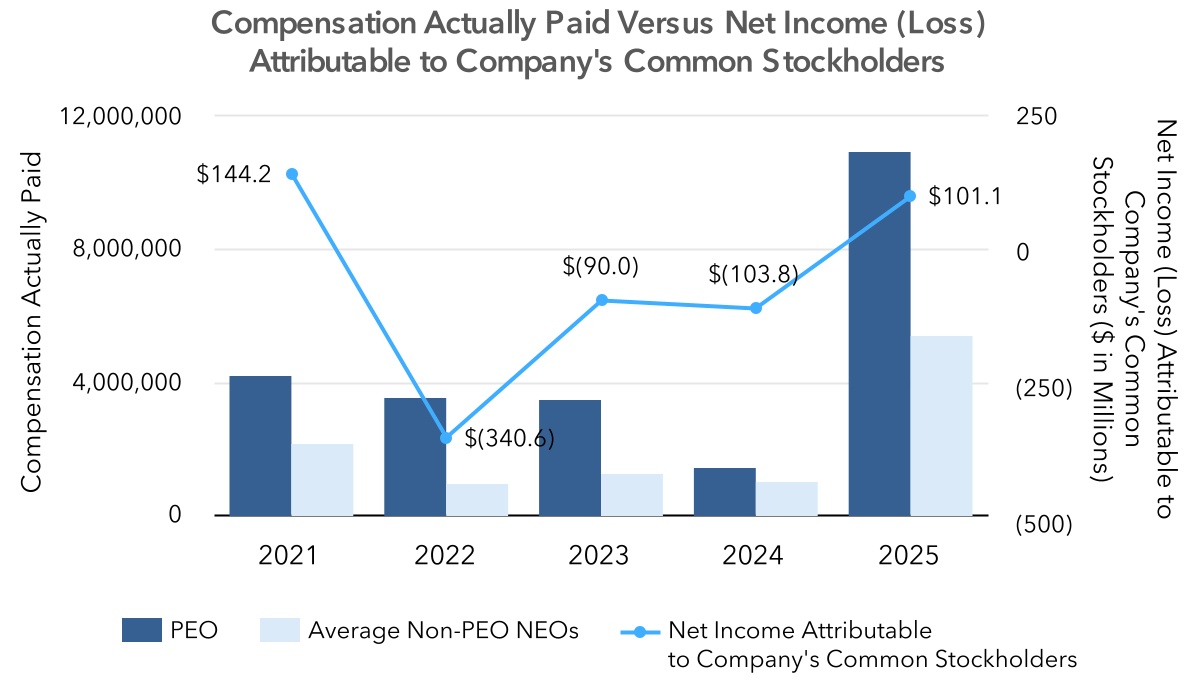
Net Income Attributable to Company's Common Stockholders
The following graph illustrates the relationship between compensation actually paid to our NEOs and our net income attributable to Company's common stockholders on an annual basis:
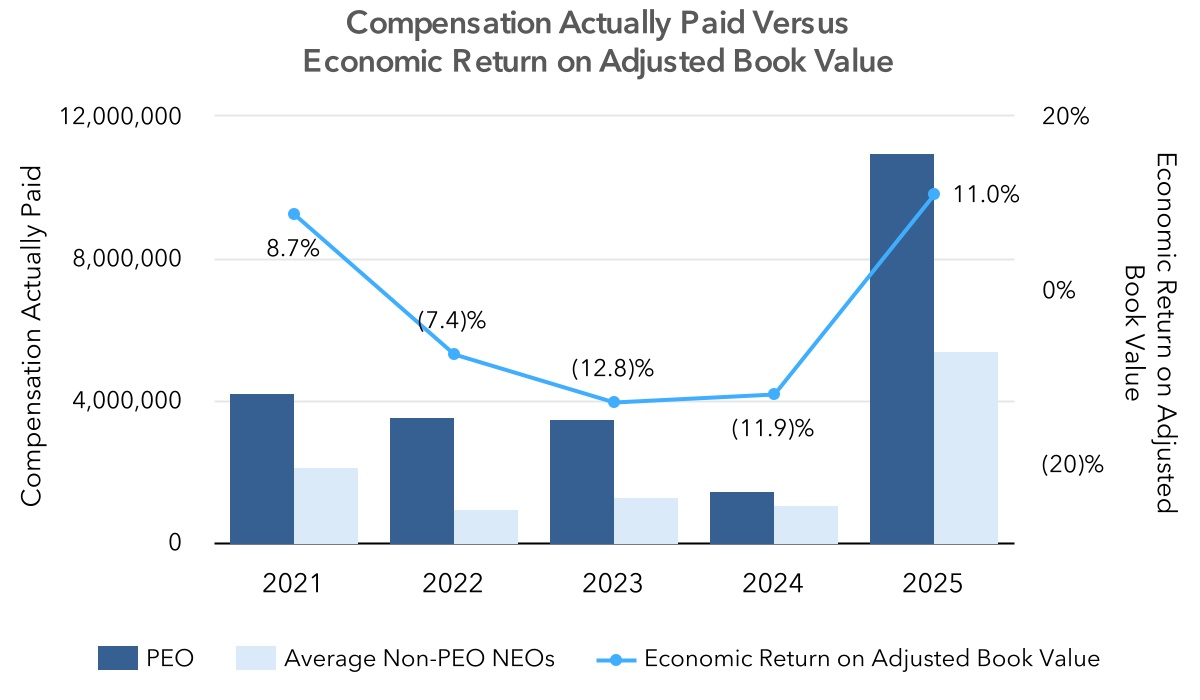
Economic Return on Adjusted Book Value
The following graph illustrates the relationship between compensation actually paid to our NEOs and our economic return on adjusted book value on an annual basis: