Pay vs Performance Disclosure - USD ($)
May 02, 2023
Dec. 31, 2023
Dec. 31, 2025
Dec. 31, 2024
Dec. 31, 2023
Pay Versus Performance
As required by Item 402(v) of Regulation S-K, we are providing the following information regarding the relationship between executive compensation and the company’s financial performance for each of the three years in the period ended December 31, 2025. As indicated above, we are permitted to report as a “smaller reporting company” under SEC rules. Accordingly, we have not included a tabular list of financial performance measures, and the table below (i) only includes the requisite information for three years, (ii) does not include information with respect to peer total stockholder return (“TSR”), and (iii) does not include a column for a Company-Selected Measure as defined in Item 402(v) of Regulation S-K. In accordance with applicable SEC rules, the adjustments described and quantified below were made to the values reported in the Summary Compensation Table for each applicable year to determine the “actual” compensation paid to our principal executive officers (“PEOs”) and the average “actual” compensation paid to our other non-PEO Named Executive Officers (“non-PEO NEOs”).
The following table summarizes compensation values reported in the Summary Compensation Table for our PEOs and the average for our other non-PEO NEOs, as compared to “compensation actually paid” (“CAP”) and the company’s financial performance for the years ended December 31, 2025, 2024, and 2023:
Year (a) | Summary Compensation Table Total for First PEO(1) (b) | Summary Compensation Table Total for Second PEO(1) (b) | Compensation Actually Paid to First PEO(1)(2) (c) | Compensation Actually Paid to Second PEO(1)(2) (c) | Average Summary Compensation Table Total for Non-PEO NEOs(1) (d) | Average Compensation Actually Paid to Non-PEO NEOs(1)(2) (e) | Value of Initial Fixed $100 Investment Based On TSR (f) | Net Income (Loss) (g) | ||||||||||||||||
2025 | $6,932,933 | — | $4,222,916 | — | $4,223,883 | $3,616,580 | $1.97 | $32,051,000 | ||||||||||||||||
2024 | $3,863,800 | — | $3,568,123 | — | $3,013,855 | $2,728,243 | $8.07 | $(40,912,000) | ||||||||||||||||
2023 | $1,625,988 | $50,000 | $1,625,988 | $50,000 | $2,564,945 | $2,058,802 | $11.10 | $(79,080,000) | ||||||||||||||||
(1) | The first PEO and, if applicable, the second PEO reflected in the table for each of 2025, 2024, and 2023 are as follows: 2025: Edward Kovalik (First PEO) and Second PEO not applicable |
2025: Edward Kovalik (First PEO) and Second PEO not applicable
2024: Edward Kovalik (First PEO) and Second PEO not applicable
2023: Edward Kovalik (First PEO) and John D. Maatta (Second PEO)
The non-PEO NEOs reflected in the table for each of 2025, 2024 and 2023 are as follows: 2025: Gary C. Hanna, Craig Owen and Gregory S. Patton
2025: Gary C. Hanna, Craig Owen and Gregory S. Patton
2024: Gary C. Hanna and Craig Owen
2023: Gary C. Hanna and Craig Owen
(2) | The company deducted from and added to the Summary Compensation Table total compensation the following amounts to calculate CAP in accordance with Item 402(v) of Regulation S-K as disclosed in columns (c) and (e) for our PEOs and non-PEO NEOs in each respective year. |
2025 | 2024 | 2023 | |||||||
FIRST PEO SUMMARY COMPENSATION TABLE TOTALS. | $6,932,933 | $3,863,800 | $1,625,988 | ||||||
Add (Subtract): | |||||||||
Fair value of equity awards granted during the year from the Summary Compensation Table | (5,616,733) | (2,750,000) | — | ||||||
Fair value at year end of equity awards granted during the year | 2,906,716 | 2,454,323 | — | ||||||
Change in fair value of equity awards granted in prior years that were unvested as of the end of the year | — | — | — | ||||||
Change in fair value of equity awards granted in current year that vested during the year | — | — | — | ||||||
Change in fair value of equity awards granted in prior years that vested during the year | — | — | — | ||||||
Equity awards granted in prior years that were forfeited during the year | — | — | — | ||||||
Dividends or other earnings paid on equity awards during the year | — | — | — | ||||||
Total Equity Award Related Adjustments | $(2,710,018) | (295,677) | $— | ||||||
COMPENSATION ACTUALLY PAID TOTALS | $4,222,916 | $3,568,123 | $1,625,988 | ||||||
2023 | |||
SECOND PEO SUMMARY COMPENSATION TABLE TOTALS | $50,000 | ||
Add (Subtract): | |||
Fair value of equity awards granted during the year from the Summary Compensation Table | — | ||
Fair value at year end of equity awards granted during the year | — | ||
Change in fair value of equity awards granted in prior years that were unvested as of the end of the year | — | ||
Change in fair value of equity awards granted in current year that vested during the year | — | ||
Change in fair value of equity awards granted in prior years that vested during the year | — | ||
Equity awards granted in prior years that were forfeited during the year | — | ||
Dividends or other earnings paid on equity awards during the year | — | ||
Total Equity Award Related Adjustments | — | ||
COMPENSATION ACTUALLY PAID TOTALS | $50,000 | ||
2025 | 2024 | 2023 | |||||||
NON-PEO NEOS SUMMARY COMPENSATION TABLE TOTALS | $4,223,883 | $3,013,855 | $2,564,945 | ||||||
Add (Subtract): | |||||||||
Fair value of equity awards granted during the year from the Summary Compensation Table | (3,184,511) | (1,900,000) | (1,457,143) | ||||||
Fair value at year end of equity awards granted during the year | 2,577,208 | 1,614,388 | 951,000 | ||||||
Change in fair value of equity awards granted in prior years that were unvested as of the end of the year | — | — | — | ||||||
Change in fair value of equity awards granted in current year that vested during the year | — | — | — | ||||||
Change in fair value of equity awards granted in prior years that vested during the year | — | — | — | ||||||
Equity awards granted in prior years that were forfeited during the year | — | — | — | ||||||
Dividends or other earnings paid on equity awards during the year | — | — | — | ||||||
Total Equity Award Related Adjustments | $(607,303) | $(285,612) | $(506,143) | ||||||
COMPENSATION ACTUALLY PAID TOTALS | $3,616,580 | $2,728,243 | $2,058,802 | ||||||
(1) | The first PEO and, if applicable, the second PEO reflected in the table for each of 2025, 2024, and 2023 are as follows: 2025: Edward Kovalik (First PEO) and Second PEO not applicable |
2025: Edward Kovalik (First PEO) and Second PEO not applicable
2024: Edward Kovalik (First PEO) and Second PEO not applicable
2023: Edward Kovalik (First PEO) and John D. Maatta (Second PEO)
The non-PEO NEOs reflected in the table for each of 2025, 2024 and 2023 are as follows: 2025: Gary C. Hanna, Craig Owen and Gregory S. Patton
2025: Gary C. Hanna, Craig Owen and Gregory S. Patton
2024: Gary C. Hanna and Craig Owen
2023: Gary C. Hanna and Craig Owen
(2) | The company deducted from and added to the Summary Compensation Table total compensation the following amounts to calculate CAP in accordance with Item 402(v) of Regulation S-K as disclosed in columns (c) and (e) for our PEOs and non-PEO NEOs in each respective year. |
2025 | 2024 | 2023 | |||||||
FIRST PEO SUMMARY COMPENSATION TABLE TOTALS. | $6,932,933 | $3,863,800 | $1,625,988 | ||||||
Add (Subtract): | |||||||||
Fair value of equity awards granted during the year from the Summary Compensation Table | (5,616,733) | (2,750,000) | — | ||||||
Fair value at year end of equity awards granted during the year | 2,906,716 | 2,454,323 | — | ||||||
Change in fair value of equity awards granted in prior years that were unvested as of the end of the year | — | — | — | ||||||
Change in fair value of equity awards granted in current year that vested during the year | — | — | — | ||||||
Change in fair value of equity awards granted in prior years that vested during the year | — | — | — | ||||||
Equity awards granted in prior years that were forfeited during the year | — | — | — | ||||||
Dividends or other earnings paid on equity awards during the year | — | — | — | ||||||
Total Equity Award Related Adjustments | $(2,710,018) | (295,677) | $— | ||||||
COMPENSATION ACTUALLY PAID TOTALS | $4,222,916 | $3,568,123 | $1,625,988 | ||||||
2023 | |||
SECOND PEO SUMMARY COMPENSATION TABLE TOTALS | $50,000 | ||
Add (Subtract): | |||
Fair value of equity awards granted during the year from the Summary Compensation Table | — | ||
Fair value at year end of equity awards granted during the year | — | ||
Change in fair value of equity awards granted in prior years that were unvested as of the end of the year | — | ||
Change in fair value of equity awards granted in current year that vested during the year | — | ||
Change in fair value of equity awards granted in prior years that vested during the year | — | ||
Equity awards granted in prior years that were forfeited during the year | — | ||
Dividends or other earnings paid on equity awards during the year | — | ||
Total Equity Award Related Adjustments | — | ||
COMPENSATION ACTUALLY PAID TOTALS | $50,000 | ||
(2) | The company deducted from and added to the Summary Compensation Table total compensation the following amounts to calculate CAP in accordance with Item 402(v) of Regulation S-K as disclosed in columns (c) and (e) for our PEOs and non-PEO NEOs in each respective year. |
2025 | 2024 | 2023 | |||||||
NON-PEO NEOS SUMMARY COMPENSATION TABLE TOTALS | $4,223,883 | $3,013,855 | $2,564,945 | ||||||
Add (Subtract): | |||||||||
Fair value of equity awards granted during the year from the Summary Compensation Table | (3,184,511) | (1,900,000) | (1,457,143) | ||||||
Fair value at year end of equity awards granted during the year | 2,577,208 | 1,614,388 | 951,000 | ||||||
Change in fair value of equity awards granted in prior years that were unvested as of the end of the year | — | — | — | ||||||
Change in fair value of equity awards granted in current year that vested during the year | — | — | — | ||||||
Change in fair value of equity awards granted in prior years that vested during the year | — | — | — | ||||||
Equity awards granted in prior years that were forfeited during the year | — | — | — | ||||||
Dividends or other earnings paid on equity awards during the year | — | — | — | ||||||
Total Equity Award Related Adjustments | $(607,303) | $(285,612) | $(506,143) | ||||||
COMPENSATION ACTUALLY PAID TOTALS | $3,616,580 | $2,728,243 | $2,058,802 | ||||||
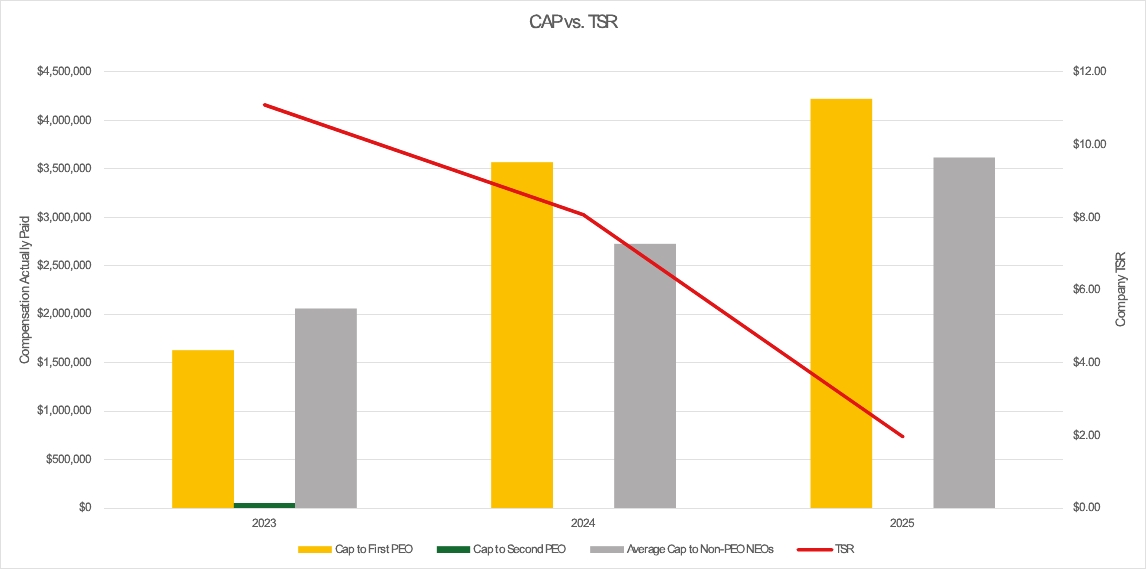
The following graph illustrates the relationship between CAP for our PEOs and average CAP for our non-PEO NEOs and the cumulative TSR on our common stock. The cumulative TSR presented below assumes a $100 investment on December 31, 2023, 2024 and 2025 and the reinvestment of dividends for each year presented below.
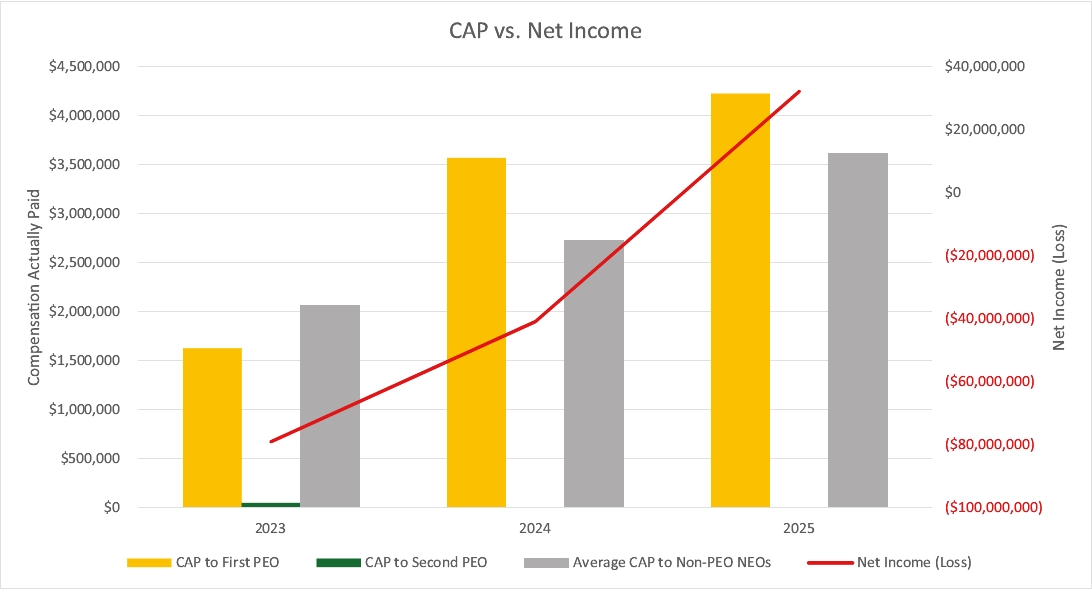
The following graph illustrates the relationship between CAP for our PEOs and average CAP for our non-PEO NEOs and the Company’s net income (loss) for each of the years ended December 31, 2023, 2024 and 2025.