Pay vs Performance Disclosure
Dec. 28, 2025
USD ($)
$ / shares
Dec. 29, 2024
USD ($)
$ / shares
Dec. 31, 2023
USD ($)
$ / shares
Dec. 25, 2022
USD ($)
$ / shares
Dec. 26, 2021
USD ($)
$ / shares
Pay Versus Performance Table
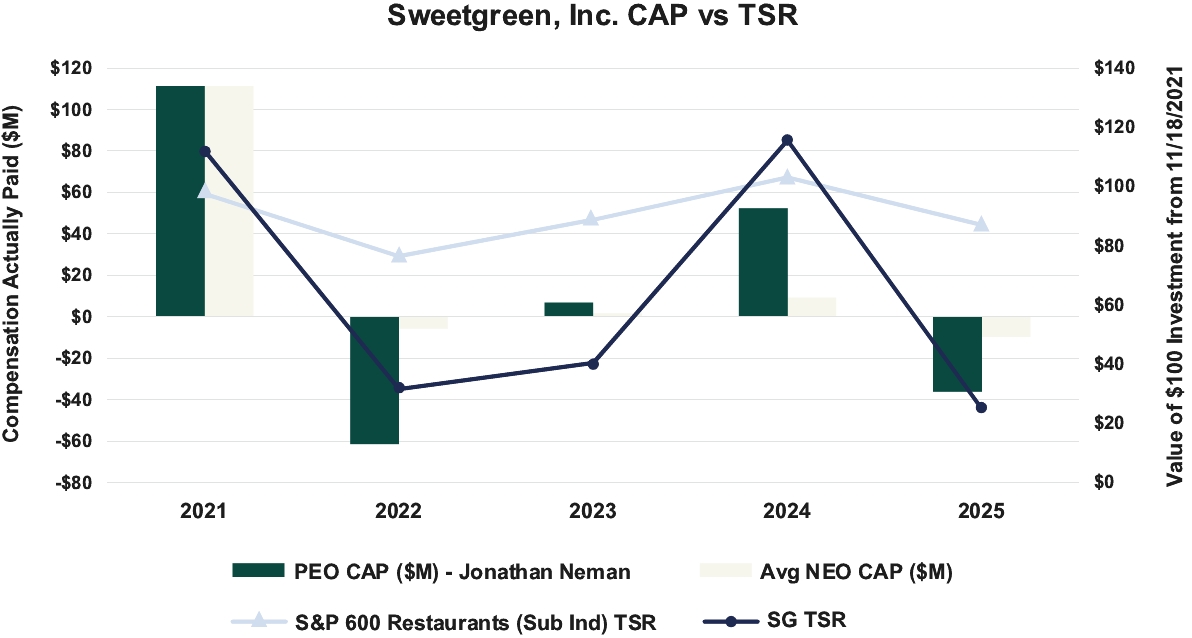
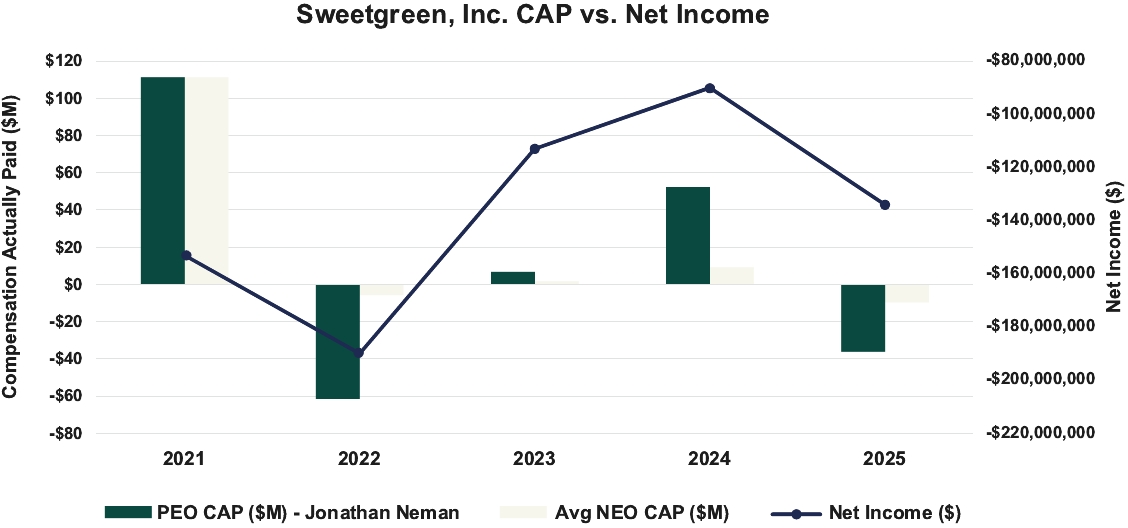
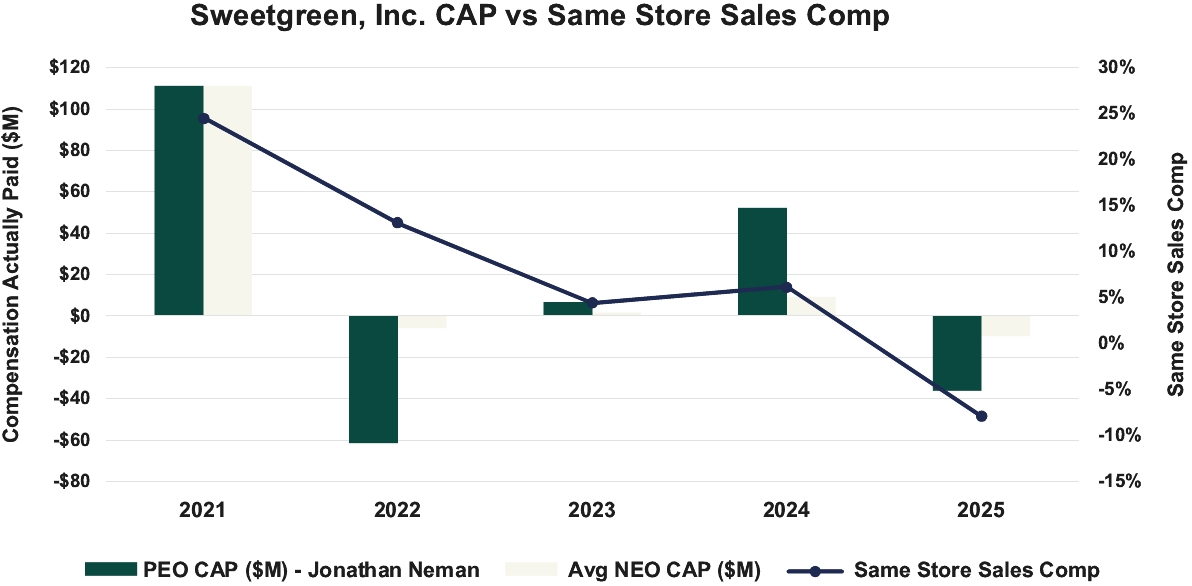
The following table sets forth additional compensation information of our Principal Executive Officer (“PEO”) and our non-PEO NEOs, along with total shareholder return (“TSR”), net income, and Same-Store Sales Change performance results, for our fiscal years ending in 2021, 2022, 2023, 2024, and 2025:
Year(1) | Summary Compensation Table Total for PEO ($) | Compensation Actually Paid to PEO(2)(3) ($) | Average Summary Compensation Table Total for non-PEO NEOs ($) | Average Compensation Actually Paid to non-PEO NEOs(2)(3) ($) | Value of Initial Fixed $100 Investment Based On: | Net Income (Loss) ($) | Same-Store Sales Change(6) (%) | |||||||||||||||||||
Total Shareholder Return(5) ($) | Peer Group Total Shareholder Return(5) ($) | |||||||||||||||||||||||||
2025 | 3,226,081 | (36,146,134) (4) | 2,925,944 | (9,702,306) (4) | 25 | 87 | (134,065,000) | (7.9) | ||||||||||||||||||
2024 | 910,550 | 52,279,549 (4) | 2,173,466 | 9,187,848 (4) | 116 | 103 | (90,373,000) | 6.2 | ||||||||||||||||||
2023 | 622,548 | 6,744,537 (4) | 1,080,321 | 1,570,321 (4) | 40 | 89 | (113,384,000) | 4.4 | ||||||||||||||||||
2022 | 350,144 | (61,516,400) (4) | 649,693 | (5,807,584) (4) | 32 | 76 | (190,441,000) | 13.1 | ||||||||||||||||||
2021 | 38,834,483 | 111,254,241 (4) | 38,814,481 | 111,234,239 (4) | 112 | 98 | (153,175,000) | 24.6 | ||||||||||||||||||
(1) | Our PEO and other NEOs included in the above compensation columns reflect the following: |
Year | PEO | Non-PEOs | ||||||
2025 | Jonathan Neman | Jamie McConnell, Nicolas Jammet, Jason Cochran, Mitch Reback | ||||||
2024 | Jonathan Neman | Mitch Reback, Wouleta Ayele, Adrienne Gemperle, and Rossann Williams | ||||||
2023 | Jonathan Neman | Mitch Reback, Wouleta Ayele, Adrienne Gemperle, and Jim McPhail | ||||||
2022 | Jonathan Neman | Mitch Reback, Wouleta Ayele, Jim McPhail, and Daniel Shlossman | ||||||
2021 | Jonathan Neman | Nicolas Jammet and Nathaniel Ru | ||||||
(2) | Except as described in footnote (3) below, fair value or change in fair value, as applicable, of equity awards in the “Compensation Actually Paid” columns was calculated in accordance with ASC Topic 718, and the valuation methods used to calculate the fair values did not materially differ from those disclosed at the time of grant. |
(3) | For the portion of “Compensation Actually Paid” that represents compensation based on year-end stock prices, the following prices were used: for 2025, $6.97 (78% reduction from prior year): for 2024, $32.37 (186% increase from prior year), for 2023, $11.30 (28% increase from prior year); for 2022, $8.83 (72% reduction from prior year); and for 2021, $31.36 (304% increase from IPO date). |
(4) | “Compensation Actually Paid” to our PEO (Jonathan Neman) and the average “Compensation Actually Paid” to our non-PEO NEOs in 2025, 2024, 2023, 2022, and 2021 reflect the following adjustments from total compensation reported in the Summary Compensation Table (in thousands): |
2025 | 2024 | 2023 | 2022 | 2021 | ||||||||||||||||||||||||||||
PEO | Average Non-PEO | PEO | Average Non-PEO | PEO | Average Non-PEO | PEO | Average Non-PEO | PEO | Average Non-PEO | |||||||||||||||||||||||
Total Reported in Summary Compensation Table (SCT) | $3,226,081 | $2,925,944 | $910,550 | $2,173,466 | $622,548 | $1,080,321 | $350,144 | $649,693 | $38,834,483 | $38,814,481 | ||||||||||||||||||||||
Less, Value of Stock and Option Awards reported in SCT | ($2,675,937) | ($2,614,069) | — | $(1,445,702) | — | $(555,610) | — | $(240,953) | $(38,142,732) | $(38,142,732) | ||||||||||||||||||||||
Plus, Year-End Fair Value of Awards Granted During Fiscal Year that are Unvested and Outstanding | $200,488 | $968,450 | — | $4,546,299 | — | $612,484 | — | $68,574 | $77,526,763 | $77,526,763 | ||||||||||||||||||||||
Plus, Change in Fair Value (from Prior Fiscal Year-End to Current Fiscal Year-End) of Prior Year Awards that are Outstanding and Unvested | ($37,363,830) | ($9,620,691) | $30,769,608 | $1,937,709 | $5,878,490 | $232,898 | $(57,677,180) | $(4,941,831) | $7,770,827 | $7,770,827 | ||||||||||||||||||||||
Plus, Vesting Date Fair Value of Awards Granted During Fiscal Year and that Vested During Fiscal Year | $468,253 | $96,181 | — | $418,991 | — | $28,967 | — | $21,083 | — | — | ||||||||||||||||||||||
Plus, Change in Fair Value (from Prior Fiscal Year-End to Vesting Date) of Prior Year Awards that Vested During Fiscal Year | ($1,190) | ($815,842) | $20,599,391 | $1,557,085 | $243,499 | $171,261 | $(4,189,364) | $(1,364,150) | $25,264,900 | $25,264,900 | ||||||||||||||||||||||
Less Prior Year Fair Value of Prior Year Awards that Failed to Vest this Year | — | ($642,278) | — | — | — | — | — | — | — | — | ||||||||||||||||||||||
Total Adjustments | ($39,372,215) | ($12,628,250) | $51,368,999 | $7,014,382 | $6,121,989 | $490,000 | $(61,866,544) | $(6,457,277) | $72,419,758 | $72,419,758 | ||||||||||||||||||||||
“Compensation Actually Paid” for Fiscal Year | ($36,146,134) | ($9,702,306) | $52,279,549 | $9,187,848 | $6,744,537 | $1,570,321 | $(61,516,400) | $(5,807,584) | $111,254,241 | $111,234,239 | ||||||||||||||||||||||
(5) | Peer group TSR reflects the S&P 600 Restaurants Index as reflected in our 2025 Form 10-K pursuant to Item 201(e) of Regulation S-K. Each year reflects what the cumulative value of $100 would be, including reinvestment of dividends, if such amount were invested on our IPO date of November 19, 2021 through the last day of the fiscal year presented. |
(6) | As required by Item 402(v) of Regulation S-K, we have determined that Same-Store Sales Change is the Company-Selected Measure, the calculation of which is described in our Annual Report on Form 10-K for the year ended December 28, 2025. Same-Store Sales Change may not have been the most important financial performance measure for years prior to 2025 and we may determine a different financial performance measure to be the most important financial performance measure in future years. |
(1) | Our PEO and other NEOs included in the above compensation columns reflect the following: |
Year | PEO | Non-PEOs | ||||||
2025 | Jonathan Neman | Jamie McConnell, Nicolas Jammet, Jason Cochran, Mitch Reback | ||||||
2024 | Jonathan Neman | Mitch Reback, Wouleta Ayele, Adrienne Gemperle, and Rossann Williams | ||||||
2023 | Jonathan Neman | Mitch Reback, Wouleta Ayele, Adrienne Gemperle, and Jim McPhail | ||||||
2022 | Jonathan Neman | Mitch Reback, Wouleta Ayele, Jim McPhail, and Daniel Shlossman | ||||||
2021 | Jonathan Neman | Nicolas Jammet and Nathaniel Ru | ||||||
(5) | Peer group TSR reflects the S&P 600 Restaurants Index as reflected in our 2025 Form 10-K pursuant to Item 201(e) of Regulation S-K. Each year reflects what the cumulative value of $100 would be, including reinvestment of dividends, if such amount were invested on our IPO date of November 19, 2021 through the last day of the fiscal year presented. |
(4) | “Compensation Actually Paid” to our PEO (Jonathan Neman) and the average “Compensation Actually Paid” to our non-PEO NEOs in 2025, 2024, 2023, 2022, and 2021 reflect the following adjustments from total compensation reported in the Summary Compensation Table (in thousands): |
2025 | 2024 | 2023 | 2022 | 2021 | ||||||||||||||||||||||||||||
PEO | Average Non-PEO | PEO | Average Non-PEO | PEO | Average Non-PEO | PEO | Average Non-PEO | PEO | Average Non-PEO | |||||||||||||||||||||||
Total Reported in Summary Compensation Table (SCT) | $3,226,081 | $2,925,944 | $910,550 | $2,173,466 | $622,548 | $1,080,321 | $350,144 | $649,693 | $38,834,483 | $38,814,481 | ||||||||||||||||||||||
Less, Value of Stock and Option Awards reported in SCT | ($2,675,937) | ($2,614,069) | — | $(1,445,702) | — | $(555,610) | — | $(240,953) | $(38,142,732) | $(38,142,732) | ||||||||||||||||||||||
Plus, Year-End Fair Value of Awards Granted During Fiscal Year that are Unvested and Outstanding | $200,488 | $968,450 | — | $4,546,299 | — | $612,484 | — | $68,574 | $77,526,763 | $77,526,763 | ||||||||||||||||||||||
Plus, Change in Fair Value (from Prior Fiscal Year-End to Current Fiscal Year-End) of Prior Year Awards that are Outstanding and Unvested | ($37,363,830) | ($9,620,691) | $30,769,608 | $1,937,709 | $5,878,490 | $232,898 | $(57,677,180) | $(4,941,831) | $7,770,827 | $7,770,827 | ||||||||||||||||||||||
Plus, Vesting Date Fair Value of Awards Granted During Fiscal Year and that Vested During Fiscal Year | $468,253 | $96,181 | — | $418,991 | — | $28,967 | — | $21,083 | — | — | ||||||||||||||||||||||
Plus, Change in Fair Value (from Prior Fiscal Year-End to Vesting Date) of Prior Year Awards that Vested During Fiscal Year | ($1,190) | ($815,842) | $20,599,391 | $1,557,085 | $243,499 | $171,261 | $(4,189,364) | $(1,364,150) | $25,264,900 | $25,264,900 | ||||||||||||||||||||||
Less Prior Year Fair Value of Prior Year Awards that Failed to Vest this Year | — | ($642,278) | — | — | — | — | — | — | — | — | ||||||||||||||||||||||
Total Adjustments | ($39,372,215) | ($12,628,250) | $51,368,999 | $7,014,382 | $6,121,989 | $490,000 | $(61,866,544) | $(6,457,277) | $72,419,758 | $72,419,758 | ||||||||||||||||||||||
“Compensation Actually Paid” for Fiscal Year | ($36,146,134) | ($9,702,306) | $52,279,549 | $9,187,848 | $6,744,537 | $1,570,321 | $(61,516,400) | $(5,807,584) | $111,254,241 | $111,234,239 | ||||||||||||||||||||||
Note: Sweetgreen’s TSR was not available in 2020.
Note: Sweetgreen’s TSR was not available in 2020.
Most Important Financial Performance Measures to Link Compensation Actually Paid
to Performance
The following performance measures reflect the Company’s most important performance measures in effect for fiscal year 2025:
• | Same-Store Sales Change |
• | Restaurant-Level Profit Margin |
• | Sweetgreen stock price performance |