Pay vs Performance Disclosure - USD ($)
|
5 Months Ended |
7 Months Ended |
12 Months Ended |
Dec. 31, 2025 |
Aug. 13, 2025 |
Dec. 31, 2025 |
Dec. 31, 2024 |
Dec. 31, 2023 |
| Pay vs Performance Disclosure |
|
|
|
|
|
|
|
| Pay vs Performance Disclosure, Table |
|
|
|
Pay Versus Performance In accordance with rules adopted by the SEC pursuant to the Dodd-Frank Act, we provide the following disclosure regarding executive compensation for our principal executive officer (“PEO”) and Non-PEO Named Executive Officers (“Non-PEO NEOs”) and our performance for the fiscal years listed below. Our compensation committee did not consider the pay versus performance disclosure below in making its pay decisions for any of the years shown. | Year(1) | | Summary
Compensation
Table Total
for PEO
RJ Tesi(1) | | Compensation
Actually
Paid to PEO
RJ Tesi(1)(2)(3) | | Summary
Compensation
Table Total
for PEO
David Moss(1) | | Compensation
Actually
Paid to PEO
David Moss(1)(2)(3) | | Average
Summary
Compensation
Table Total
for Non-PEO
NEOs(1) | | Average
Compensation
Actually
Paid
to Non-PEO
NEOs(1)(2)(3) | | Total
Shareholder
Return(4) | | Net Loss
(dollars
in millions) | | 2025 | | $ | 2,849,504 | | $ | 1,398,771 | | $ | 1,845,179 | | $ | 1,277,411 | | $ | 1,035,732 | | $ | 691,393 | | $ | (66.6 | ) | | $ | (46 | ) | | 2024 | | $ | 3,008,174 | | $ | 1,935,558 | | $ | — | | $ | — | | $ | 2,257,208 | | $ | 1,231,194 | | $ | (58.5 | ) | | $ | (42 | ) | | 2023 | | $ | 1,694,818 | | $ | 2,518,697 | | $ | — | | $ | — | | $ | 869,728 | | $ | 1,363,701 | | $ | 77.6 | | | $ | (30 | ) | ____________ (1) Raymond J. Tesi, M.D., was our PEO during 2023, 2024 and from January 1, 2025 through August 13, 2025 at which point he retired. David Moss was our PEO from August 13, 2025 through December 31, 2025. Amounts reported for each PEO reflect total compensation for the full year. The individuals comprising the Non-PEO NEOs for 2023 and 2024 are David Moss and Mark Lowdell. During 2025 the individuals comprising the Non-PEO NEO’s are Mark Lowdell and Cory Ellspermann. (2) The amounts shown for Compensation Actually Paid have been calculated in accordance with Item 402(v) of Regulation S-K and do not reflect compensation earned, realized, or received by our Named Executive Officers. These amounts reflect the Summary Compensation Table Total with certain adjustments as described in footnote 3 below. (3) Compensation Actually Paid reflects the exclusions and inclusions of certain amounts for our PEO and Non-PEO NEOs as set forth below. Equity values are calculated in accordance with FASB ASC Topic 718. Amounts in the Exclusion of Stock Awards and Option Awards column are the totals from the Stock Awards and Option Awards columns set forth in the Summary Compensation Table. | Year | | Summary
Compensation
Table Total
for PEO
RJ Tesi
($) | | Exclusion of
Stock Awards
and Option
Awards
for PEO
RJ Tesi
($) | | Inclusion of
Equity
Values for PEO
RJ Tesi
($) | | Compensation
Actually
Paid to PEO
RJ Tesi
($) | | 2025 | | 2,849,504 | | (2,363,396 | ) | | 912,663 | | 1,398,771 | | 2024 | | 3,008,174 | | (2,234,364 | ) | | 1,161,748 | | 1,935,558 | | 2023 | | 1,694,818 | | (1,194,318 | ) | | 2,018,197 | | 2,518,697 | | Year | | Summary
Compensation
Table Total
for PEO
David Moss
($) | | Exclusion of
Stock Awards
and Option
Awards
for PEO
David Moss
($) | | Inclusion of
Equity
Values
for PEO
David Moss
($) | | Compensation
Actually
Paid to PEO
David Moss
($) | | 2025 | | 1,845,179 | | (1,428,911 | ) | | 861,143 | | 1,277,411 | | Year | | Average
Summary
Compensation
Table
for Non-PEO
NEOs
($) | | Average
Exclusion of
Stock Awards
and Option
Awards
for Non-PEO
NEOs
($) | | Average
Inclusion of
Equity
Values
for Non-PEO
NEOs
($) | | Average
Compensation
Actually
Paid to
Non-PEO
NEOs
($) | | 2025 | | 1,035,732 | | (782,226 | ) | | 437,887 | | 691,393 | | 2024 | | 2,257,208 | | (1,883,840 | ) | | 857,826 | | 1,231,194 | | 2023 | | 869,728 | | (597,159 | ) | | 1,091,132 | | 1,363,701 | The amounts in the Inclusion of Equity Values in the tables above are derived from the amounts set forth in the following tables: | Year | | Year-End
Fair Value
of Equity
Awards
Granted
During
Year That
Remained
Unvested as
of Last Day
of Year
for PEO
RJ Tesi
($) | | Change in
Fair Value
from Last
Day of Prior
Year to Last
Day of Year
of Equity
Awards
Granted in
Prior Year
that are
Unvested as
of Last Day
of Year
for PEO
RJ Tesi
($) | | Vesting-Date
Fair Value
of Equity
Awards
Granted
During Year
that Vested
During Year
for PEO
RJ Tesi
($) | | Change in
Fair Value
from Last
Day of Prior
Year to
Vesting Date
of Equity
Awards
Grant in
Prior Year
that Vested
During Year
for PEO
RJ Tesi
($) | | Fair Value
at Last
Day of
Prior Year
of Equity
Awards
Forfeited
During Year
for PEO
RJ Tesi
($) | | Total –
Inclusion
of Equity
Values
for PEO
RJ Tesi
($) | | 2025 | | — | | (819,782 | ) | | 1,582,169 | | 150,276 | | | — | | 912,663 | | 2024 | | 1,462,365 | | (409,142 | ) | | 260,171 | | (151,646 | ) | | — | | 1,161,748 | | 2023 | | 1,466,856 | | 415,824 | | | — | | 135,517 | | | — | | 2,018,197 | | Year | | Year-End
Fair Value
of Equity
Awards
Granted
During
Year That
Remained
Unvested as
of the Last
Day of Year
for PEO
David Moss
($) | | Change in
Fair Value
from Last
Day of Prior
Year to Last
Day of Year
of Equity
Awards
Granted in
Prior Year
that are
Unvested as
of Last Day
of Year
for PEO
David Moss
($) | | Vesting-Date
Fair Value
of Equity
Awards
Granted
During Year
that Vested
During Year
for PEO
David Moss
($) | | Change in
Fair Value
from Last
Day of Prior
Year to
Vesting Date
of Equity
Awards
Grant in
Prior Year
that Vested
During Year
for PEO
David Moss
($) | | Fair Value at
Last Day of
Prior Year
of Equity
Awards
Forfeited
During Year
for PEO
David Moss
($) | | Total –
Inclusion
of Equity
Values
for PEO
David Moss
($) | | 2025 | | 1,049,660 | | (806,317 | ) | | 469,757 | | 148,043 | | — | | 861,143 | | Year | | Average
Year-End
Fair Value
of Equity
Awards
Granted
During
Year That
Remained
Unvested as
of Last Day
of Year
for Non-PEO
NEOs
($) | | Average
Change in
Fair Value
from Last
Day of Prior
Year to
Last Day
of Equity
Awards
Non-PEO
NEOs
($) | | Average
Vesting-Date
Fair Value
of Equity
Awards
Granted
During Year
that Vested
During Year
for Non-PEO
NEOs
($) | | Average
Change in
Fair Value
from Last
Day of Prior
Year to
Vesting Date
of Unvested
Equity
Awards
that Vested
During Year
for Non-PEO
NEOs
($) | | Average Fair
Value at
Last Day of
Prior Year
of Equity
Awards
Forfeited
During Year
for Non-PEO
NEOs
($) | | Total –
Inclusion
of Equity
Values
for Non-PEO
NEOs
($) | | 2025 | | 629,748 | | (409,556 | ) | | 179,254 | | 38,441 | | | — | | 437,887 | | 2024 | | 1,220,680 | | (233,433 | ) | | — | | (129,421 | ) | | — | | 857,826 | | 2023 | | 733,428 | | 276,026 | | | — | | 81,678 | | | — | | 1,091,132 | (4) The Company TSR assumes $100 was invested in the Company for the period starting December 31, 2022 through the end of the listed year. Historical stock performance is not necessarily indicative of future stock performance. |
|
|
|
| Named Executive Officers, Footnote |
|
|
|
The amounts shown for Compensation Actually Paid have been calculated in accordance with Item 402(v) of Regulation S-K and do not reflect compensation earned, realized, or received by our Named Executive Officers. These amounts reflect the Summary Compensation Table Total with certain adjustments as described in footnote 3 below.
|
|
|
|
| Adjustment To PEO Compensation, Footnote |
|
|
|
| Year | | Summary
Compensation
Table Total
for PEO
RJ Tesi
($) | | Exclusion of
Stock Awards
and Option
Awards
for PEO
RJ Tesi
($) | | Inclusion of
Equity
Values for PEO
RJ Tesi
($) | | Compensation
Actually
Paid to PEO
RJ Tesi
($) | | 2025 | | 2,849,504 | | (2,363,396 | ) | | 912,663 | | 1,398,771 | | 2024 | | 3,008,174 | | (2,234,364 | ) | | 1,161,748 | | 1,935,558 | | 2023 | | 1,694,818 | | (1,194,318 | ) | | 2,018,197 | | 2,518,697 | | Year | | Summary
Compensation
Table Total
for PEO
David Moss
($) | | Exclusion of
Stock Awards
and Option
Awards
for PEO
David Moss
($) | | Inclusion of
Equity
Values
for PEO
David Moss
($) | | Compensation
Actually
Paid to PEO
David Moss
($) | | 2025 | | 1,845,179 | | (1,428,911 | ) | | 861,143 | | 1,277,411 | | Year | | Year-End
Fair Value
of Equity
Awards
Granted
During
Year That
Remained
Unvested as
of Last Day
of Year
for PEO
RJ Tesi
($) | | Change in
Fair Value
from Last
Day of Prior
Year to Last
Day of Year
of Equity
Awards
Granted in
Prior Year
that are
Unvested as
of Last Day
of Year
for PEO
RJ Tesi
($) | | Vesting-Date
Fair Value
of Equity
Awards
Granted
During Year
that Vested
During Year
for PEO
RJ Tesi
($) | | Change in
Fair Value
from Last
Day of Prior
Year to
Vesting Date
of Equity
Awards
Grant in
Prior Year
that Vested
During Year
for PEO
RJ Tesi
($) | | Fair Value
at Last
Day of
Prior Year
of Equity
Awards
Forfeited
During Year
for PEO
RJ Tesi
($) | | Total –
Inclusion
of Equity
Values
for PEO
RJ Tesi
($) | | 2025 | | — | | (819,782 | ) | | 1,582,169 | | 150,276 | | | — | | 912,663 | | 2024 | | 1,462,365 | | (409,142 | ) | | 260,171 | | (151,646 | ) | | — | | 1,161,748 | | 2023 | | 1,466,856 | | 415,824 | | | — | | 135,517 | | | — | | 2,018,197 | | Year | | Year-End
Fair Value
of Equity
Awards
Granted
During
Year That
Remained
Unvested as
of the Last
Day of Year
for PEO
David Moss
($) | | Change in
Fair Value
from Last
Day of Prior
Year to Last
Day of Year
of Equity
Awards
Granted in
Prior Year
that are
Unvested as
of Last Day
of Year
for PEO
David Moss
($) | | Vesting-Date
Fair Value
of Equity
Awards
Granted
During Year
that Vested
During Year
for PEO
David Moss
($) | | Change in
Fair Value
from Last
Day of Prior
Year to
Vesting Date
of Equity
Awards
Grant in
Prior Year
that Vested
During Year
for PEO
David Moss
($) | | Fair Value at
Last Day of
Prior Year
of Equity
Awards
Forfeited
During Year
for PEO
David Moss
($) | | Total –
Inclusion
of Equity
Values
for PEO
David Moss
($) | | 2025 | | 1,049,660 | | (806,317 | ) | | 469,757 | | 148,043 | | — | | 861,143 | | Year | | Average
Year-End
Fair Value
of Equity
Awards
Granted
During
Year That
Remained
Unvested as
of Last Day
of Year
for Non-PEO
NEOs
($) | | Average
Change in
Fair Value
from Last
Day of Prior
Year to
Last Day
of Equity
Awards
Non-PEO
NEOs
($) | | Average
Vesting-Date
Fair Value
of Equity
Awards
Granted
During Year
that Vested
During Year
for Non-PEO
NEOs
($) | | Average
Change in
Fair Value
from Last
Day of Prior
Year to
Vesting Date
of Unvested
Equity
Awards
that Vested
During Year
for Non-PEO
NEOs
($) | | Average Fair
Value at
Last Day of
Prior Year
of Equity
Awards
Forfeited
During Year
for Non-PEO
NEOs
($) | | Total –
Inclusion
of Equity
Values
for Non-PEO
NEOs
($) | | 2025 | | 629,748 | | (409,556 | ) | | 179,254 | | 38,441 | | | — | | 437,887 | | 2024 | | 1,220,680 | | (233,433 | ) | | — | | (129,421 | ) | | — | | 857,826 | | 2023 | | 733,428 | | 276,026 | | | — | | 81,678 | | | — | | 1,091,132 |
|
|
|
|
| Non-PEO NEO Average Total Compensation Amount |
[1] |
|
|
$ 1,035,732
|
|
$ 2,257,208
|
$ 869,728
|
| Non-PEO NEO Average Compensation Actually Paid Amount |
[1],[2] |
|
|
$ 691,393
|
|
1,231,194
|
1,363,701
|
| Adjustment to Non-PEO NEO Compensation Footnote |
|
|
|
| Year | | Average
Summary
Compensation
Table
for Non-PEO
NEOs
($) | | Average
Exclusion of
Stock Awards
and Option
Awards
for Non-PEO
NEOs
($) | | Average
Inclusion of
Equity
Values
for Non-PEO
NEOs
($) | | Average
Compensation
Actually
Paid to
Non-PEO
NEOs
($) | | 2025 | | 1,035,732 | | (782,226 | ) | | 437,887 | | 691,393 | | 2024 | | 2,257,208 | | (1,883,840 | ) | | 857,826 | | 1,231,194 | | 2023 | | 869,728 | | (597,159 | ) | | 1,091,132 | | 1,363,701 |
|
|
|
|
| Compensation Actually Paid vs. Total Shareholder Return |
|
|
|
Description of Relationship Between PEO and Non-PEO NEO Compensation Actually Paid and Company Total Shareholder Return (“TSR”) The following chart sets forth the relationship between Compensation Actually Paid to our PEO, the average of Compensation Actually Paid to our Non-PEO NEOs, and our cumulative TSR over the three most recently completed fiscal years. 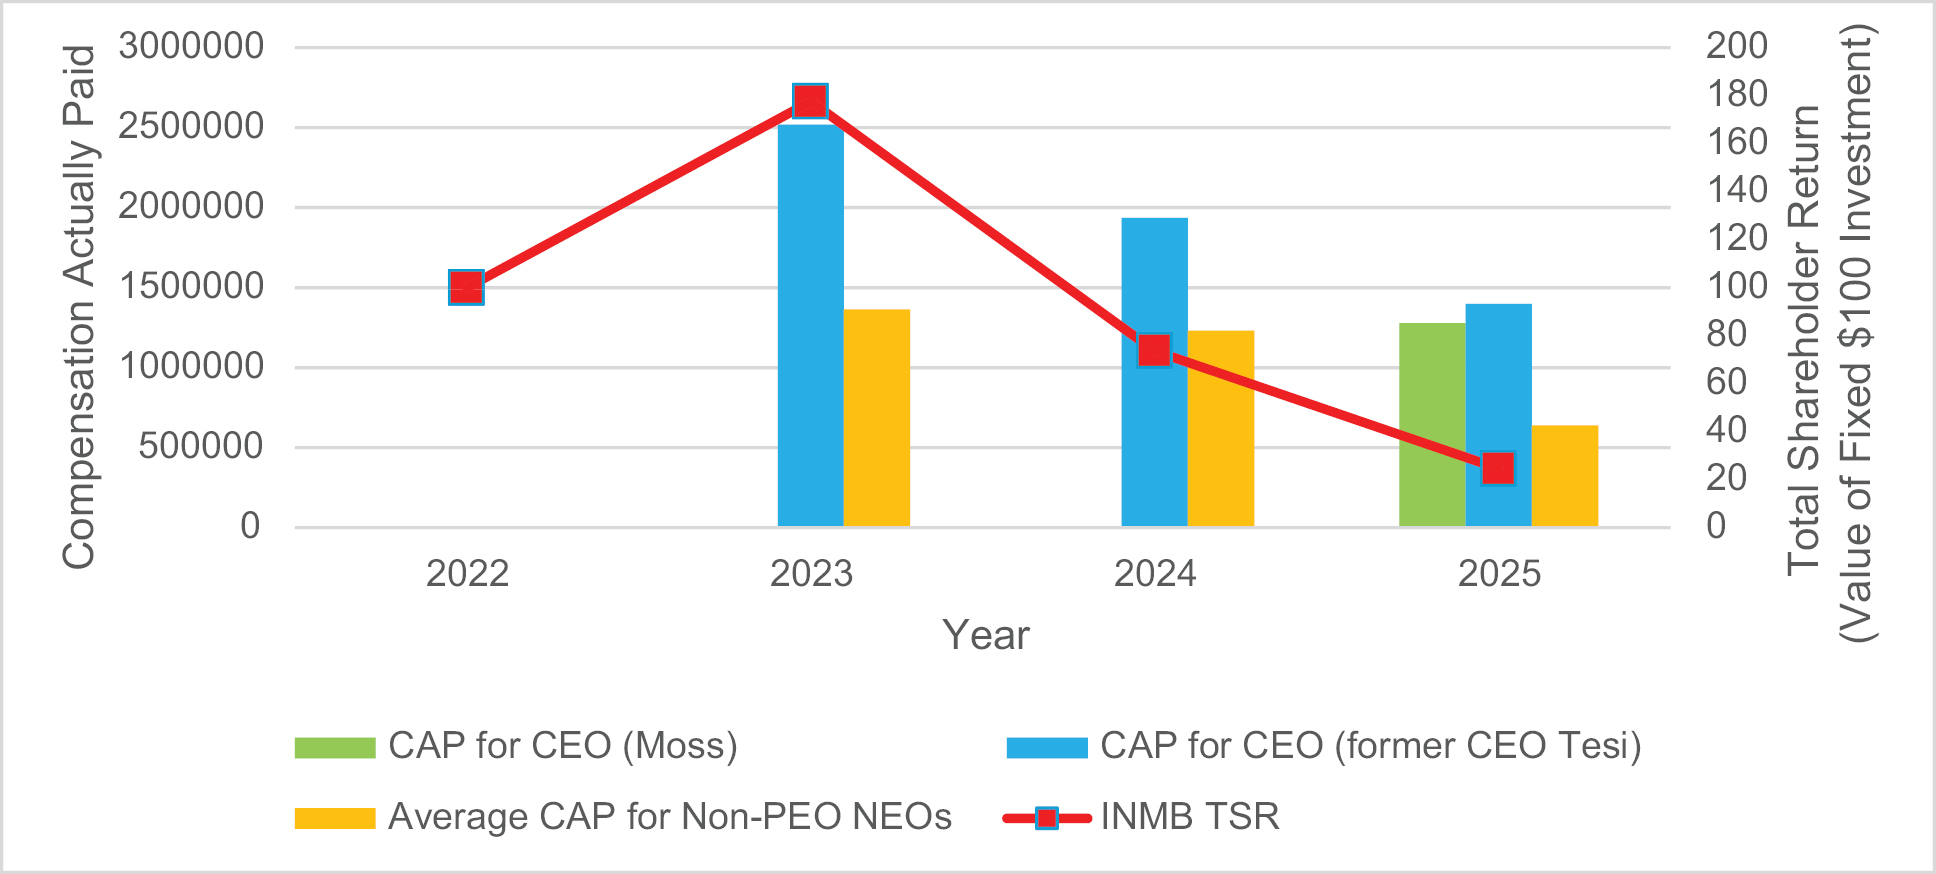
|
|
|
|
| Compensation Actually Paid vs. Net Income |
|
|
|
Description of Relationship Between PEO and Non-PEO NEO Compensation Actually Paid and Net Income (Loss) The following chart sets forth the relationship between Compensation Actually Paid to our PEO, the average of Compensation Actually Paid to our Non-PEO NEOs, and our net income (loss) during the two most recently completed fiscal years. 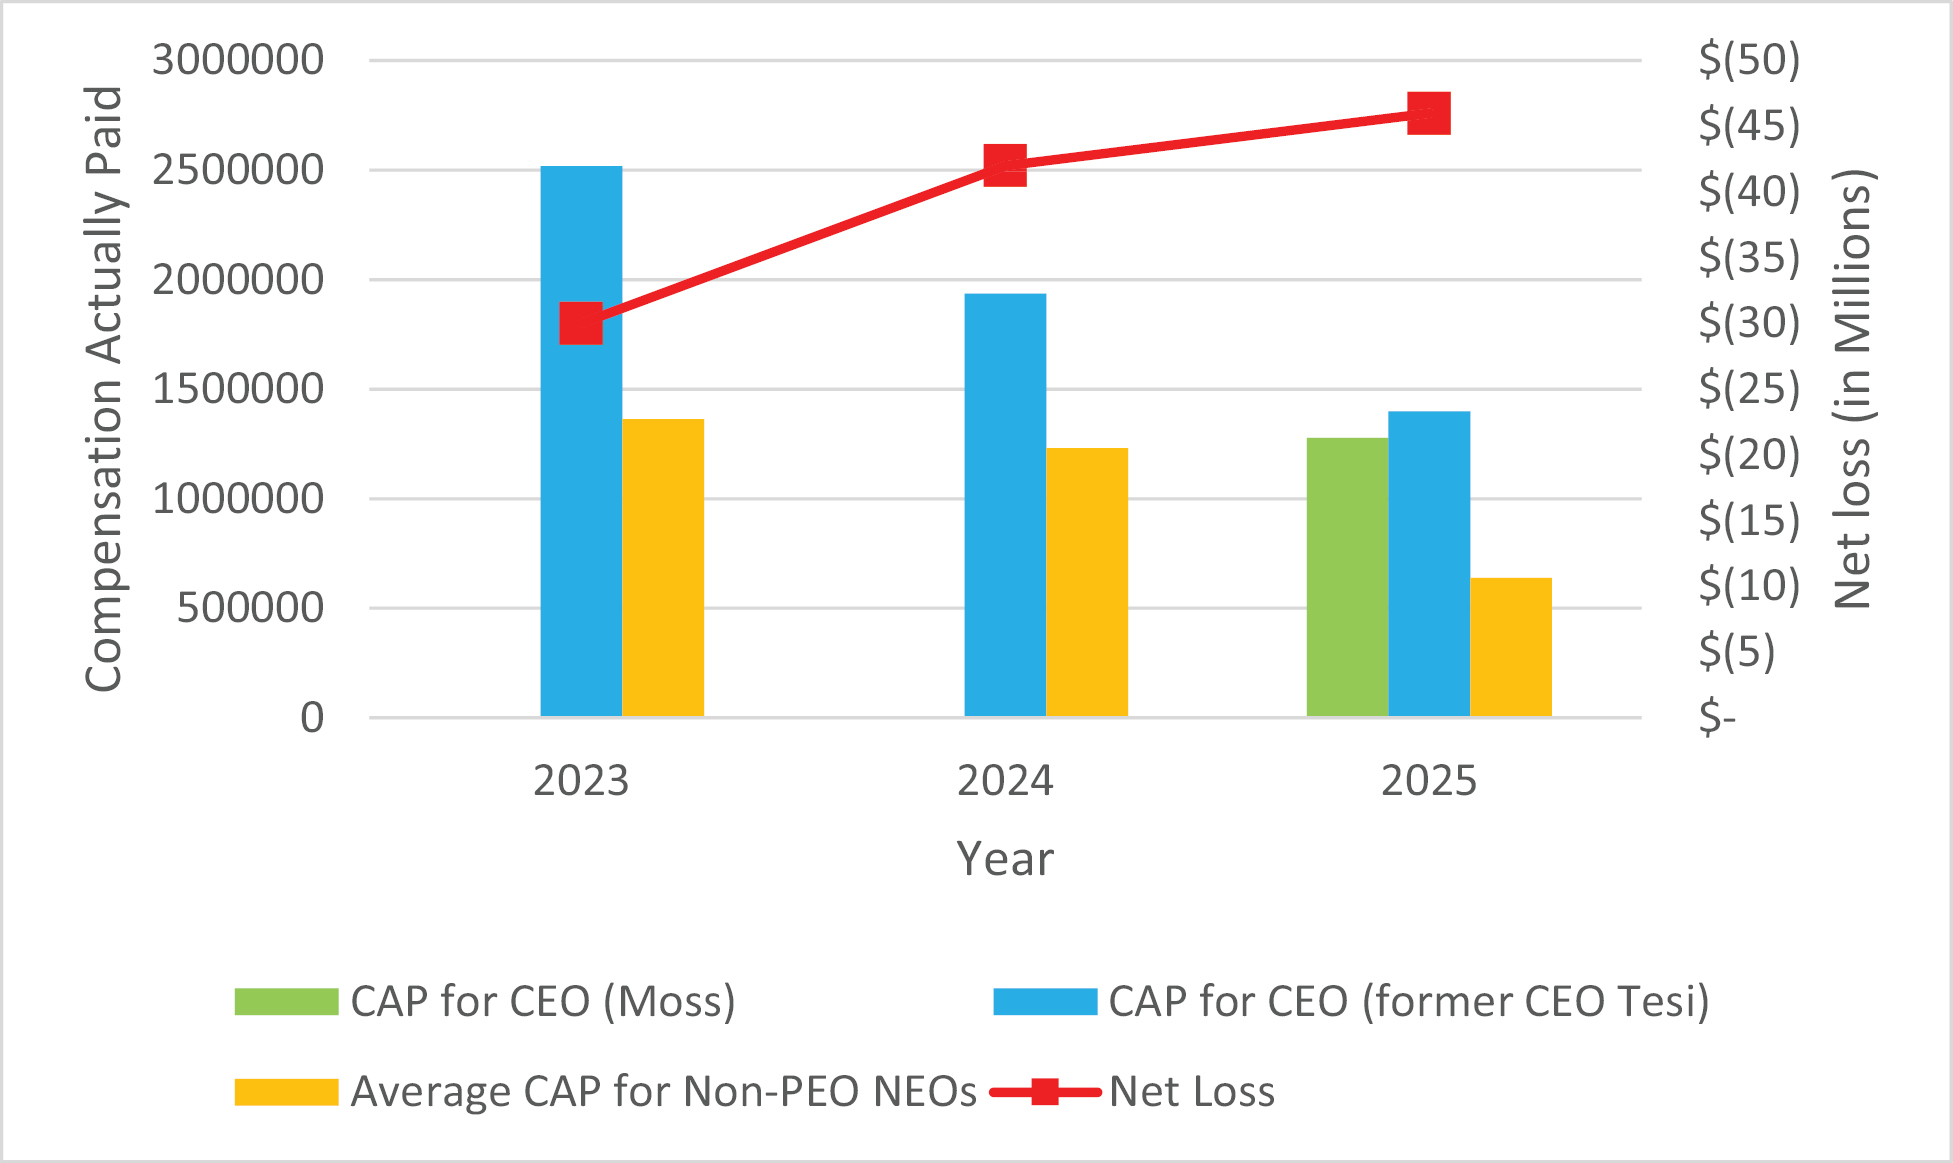
|
|
|
|
| Total Shareholder Return Amount |
[3] |
|
|
$ (66.6)
|
|
(58.5)
|
77.6
|
| Net Income (Loss) |
|
|
|
(46,000,000)
|
|
(42,000,000)
|
(30,000,000)
|
| PEO Name |
|
David Moss
|
Raymond J. Tesi, M.D
|
|
|
|
|
| Average Exclusion of Stock Awards and Option Awards for Non-PEO NEOs [Member] |
|
|
|
|
|
|
|
| Pay vs Performance Disclosure |
|
|
|
|
|
|
|
| Adjustment to Compensation, Amount |
|
|
|
(782,226)
|
|
(1,883,840)
|
(597,159)
|
| Average Inclusion of Equity Values for Non-PEO NEOs [Member] |
|
|
|
|
|
|
|
| Pay vs Performance Disclosure |
|
|
|
|
|
|
|
| Adjustment to Compensation, Amount |
|
|
|
437,887
|
|
857,826
|
1,091,132
|
| Average Year-End Fair Value of Equity Awards Granted During Year That Remained Unvested as of Last Day of Year for Non-PEO NEOs [Member] |
|
|
|
|
|
|
|
| Pay vs Performance Disclosure |
|
|
|
|
|
|
|
| Adjustment to Compensation, Amount |
|
|
|
629,748
|
|
1,220,680
|
733,428
|
| Average Change in Fair Value from Last Day of Prior Year to Last Day of Equity Awards Non-PEO NEOs [Member] |
|
|
|
|
|
|
|
| Pay vs Performance Disclosure |
|
|
|
|
|
|
|
| Adjustment to Compensation, Amount |
|
|
|
(409,556)
|
|
(233,433)
|
276,026
|
| Average Vesting-Date Fair Value of Equity Awards Granted During Year that Vested During Year for Non-PEO NEOs [Member] |
|
|
|
|
|
|
|
| Pay vs Performance Disclosure |
|
|
|
|
|
|
|
| Adjustment to Compensation, Amount |
|
|
|
179,254
|
|
|
|
| Average Change in Fair Value from Last Day of Prior Year to Vesting Date of Unvested Equity Awards that Vested During Year for Non-PEO NEOs [Member] |
|
|
|
|
|
|
|
| Pay vs Performance Disclosure |
|
|
|
|
|
|
|
| Adjustment to Compensation, Amount |
|
|
|
38,441
|
|
(129,421)
|
81,678
|
| Average Fair Value at Last Day of Prior Year of Equity Awards Forfeited During Year for Non-PEO NEOs [Member] |
|
|
|
|
|
|
|
| Pay vs Performance Disclosure |
|
|
|
|
|
|
|
| Adjustment to Compensation, Amount |
|
|
|
|
|
|
|
| Total – Inclusion of Equity Values for Non-PEO NEOs [Member] |
|
|
|
|
|
|
|
| Pay vs Performance Disclosure |
|
|
|
|
|
|
|
| Adjustment to Compensation, Amount |
|
|
|
437,887
|
|
857,826
|
1,091,132
|
| RJ Tesi [Member] |
|
|
|
|
|
|
|
| Pay vs Performance Disclosure |
|
|
|
|
|
|
|
| PEO Total Compensation Amount |
[1] |
|
|
2,849,504
|
|
3,008,174
|
1,694,818
|
| PEO Actually Paid Compensation Amount |
[1],[2] |
|
|
1,398,771
|
|
1,935,558
|
2,518,697
|
| RJ Tesi [Member] | Exclusion of Stock Awards and Option Awards for PEO [Member] |
|
|
|
|
|
|
|
| Pay vs Performance Disclosure |
|
|
|
|
|
|
|
| Adjustment to Compensation, Amount |
|
|
|
(2,363,396)
|
|
(2,234,364)
|
(1,194,318)
|
| RJ Tesi [Member] | Inclusion of Equity Values for PEO [Member] |
|
|
|
|
|
|
|
| Pay vs Performance Disclosure |
|
|
|
|
|
|
|
| Adjustment to Compensation, Amount |
|
|
|
912,663
|
|
1,161,748
|
2,018,197
|
| RJ Tesi [Member] | Year-End Fair Value of Equity Awards Granted During Year That Remained Unvested as of Last Day of Year for PEO [Member] |
|
|
|
|
|
|
|
| Pay vs Performance Disclosure |
|
|
|
|
|
|
|
| Adjustment to Compensation, Amount |
|
|
|
|
|
1,462,365
|
1,466,856
|
| RJ Tesi [Member] | Change in Fair Value from Last Day of Prior Year to Last Day of Year of Equity Awards Granted in Prior Year that are Unvested as of Last Day of Year for PEO [Member] |
|
|
|
|
|
|
|
| Pay vs Performance Disclosure |
|
|
|
|
|
|
|
| Adjustment to Compensation, Amount |
|
|
|
(819,782)
|
|
(409,142)
|
415,824
|
| RJ Tesi [Member] | Vesting-Date Fair Value of Equity Awards Granted During Year that Vested During Year for PEO [Member] |
|
|
|
|
|
|
|
| Pay vs Performance Disclosure |
|
|
|
|
|
|
|
| Adjustment to Compensation, Amount |
|
|
|
1,582,169
|
|
260,171
|
|
| RJ Tesi [Member] | Change in Fair Value from Last Day of Prior Year to Vesting Date of Equity Awards Grant in Prior Year that Vested During Year for PEO [Member] |
|
|
|
|
|
|
|
| Pay vs Performance Disclosure |
|
|
|
|
|
|
|
| Adjustment to Compensation, Amount |
|
|
|
150,276
|
|
(151,646)
|
135,517
|
| RJ Tesi [Member] | Fair Value at Last Day of Prior Year of Equity Awards Forfeited During Year for PEO [Member] |
|
|
|
|
|
|
|
| Pay vs Performance Disclosure |
|
|
|
|
|
|
|
| Adjustment to Compensation, Amount |
|
|
|
|
|
|
|
| David Moss [Member] |
|
|
|
|
|
|
|
| Pay vs Performance Disclosure |
|
|
|
|
|
|
|
| PEO Total Compensation Amount |
|
|
|
1,845,179
|
[1] |
|
|
| PEO Actually Paid Compensation Amount |
[1],[2] |
|
|
1,277,411
|
|
|
|
| David Moss [Member] | Exclusion of Stock Awards and Option Awards for PEO [Member] |
|
|
|
|
|
|
|
| Pay vs Performance Disclosure |
|
|
|
|
|
|
|
| Adjustment to Compensation, Amount |
|
|
|
(1,428,911)
|
|
|
|
| David Moss [Member] | Inclusion of Equity Values for PEO [Member] |
|
|
|
|
|
|
|
| Pay vs Performance Disclosure |
|
|
|
|
|
|
|
| Adjustment to Compensation, Amount |
|
|
|
861,143
|
|
|
|
| David Moss [Member] | Year-End Fair Value of Equity Awards Granted During Year That Remained Unvested as of Last Day of Year for PEO [Member] |
|
|
|
|
|
|
|
| Pay vs Performance Disclosure |
|
|
|
|
|
|
|
| Adjustment to Compensation, Amount |
|
|
|
1,049,660
|
|
|
|
| David Moss [Member] | Change in Fair Value from Last Day of Prior Year to Last Day of Year of Equity Awards Granted in Prior Year that are Unvested as of Last Day of Year for PEO [Member] |
|
|
|
|
|
|
|
| Pay vs Performance Disclosure |
|
|
|
|
|
|
|
| Adjustment to Compensation, Amount |
|
|
|
(806,317)
|
|
|
|
| David Moss [Member] | Vesting-Date Fair Value of Equity Awards Granted During Year that Vested During Year for PEO [Member] |
|
|
|
|
|
|
|
| Pay vs Performance Disclosure |
|
|
|
|
|
|
|
| Adjustment to Compensation, Amount |
|
|
|
469,757
|
|
|
|
| David Moss [Member] | Change in Fair Value from Last Day of Prior Year to Vesting Date of Equity Awards Grant in Prior Year that Vested During Year for PEO [Member] |
|
|
|
|
|
|
|
| Pay vs Performance Disclosure |
|
|
|
|
|
|
|
| Adjustment to Compensation, Amount |
|
|
|
148,043
|
|
|
|
| David Moss [Member] | Fair Value at Last Day of Prior Year of Equity Awards Forfeited During Year for PEO [Member] |
|
|
|
|
|
|
|
| Pay vs Performance Disclosure |
|
|
|
|
|
|
|
| Adjustment to Compensation, Amount |
|
|
|
|
|
|
|
|
|