Pay vs Performance Disclosure - USD ($)
|
2 Months Ended |
10 Months Ended |
12 Months Ended |
Feb. 28, 2023 |
Dec. 31, 2023 |
Dec. 31, 2025 |
Dec. 31, 2024 |
Dec. 31, 2023 |
Dec. 31, 2022 |
Dec. 31, 2021 |
| Pay vs Performance Disclosure |
|
|
|
|
|
|
|
| Pay vs Performance Disclosure, Table |
|
|
As required by Section 953(b) of the Dodd-Frank Wall Street Reform and Consumer Protection Act, and Item 402(u) of Regulation S-K, we are providing the following information about the relationship between executive compensation actually paid (“ ”, as defined by SEC rules) and certain financial performance measures for the last five completed fiscal years. These financial metrics include total shareholder return (TSR), net income metric, and a company-selected measure of Adjusted Operating Income (AOI). We selected AOI as the most important in linking compensation actually paid to our NEOs for 2025 to our performance, as it was the predominant metric used in our 2025 incentive plans as described in the Compensation Discussion & Analysis earlier in this Proxy Statement.
|
|
|
|
|
|
|
|
|
|
|
|
|
|
|
|
|
|
|
|
|
|
|
|
|
|
|
|
|
|
|
|
|
|
|
|
|
|
|
|
|
|
|
Summary Compensation Table Total for First PEO (Jose Cil) |
|
|
Compensation Actually Paid to First PEO (2) (Jose Cil) |
|
|
Summary Compensation Table Total for Second PEO (Joshua Kobza) |
|
|
Compensation
Actually Paid to
Second
|
|
|
Average
Summary
Compensation
Table Total for
Non-PEO
NEOs |
|
|
Average
Compensation
Actually Paid
|
|
|
Total
Shareholder
Return |
|
|
Peer Group
Total
Shareholder
Return |
|
|
Net
Income
(millions) |
|
|
Adj. Operating Income (3) (millions) |
|
2025 |
|
$ |
0 |
|
|
$ |
0 |
|
|
$ |
15,159,780 |
|
|
$ |
18,060,728 |
|
|
$ |
7,769,331 |
|
|
$ |
8,272,769 |
|
|
$ |
133 |
|
|
$ |
136 |
|
|
$ |
1,075 |
|
|
$ |
2,584 |
|
2024 |
|
$ |
0 |
|
|
$ |
0 |
|
|
$ |
14,469,867 |
|
|
($ |
28,120,726 |
) |
|
$ |
6,093,196 |
|
|
$ |
203,860 |
|
|
$ |
122 |
|
|
$ |
136 |
|
|
$ |
1,445 |
|
|
$ |
2,402 |
|
2023 |
|
$ |
2,919,736 |
|
|
$ |
22,058,277 |
|
|
$ |
28,967,541 |
|
|
$ |
77,213,418 |
|
|
$ |
7,215,978 |
|
|
$ |
12,712,740 |
|
|
$ |
142 |
|
|
$ |
130 |
|
|
$ |
1,718 |
|
|
$ |
2,200 |
|
2022 |
|
$ |
17,051,342 |
|
|
$ |
27,404,712 |
|
|
$ |
0 |
|
|
$ |
0 |
|
|
$ |
36,433,352 |
|
|
$ |
57,793,584 |
|
|
$ |
114 |
|
|
$ |
113 |
|
|
$ |
1,482 |
|
|
$ |
2,084 |
|
2021 |
|
$ |
13,968,789 |
|
|
$ |
13,978,748 |
|
|
$ |
0 |
|
|
$ |
0 |
|
|
$ |
6,914,601 |
|
|
$ |
6,379,416 |
|
|
$ |
103 |
|
|
$ |
123 |
|
|
$ |
1,253 |
|
|
$ |
1,977 |
|
| (1) |
Mr. Cil is the PEO for 2021, 2022, and two months of 2023. Mr. Kobza is the PEO for the remainder of 2023 onwards. The other NEOs for each year are: for 2025 and 2024 – Messrs. Siddiqui, Schwan, Curtis, and Ms. Granat; for 2023 – Messrs. Dunnigan, Shear, Schwan, and Curtis; for 2022 – Messrs. Doyle, Dunnigan, Kobza, and Shear; for 2021 – Messrs. Dunnigan, Kobza, Shear, and Curtis. |
| (2) |
Dollar amounts shown in this column represent compensation actually paid calculated by adjusting amounts in summary compensation table in accordance with SEC rules. As required, the dollar amounts include unpaid amounts of equity compensation that may be realizable in future periods, and as such, the dollar amounts do not fully represent the actual final amount of compensation earned or actually paid to the CEO or other NEO during the applicable years. Adjustments made are shown in below tables. |
| (3) |
For 2025, our Company Selected Measure is Adjusted Operating Income, consistent with our Short-Term Incentive Program. In prior years, we used Adjusted EBITDA. For more details, refer to our Compensation Discussion and Analysis, beginning on page 35. Adjusted Operating Income (AOI) is a non-GAAP measure, and reconciliation to Operating Income is provided in Appendix B. | CEO Equity Adjustments
|
|
|
|
|
|
|
|
|
|
|
|
|
|
|
|
|
|
|
|
|
|
|
|
|
All values in $US |
|
2021 |
|
|
2022 |
|
|
2023 First CEO (Jose Cil) |
|
|
2023 Second CEO (Joshua Kobza) |
|
|
2024 |
|
|
2025 |
|
Summary Compensation Table Total |
|
|
13,968,789 |
|
|
|
17,051,342 |
|
|
|
2,919,736 |
|
|
|
28,967,541 |
|
|
|
14,469,867 |
|
|
|
15,159,780 |
|
Stock and Option Award values reported in SCT |
|
|
(10,769,665 |
) |
|
|
(13,575,946 |
) |
|
|
(2,571,384 |
) |
|
|
(26,007,809 |
) |
|
|
(11,626,221 |
) |
|
|
(12,317,912 |
) |
Fair Value of Stock and Options Awards Granted in Year |
|
|
7,792,950 |
|
|
|
15,204,487 |
|
|
|
2,223,970 |
|
|
|
57,461,293 |
|
|
|
8,143,340 |
|
|
|
12,915,993 |
|
Change in Fair Value of Outstanding Unvested Stock and Option Awards from Prior Years |
|
|
(341,716 |
) |
|
|
4,528,849 |
|
|
|
13,737,077 |
|
|
|
11,220,283 |
|
|
|
(38,966,723 |
) |
|
|
2,179,228 |
|
Fair Value as of Vesting Date of Equity Award Granted and Vested in Year |
|
|
1,423,917 |
|
|
|
734,069 |
|
|
|
699,434 |
|
|
|
477,567 |
|
|
|
536,046 |
|
|
|
355,528 |
|
Change in Fair Value of Stock and Options Awards from Prior Years that Vested in Year |
|
|
(111,328 |
) |
|
|
157,046 |
|
|
|
893,104 |
|
|
|
533,178 |
|
|
|
(701,420 |
) |
|
|
(249,530 |
) |
Fair Value of Stock and Option Awards that fail to meet vesting conditions during Year |
|
|
— |
|
|
|
— |
|
|
|
— |
|
|
|
— |
|
|
|
— |
|
|
|
— |
|
Value of Dividends or Other Earnings Paid on Stock or Option Awards not Otherwise Reflected in Fair Value or Total Compensation |
|
|
2,015,801 |
|
|
|
3,304,865 |
|
|
|
4,156,340 |
|
|
|
4,561,366 |
|
|
|
24,385 |
|
|
|
17,640 |
|
Compensation Actually Paid |
|
|
13,978,748 |
|
|
|
27,404,712 |
|
|
|
22,058,277 |
|
|
|
77,213,418 |
|
|
|
(28,120,725 |
) |
|
|
18,060,728 |
| Other Information Average of Other NEO Equity Adjustments
|
|
|
|
|
|
|
|
|
|
|
|
|
|
|
|
|
|
|
|
|
All values in $US |
|
2021 |
|
|
2022 |
|
|
2023 |
|
|
2024 |
|
|
2025 |
|
Summary Compensation Table Total |
|
|
6,914,601 |
|
|
|
36,433,352 |
|
|
|
7,215,978 |
|
|
|
6,093,196 |
|
|
|
7,769,331 |
|
Stock and Option Award values reported in SCT |
|
|
(4,942,911 |
) |
|
|
(34,402,665 |
) |
|
|
(5,205,781 |
) |
|
|
(4,777,605 |
) |
|
|
(6,262,032 |
) |
Fair Value of Stock and Options Awards Granted in Year |
|
|
3,640,557 |
|
|
|
53,815,223 |
|
|
|
6,230,469 |
|
|
|
2,912,303 |
|
|
|
6,532,198 |
|
Change in Fair Value of Outstanding Unvested Stock and Option Awards from Prior Years |
|
|
(250,129 |
) |
|
|
1,328,710 |
|
|
|
3,053,515 |
|
|
|
(2,935,383 |
) |
|
|
122,358 |
|
Fair Value as of Vesting Date of Equity Award Granted and Vested in Year |
|
|
585,031 |
|
|
|
264,387 |
|
|
|
282,346 |
|
|
|
205,059 |
|
|
|
187,996 |
|
Change in Fair Value of Stock and Options Awards from Prior Years that Vested in Year |
|
|
(144,704 |
) |
|
|
(524,058 |
) |
|
|
208,276 |
|
|
|
(177,972 |
) |
|
|
(82,304 |
) |
Fair Value of Stock and Option Awards that fail to meet vesting conditions during Year |
|
|
— |
|
|
|
— |
|
|
|
— |
|
|
|
(1,127,307 |
) |
|
|
— |
|
Value of Dividends or Other Earnings Paid on Stock or Option Awards not Otherwise Reflected in Fair Value or Total Compensation |
|
|
576,970 |
|
|
|
878,635 |
|
|
|
927,936 |
|
|
|
11,353 |
|
|
|
6,643 |
|
Aggregate Change in Actuarial Present Value of Accumulated Benefit Under Pension Plans |
|
|
— |
|
|
|
— |
|
|
|
— |
|
|
|
216 |
|
|
|
(1,345 |
) |
Compensation Actually Paid |
|
|
6,379,416 |
|
|
|
57,793,584 |
|
|
|
12,712,740 |
|
|
|
203,860 |
|
|
|
8,272,769 |
|
|
|
|
|
|
| Company Selected Measure Name |
|
|
Adj. Operating Income
|
|
|
|
|
| Named Executive Officers, Footnote |
|
|
The other NEOs for each year are: for 2025 and 2024 – Messrs. Siddiqui, Schwan, Curtis, and Ms. Granat; for 2023 – Messrs. Dunnigan, Shear, Schwan, and Curtis; for 2022 – Messrs. Doyle, Dunnigan, Kobza, and Shear; for 2021 – Messrs. Dunnigan, Kobza, Shear, and Curtis.
|
|
|
|
|
| PEO Total Compensation Amount |
|
|
$ 15,159,780
|
$ 14,469,867
|
|
$ 17,051,342
|
$ 13,968,789
|
| PEO Actually Paid Compensation Amount |
|
|
$ 18,060,728
|
(28,120,725)
|
|
27,404,712
|
13,978,748
|
| Adjustment To PEO Compensation, Footnote |
|
|
CEO Equity Adjustments
|
|
|
|
|
|
|
|
|
|
|
|
|
|
|
|
|
|
|
|
|
|
|
|
|
All values in $US |
|
2021 |
|
|
2022 |
|
|
2023 First CEO (Jose Cil) |
|
|
2023 Second CEO (Joshua Kobza) |
|
|
2024 |
|
|
2025 |
|
Summary Compensation Table Total |
|
|
13,968,789 |
|
|
|
17,051,342 |
|
|
|
2,919,736 |
|
|
|
28,967,541 |
|
|
|
14,469,867 |
|
|
|
15,159,780 |
|
Stock and Option Award values reported in SCT |
|
|
(10,769,665 |
) |
|
|
(13,575,946 |
) |
|
|
(2,571,384 |
) |
|
|
(26,007,809 |
) |
|
|
(11,626,221 |
) |
|
|
(12,317,912 |
) |
Fair Value of Stock and Options Awards Granted in Year |
|
|
7,792,950 |
|
|
|
15,204,487 |
|
|
|
2,223,970 |
|
|
|
57,461,293 |
|
|
|
8,143,340 |
|
|
|
12,915,993 |
|
Change in Fair Value of Outstanding Unvested Stock and Option Awards from Prior Years |
|
|
(341,716 |
) |
|
|
4,528,849 |
|
|
|
13,737,077 |
|
|
|
11,220,283 |
|
|
|
(38,966,723 |
) |
|
|
2,179,228 |
|
Fair Value as of Vesting Date of Equity Award Granted and Vested in Year |
|
|
1,423,917 |
|
|
|
734,069 |
|
|
|
699,434 |
|
|
|
477,567 |
|
|
|
536,046 |
|
|
|
355,528 |
|
Change in Fair Value of Stock and Options Awards from Prior Years that Vested in Year |
|
|
(111,328 |
) |
|
|
157,046 |
|
|
|
893,104 |
|
|
|
533,178 |
|
|
|
(701,420 |
) |
|
|
(249,530 |
) |
Fair Value of Stock and Option Awards that fail to meet vesting conditions during Year |
|
|
— |
|
|
|
— |
|
|
|
— |
|
|
|
— |
|
|
|
— |
|
|
|
— |
|
Value of Dividends or Other Earnings Paid on Stock or Option Awards not Otherwise Reflected in Fair Value or Total Compensation |
|
|
2,015,801 |
|
|
|
3,304,865 |
|
|
|
4,156,340 |
|
|
|
4,561,366 |
|
|
|
24,385 |
|
|
|
17,640 |
|
Compensation Actually Paid |
|
|
13,978,748 |
|
|
|
27,404,712 |
|
|
|
22,058,277 |
|
|
|
77,213,418 |
|
|
|
(28,120,725 |
) |
|
|
18,060,728 |
|
|
|
|
|
|
| Non-PEO NEO Average Total Compensation Amount |
|
|
$ 7,769,331
|
6,093,196
|
$ 7,215,978
|
36,433,352
|
6,914,601
|
| Non-PEO NEO Average Compensation Actually Paid Amount |
|
|
$ 8,272,769
|
203,860
|
12,712,740
|
57,793,584
|
6,379,416
|
| Adjustment to Non-PEO NEO Compensation Footnote |
|
|
Average of Other NEO Equity Adjustments
|
|
|
|
|
|
|
|
|
|
|
|
|
|
|
|
|
|
|
|
|
All values in $US |
|
2021 |
|
|
2022 |
|
|
2023 |
|
|
2024 |
|
|
2025 |
|
Summary Compensation Table Total |
|
|
6,914,601 |
|
|
|
36,433,352 |
|
|
|
7,215,978 |
|
|
|
6,093,196 |
|
|
|
7,769,331 |
|
Stock and Option Award values reported in SCT |
|
|
(4,942,911 |
) |
|
|
(34,402,665 |
) |
|
|
(5,205,781 |
) |
|
|
(4,777,605 |
) |
|
|
(6,262,032 |
) |
Fair Value of Stock and Options Awards Granted in Year |
|
|
3,640,557 |
|
|
|
53,815,223 |
|
|
|
6,230,469 |
|
|
|
2,912,303 |
|
|
|
6,532,198 |
|
Change in Fair Value of Outstanding Unvested Stock and Option Awards from Prior Years |
|
|
(250,129 |
) |
|
|
1,328,710 |
|
|
|
3,053,515 |
|
|
|
(2,935,383 |
) |
|
|
122,358 |
|
Fair Value as of Vesting Date of Equity Award Granted and Vested in Year |
|
|
585,031 |
|
|
|
264,387 |
|
|
|
282,346 |
|
|
|
205,059 |
|
|
|
187,996 |
|
Change in Fair Value of Stock and Options Awards from Prior Years that Vested in Year |
|
|
(144,704 |
) |
|
|
(524,058 |
) |
|
|
208,276 |
|
|
|
(177,972 |
) |
|
|
(82,304 |
) |
Fair Value of Stock and Option Awards that fail to meet vesting conditions during Year |
|
|
— |
|
|
|
— |
|
|
|
— |
|
|
|
(1,127,307 |
) |
|
|
— |
|
Value of Dividends or Other Earnings Paid on Stock or Option Awards not Otherwise Reflected in Fair Value or Total Compensation |
|
|
576,970 |
|
|
|
878,635 |
|
|
|
927,936 |
|
|
|
11,353 |
|
|
|
6,643 |
|
Aggregate Change in Actuarial Present Value of Accumulated Benefit Under Pension Plans |
|
|
— |
|
|
|
— |
|
|
|
— |
|
|
|
216 |
|
|
|
(1,345 |
) |
Compensation Actually Paid |
|
|
6,379,416 |
|
|
|
57,793,584 |
|
|
|
12,712,740 |
|
|
|
203,860 |
|
|
|
8,272,769 |
|
|
|
|
|
|
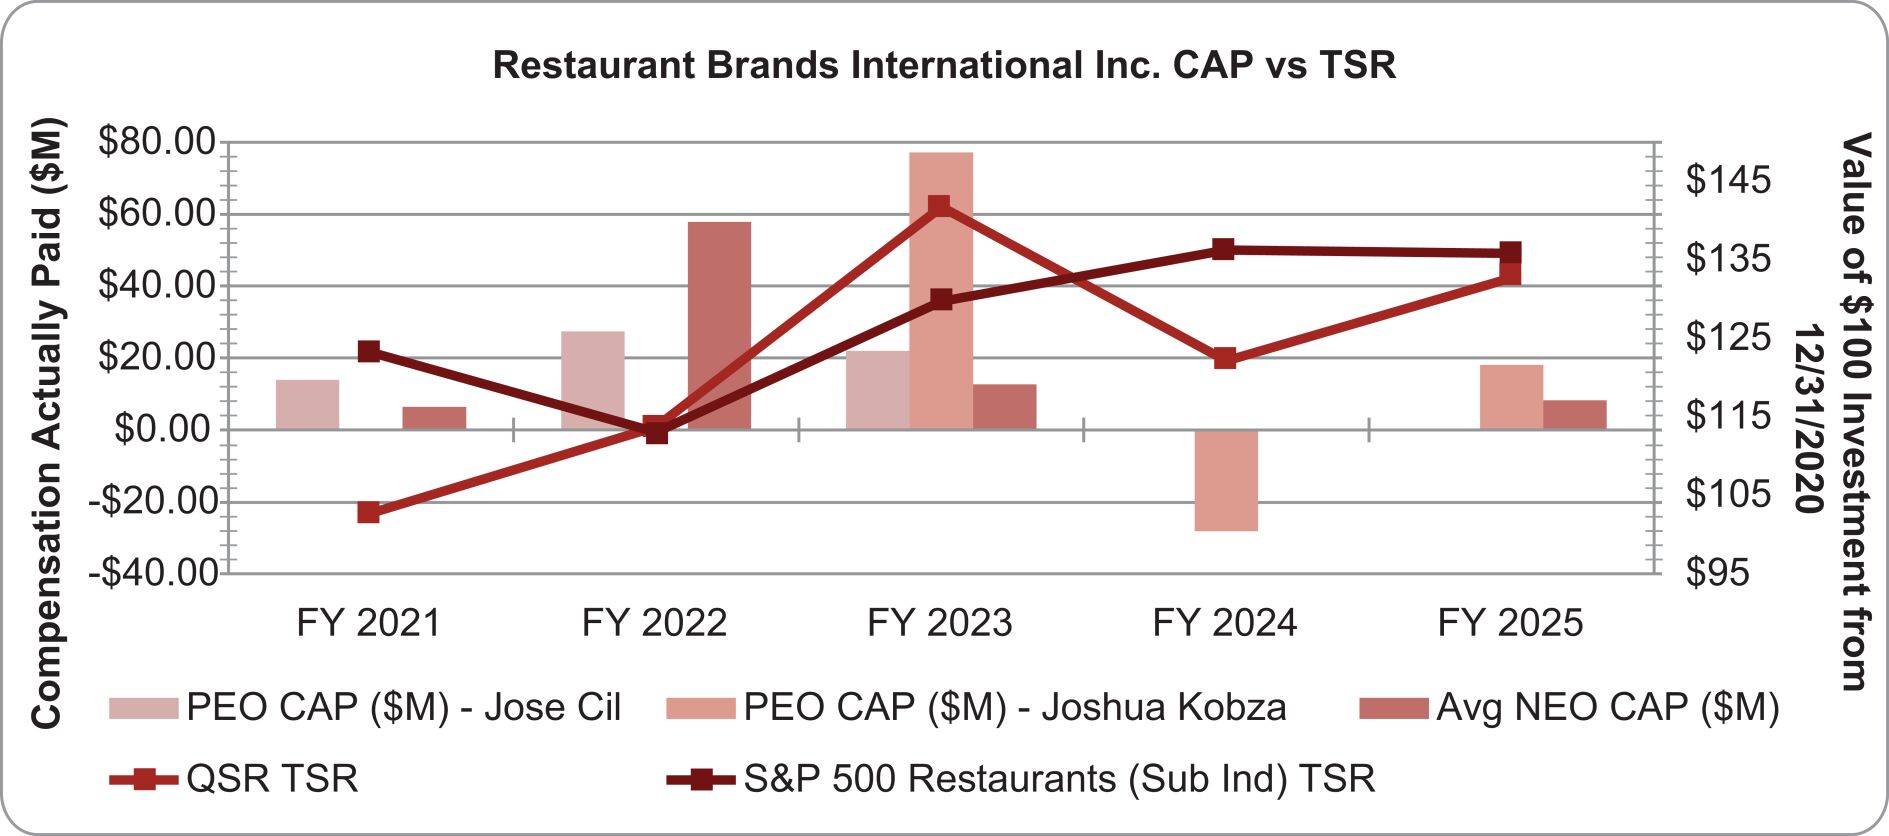
| Compensation Actually Paid vs. Total Shareholder Return |
|
|
|
|
|
|
|
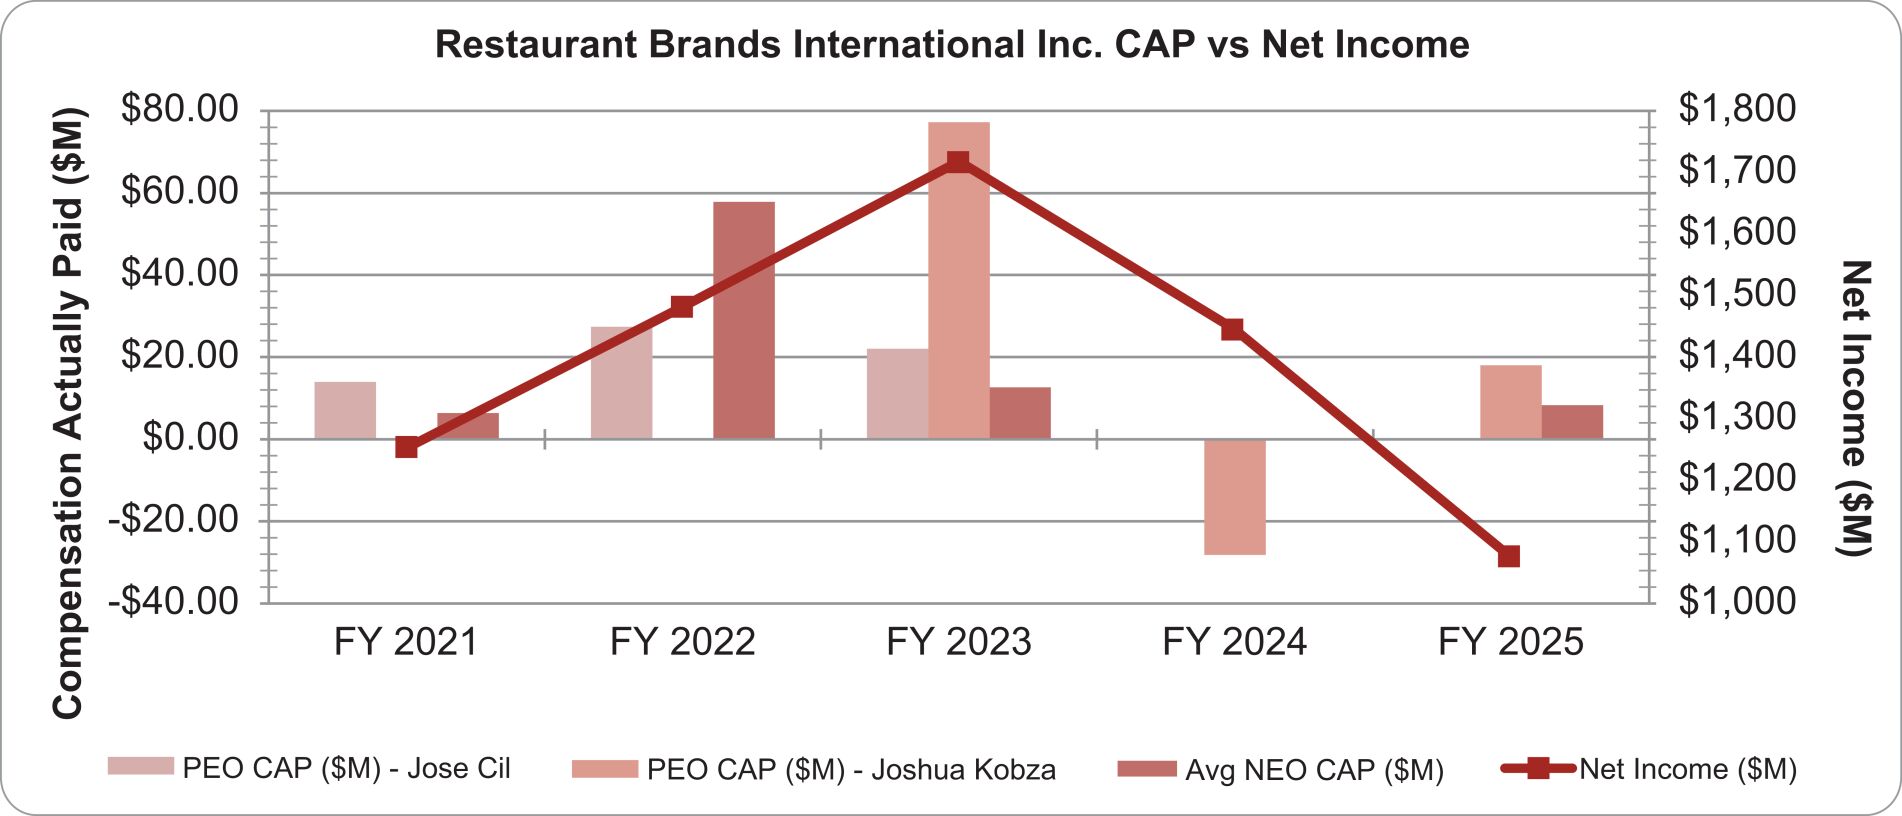
| Compensation Actually Paid vs. Net Income |
|
|
|
|
|
|
|
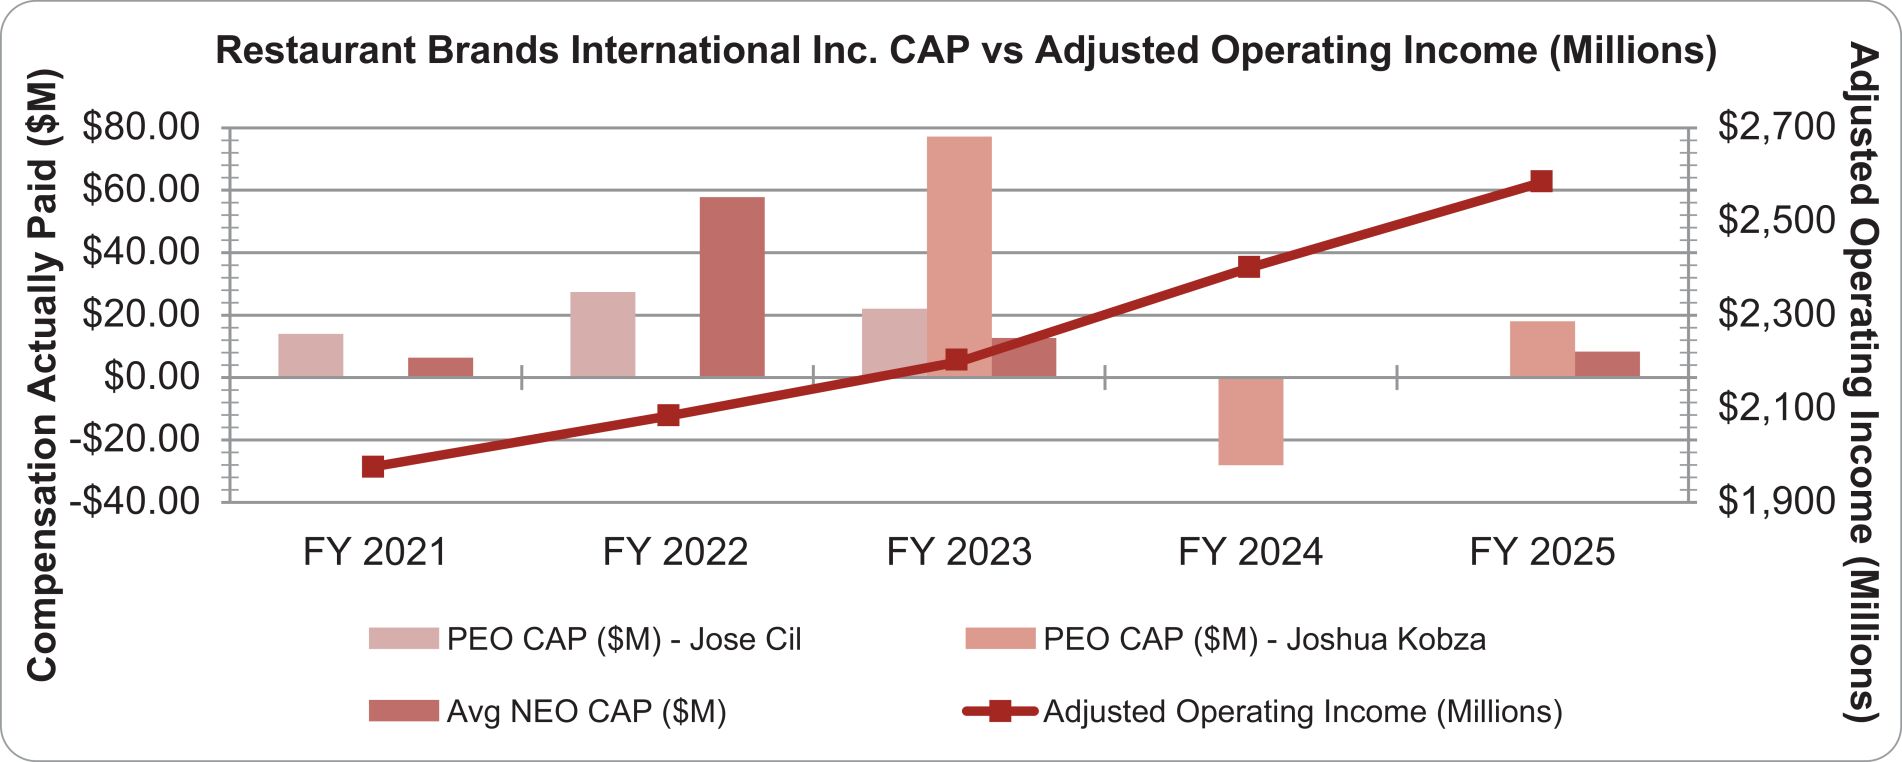
| Compensation Actually Paid vs. Company Selected Measure |
|
|
|
|
|
|
|
| Total Shareholder Return Vs Peer Group |
|
|
|
|
|
|
|
| Tabular List, Table |
|
|
Disclosure of Most Important Measures Linking Compensation Actually Paid in 2025 to Company Performance The most important measures used by RBI to link compensation actually paid to our NEOs for 2025 to our performance are disclosed below. For further information on these performance metrics and their function in our executive compensation program, refer to the Compensation Discussion & Analysis beginning on page 34.
| |
• |
|
Adjusted Operating Income |
| |
• |
|
Same Store Sales (or Comparable Sales) |
| |
• |
|
Franchisee Profitability |
| |
• |
|
Total Shareholder Return |
|
|
|
|
|
| Total Shareholder Return Amount |
|
|
$ 133
|
122
|
142
|
114
|
103
|
| Peer Group Total Shareholder Return Amount |
|
|
136
|
136
|
130
|
113
|
123
|
| Net Income (Loss) |
|
|
$ 1,075,000,000
|
$ 1,445,000,000
|
$ 1,718,000,000
|
$ 1,482,000,000
|
$ 1,253,000,000
|
| Company Selected Measure Amount |
|
|
2,584,000,000
|
2,402,000,000
|
2,200,000,000
|
2,084,000,000
|
1,977,000,000
|
| Measure:: 1 |
|
|
|
|
|
|
|
| Pay vs Performance Disclosure |
|
|
|
|
|
|
|
| Name |
|
|
Adjusted Operating Income
|
|
|
|
|
| Non-GAAP Measure Description |
|
|
For 2025, our Company Selected Measure is Adjusted Operating Income, consistent with our Short-Term Incentive Program. In prior years, we used Adjusted EBITDA. For more details, refer to our Compensation Discussion and Analysis, beginning on page 35. Adjusted Operating Income (AOI) is a non-GAAP measure, and reconciliation to Operating Income is provided in Appendix B.
|
|
|
|
|
| Measure:: 2 |
|
|
|
|
|
|
|
| Pay vs Performance Disclosure |
|
|
|
|
|
|
|
| Name |
|
|
Same Store Sales (or Comparable Sales)
|
|
|
|
|
| Measure:: 3 |
|
|
|
|
|
|
|
| Pay vs Performance Disclosure |
|
|
|
|
|
|
|
| Name |
|
|
Net Restaurant Growth
|
|
|
|
|
| Measure:: 4 |
|
|
|
|
|
|
|
| Pay vs Performance Disclosure |
|
|
|
|
|
|
|
| Name |
|
|
Franchisee Profitability
|
|
|
|
|
| Measure:: 5 |
|
|
|
|
|
|
|
| Pay vs Performance Disclosure |
|
|
|
|
|
|
|
| Name |
|
|
Total Shareholder Return
|
|
|
|
|
| Mr. Cil [Member] |
|
|
|
|
|
|
|
| Pay vs Performance Disclosure |
|
|
|
|
|
|
|
| PEO Total Compensation Amount |
|
|
$ 0
|
$ 0
|
$ 2,919,736
|
$ 17,051,342
|
$ 13,968,789
|
| PEO Actually Paid Compensation Amount |
|
|
0
|
0
|
22,058,277
|
$ 27,404,712
|
$ 13,978,748
|
| PEO Name |
Mr. Cil
|
|
|
|
|
Mr. Cil
|
Mr. Cil
|
| Mr. Kobza [Member] |
|
|
|
|
|
|
|
| Pay vs Performance Disclosure |
|
|
|
|
|
|
|
| PEO Total Compensation Amount |
|
|
15,159,780
|
14,469,867
|
28,967,541
|
$ 0
|
$ 0
|
| PEO Actually Paid Compensation Amount |
|
|
$ 18,060,728
|
$ (28,120,726)
|
77,213,418
|
0
|
0
|
| PEO Name |
|
Mr. Kobza
|
Mr. Kobza
|
Mr. Kobza
|
|
|
|
| PEO | Aggregate Grant Date Fair Value of Equity Award Amounts Reported in Summary Compensation Table |
|
|
|
|
|
|
|
| Pay vs Performance Disclosure |
|
|
|
|
|
|
|
| Adjustment to Compensation, Amount |
|
|
$ (12,317,912)
|
$ (11,626,221)
|
|
(13,575,946)
|
(10,769,665)
|
| PEO | Year-end Fair Value of Equity Awards Granted in Covered Year that are Outstanding and Unvested |
|
|
|
|
|
|
|
| Pay vs Performance Disclosure |
|
|
|
|
|
|
|
| Adjustment to Compensation, Amount |
|
|
12,915,993
|
8,143,340
|
|
15,204,487
|
7,792,950
|
| PEO | Year-over-Year Change in Fair Value of Equity Awards Granted in Prior Years That are Outstanding and Unvested |
|
|
|
|
|
|
|
| Pay vs Performance Disclosure |
|
|
|
|
|
|
|
| Adjustment to Compensation, Amount |
|
|
2,179,228
|
(38,966,723)
|
|
4,528,849
|
(341,716)
|
| PEO | Vesting Date Fair Value of Equity Awards Granted and Vested in Covered Year |
|
|
|
|
|
|
|
| Pay vs Performance Disclosure |
|
|
|
|
|
|
|
| Adjustment to Compensation, Amount |
|
|
355,528
|
536,046
|
|
734,069
|
1,423,917
|
| PEO | Change in Fair Value as of Vesting Date of Prior Year Equity Awards Vested in Covered Year |
|
|
|
|
|
|
|
| Pay vs Performance Disclosure |
|
|
|
|
|
|
|
| Adjustment to Compensation, Amount |
|
|
(249,530)
|
(701,420)
|
|
157,046
|
(111,328)
|
| PEO | Prior Year End Fair Value of Equity Awards Granted in Any Prior Year that Fail to Meet Applicable Vesting Conditions During Covered Year |
|
|
|
|
|
|
|
| Pay vs Performance Disclosure |
|
|
|
|
|
|
|
| Adjustment to Compensation, Amount |
|
|
0
|
0
|
|
0
|
0
|
| PEO | Dividends or Other Earnings Paid on Equity Awards not Otherwise Reflected in Total Compensation for Covered Year |
|
|
|
|
|
|
|
| Pay vs Performance Disclosure |
|
|
|
|
|
|
|
| Adjustment to Compensation, Amount |
|
|
17,640
|
24,385
|
|
3,304,865
|
2,015,801
|
| PEO | Mr. Cil [Member] | Aggregate Grant Date Fair Value of Equity Award Amounts Reported in Summary Compensation Table |
|
|
|
|
|
|
|
| Pay vs Performance Disclosure |
|
|
|
|
|
|
|
| Adjustment to Compensation, Amount |
|
|
|
|
(2,571,384)
|
|
|
| PEO | Mr. Cil [Member] | Year-end Fair Value of Equity Awards Granted in Covered Year that are Outstanding and Unvested |
|
|
|
|
|
|
|
| Pay vs Performance Disclosure |
|
|
|
|
|
|
|
| Adjustment to Compensation, Amount |
|
|
|
|
2,223,970
|
|
|
| PEO | Mr. Cil [Member] | Year-over-Year Change in Fair Value of Equity Awards Granted in Prior Years That are Outstanding and Unvested |
|
|
|
|
|
|
|
| Pay vs Performance Disclosure |
|
|
|
|
|
|
|
| Adjustment to Compensation, Amount |
|
|
|
|
13,737,077
|
|
|
| PEO | Mr. Cil [Member] | Vesting Date Fair Value of Equity Awards Granted and Vested in Covered Year |
|
|
|
|
|
|
|
| Pay vs Performance Disclosure |
|
|
|
|
|
|
|
| Adjustment to Compensation, Amount |
|
|
|
|
699,434
|
|
|
| PEO | Mr. Cil [Member] | Change in Fair Value as of Vesting Date of Prior Year Equity Awards Vested in Covered Year |
|
|
|
|
|
|
|
| Pay vs Performance Disclosure |
|
|
|
|
|
|
|
| Adjustment to Compensation, Amount |
|
|
|
|
893,104
|
|
|
| PEO | Mr. Cil [Member] | Prior Year End Fair Value of Equity Awards Granted in Any Prior Year that Fail to Meet Applicable Vesting Conditions During Covered Year |
|
|
|
|
|
|
|
| Pay vs Performance Disclosure |
|
|
|
|
|
|
|
| Adjustment to Compensation, Amount |
|
|
|
|
0
|
|
|
| PEO | Mr. Cil [Member] | Dividends or Other Earnings Paid on Equity Awards not Otherwise Reflected in Total Compensation for Covered Year |
|
|
|
|
|
|
|
| Pay vs Performance Disclosure |
|
|
|
|
|
|
|
| Adjustment to Compensation, Amount |
|
|
|
|
4,156,340
|
|
|
| PEO | Mr. Kobza [Member] | Aggregate Grant Date Fair Value of Equity Award Amounts Reported in Summary Compensation Table |
|
|
|
|
|
|
|
| Pay vs Performance Disclosure |
|
|
|
|
|
|
|
| Adjustment to Compensation, Amount |
|
|
|
|
(26,007,809)
|
|
|
| PEO | Mr. Kobza [Member] | Year-end Fair Value of Equity Awards Granted in Covered Year that are Outstanding and Unvested |
|
|
|
|
|
|
|
| Pay vs Performance Disclosure |
|
|
|
|
|
|
|
| Adjustment to Compensation, Amount |
|
|
|
|
57,461,293
|
|
|
| PEO | Mr. Kobza [Member] | Year-over-Year Change in Fair Value of Equity Awards Granted in Prior Years That are Outstanding and Unvested |
|
|
|
|
|
|
|
| Pay vs Performance Disclosure |
|
|
|
|
|
|
|
| Adjustment to Compensation, Amount |
|
|
|
|
11,220,283
|
|
|
| PEO | Mr. Kobza [Member] | Vesting Date Fair Value of Equity Awards Granted and Vested in Covered Year |
|
|
|
|
|
|
|
| Pay vs Performance Disclosure |
|
|
|
|
|
|
|
| Adjustment to Compensation, Amount |
|
|
|
|
477,567
|
|
|
| PEO | Mr. Kobza [Member] | Change in Fair Value as of Vesting Date of Prior Year Equity Awards Vested in Covered Year |
|
|
|
|
|
|
|
| Pay vs Performance Disclosure |
|
|
|
|
|
|
|
| Adjustment to Compensation, Amount |
|
|
|
|
533,178
|
|
|
| PEO | Mr. Kobza [Member] | Prior Year End Fair Value of Equity Awards Granted in Any Prior Year that Fail to Meet Applicable Vesting Conditions During Covered Year |
|
|
|
|
|
|
|
| Pay vs Performance Disclosure |
|
|
|
|
|
|
|
| Adjustment to Compensation, Amount |
|
|
|
|
0
|
|
|
| PEO | Mr. Kobza [Member] | Dividends or Other Earnings Paid on Equity Awards not Otherwise Reflected in Total Compensation for Covered Year |
|
|
|
|
|
|
|
| Pay vs Performance Disclosure |
|
|
|
|
|
|
|
| Adjustment to Compensation, Amount |
|
|
|
|
4,561,366
|
|
|
| Non-PEO NEO | Aggregate Change in Present Value of Accumulated Benefit for All Pension Plans Reported in Summary Compensation Table |
|
|
|
|
|
|
|
| Pay vs Performance Disclosure |
|
|
|
|
|
|
|
| Adjustment to Compensation, Amount |
|
|
(1,345)
|
216
|
0
|
0
|
0
|
| Non-PEO NEO | Aggregate Grant Date Fair Value of Equity Award Amounts Reported in Summary Compensation Table |
|
|
|
|
|
|
|
| Pay vs Performance Disclosure |
|
|
|
|
|
|
|
| Adjustment to Compensation, Amount |
|
|
(6,262,032)
|
(4,777,605)
|
(5,205,781)
|
(34,402,665)
|
(4,942,911)
|
| Non-PEO NEO | Year-end Fair Value of Equity Awards Granted in Covered Year that are Outstanding and Unvested |
|
|
|
|
|
|
|
| Pay vs Performance Disclosure |
|
|
|
|
|
|
|
| Adjustment to Compensation, Amount |
|
|
6,532,198
|
2,912,303
|
6,230,469
|
53,815,223
|
3,640,557
|
| Non-PEO NEO | Year-over-Year Change in Fair Value of Equity Awards Granted in Prior Years That are Outstanding and Unvested |
|
|
|
|
|
|
|
| Pay vs Performance Disclosure |
|
|
|
|
|
|
|
| Adjustment to Compensation, Amount |
|
|
122,358
|
(2,935,383)
|
3,053,515
|
1,328,710
|
(250,129)
|
| Non-PEO NEO | Vesting Date Fair Value of Equity Awards Granted and Vested in Covered Year |
|
|
|
|
|
|
|
| Pay vs Performance Disclosure |
|
|
|
|
|
|
|
| Adjustment to Compensation, Amount |
|
|
187,996
|
205,059
|
282,346
|
264,387
|
585,031
|
| Non-PEO NEO | Change in Fair Value as of Vesting Date of Prior Year Equity Awards Vested in Covered Year |
|
|
|
|
|
|
|
| Pay vs Performance Disclosure |
|
|
|
|
|
|
|
| Adjustment to Compensation, Amount |
|
|
(82,304)
|
(177,972)
|
208,276
|
(524,058)
|
(144,704)
|
| Non-PEO NEO | Prior Year End Fair Value of Equity Awards Granted in Any Prior Year that Fail to Meet Applicable Vesting Conditions During Covered Year |
|
|
|
|
|
|
|
| Pay vs Performance Disclosure |
|
|
|
|
|
|
|
| Adjustment to Compensation, Amount |
|
|
0
|
(1,127,307)
|
0
|
0
|
0
|
| Non-PEO NEO | Dividends or Other Earnings Paid on Equity Awards not Otherwise Reflected in Total Compensation for Covered Year |
|
|
|
|
|
|
|
| Pay vs Performance Disclosure |
|
|
|
|
|
|
|
| Adjustment to Compensation, Amount |
|
|
$ 6,643
|
$ 11,353
|
$ 927,936
|
$ 878,635
|
$ 576,970
|