Pay vs Performance Disclosure
Jun. 10, 2024
Dec. 31, 2024
Dec. 31, 2025
USD ($)
Dec. 31, 2024
USD ($)
Dec. 31, 2023
USD ($)
Dec. 31, 2022
USD ($)
Dec. 31, 2021
USD ($)
Pay-Versus-Performance
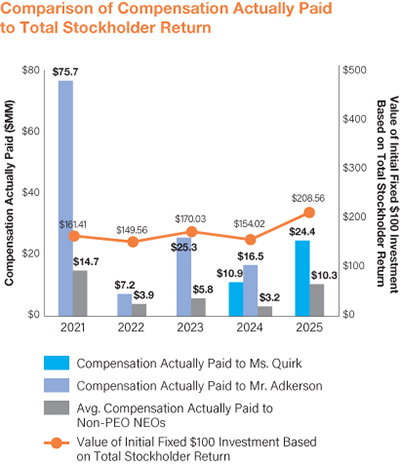
The following section has been prepared in accordance with the SEC’s pay versus performance disclosure rules mandated by the Dodd-Frank Act. Under these rules, the SEC has developed a new way to calculate executive pay, referred to as “compensation actually paid,” or CAP, which amounts are then compared to certain performance measures defined by the SEC.
The CAP does not reflect the value received or realized by our NEOs or how the compensation committee evaluates compensation decisions in light of company performance.
Please refer to “Compensation Discussion and Analysis” on page 36 for a discussion of our executive compensation program objectives and the ways in which we design our program to align executive compensation with company performance.
The CAP values are derived from the total compensation amounts reported in the Summary Compensation Table, but adjusts those amounts to replace the grant date fair values of equity awards granted during the year with the fair value of equity awards granted during the year as of the end of the year, plus changes in fair value of any outstanding unvested awards granted in prior years. Thus, unlike the Summary Compensation Table that only factors in current year equity awards, the CAP reflects year-over-year changes in value of all outstanding unvested equity awards and equity awards vesting during the year. The CAP values also replace the change in pension value reported with the pension plan service cost or prior service cost for the year.
Year |
Summary Compensation Table Total for Ms. Quirk (1) |
Compensation Actually Paid to Ms. Quirk (2) |
Summary Compensation Table Total for Mr. Adkerson (1) |
Compensation Actually Paid to Mr. Adkerson (2) |
Average Summary Compensation Table Total for Non-PEO NEOs (3) |
Average Compensation Actually Paid to Non-PEO NEOs (4) |
Value of Initial Fixed $100 Investment Based On: |
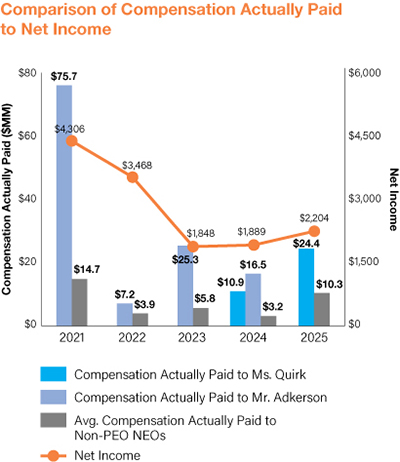
Net Income ($ in MM) (6) |
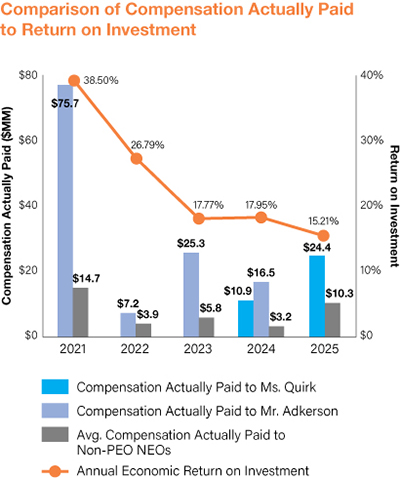
Return on Investment (7) |
|||||||||||||||||||||||||||||||
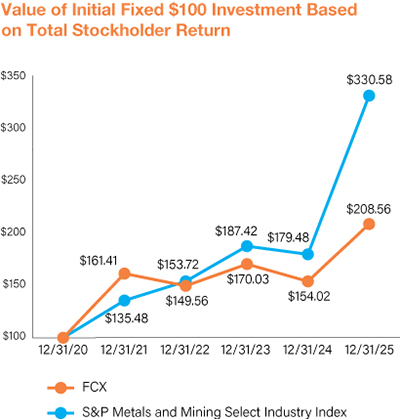
Total Stockholder Return |
Peer Group Total Stockholder Return (5) |
|||||||||||||||||||||||||||||||||||||||
2025 |
$ |
14,808,126 |
$ |
24,358,128 |
$ |
— |
$ |
— |
$ |
7,310,132 |
$10,297,566 |
$208.56 |
$330.58 |
$2,204 |
15.21% |
|||||||||||||||||||||||||
2024 |
13,286,084 |
10,935,875 |
23,744,421 |
16,451,198 |
3,646,350 |
3,185,580 |
154.02 |
179.48 |
1,889 |
17.95% |
||||||||||||||||||||||||||||||
2023 |
— |
— |
24,017,321 |
25,276,163 |
5,123,031 |
5,798,178 |
170.03 |
187.42 |
1,848 |
17.77% |
||||||||||||||||||||||||||||||
2022 |
— |
— |
20,521,929 |
7,164,637 |
5,191,453 |
3,931,649 |
149.56 |
153.72 |
3,468 |
26.79% |
||||||||||||||||||||||||||||||
2021 |
— |
— |
19,111,894 |
75,686,762 |
4,086,801 |
14,711,132 |
161.41 |
135.48 |
4,306 |
38.50% |
||||||||||||||||||||||||||||||
| (1) | For fiscal year 2025, and from June 11, 2024, through December 31, 2024, Kathleen L. Quirk served as our principal executive officer (PEO). For fiscal years 2021 through 2023 and from January 1, 2024, through June 10, 2024, Richard C. Adkerson served as our PEO. Since June 11, 2024, Mr. Adkerson has continued in his role as an executive officer and chairman of the board. |
| (2) | The amounts reported in this column represent the CAP for each PEO, as computed in accordance with Item 402(v) of Regulation S-K. The amounts do not reflect the actual amount of compensation earned by or delivered to each PEO during the applicable year. In accordance with the requirements of Item 402(v) of Regulation S-K, the adjustments reflected in the tables below were made to each PEO’s total compensation for each year reflected in the Summary Compensation Table (SCT) to determine the CAP values. For Mr. Adkerson, he has reached the maximum years of service under the SERP and thus FCX did not recognize a service cost for him during any of the years reflected in the table. |
SCT to CAP Reconciliation — PEO — Quirk (A)
Adjust Value of Current Year’s Equity Grant |
Adjust For Incremental Increase/(Decrease) in Value of All Other Outstanding Equity Grants |
|||||||||||||||||||||||||||||||||||
Year |
SCT Total |
Subtract Pension Value reported in SCT |
Subtract Grant Date Fair Value as reported in SCT |
Add Fair Value at 12/31 |
Add Change in Fair Value of Unvested Awards as of 12/31 |
Add Change in Fair Value of Vested Awards during Year |
Forfeited during Year |
Accrued Dividend Equivalents |
CAP |
|||||||||||||||||||||||||||
2025 |
$14,808,126 |
$ — |
$(11,631,590) |
$15,669,610 |
$2,677,515 |
$2,461,467 |
$ — |
$373,000 |
$24,358,128 |
|||||||||||||||||||||||||||
2024 |
13,286,084 |
— |
(9,528,290) |
8,606,435 |
(731,685 |
) |
(1,111,390 |
) |
— |
414,721 |
10,935,875 |
|||||||||||||||||||||||||
SCT to CAP Reconciliation — PEO — Adkerson (A)
Adjust Value of Current Year’s Equity Grant |
Adjust For Incremental Increase/(Decrease) in Value of All Other Outstanding Equity Grants |
|||||||||||||||||||||||||||||||||||
Year |
SCT Total |
Subtract Pension Value reported in SCT |
Subtract Grant Date Fair Value as reported in SCT |
Add Fair Value at 12/31 |
Add Change in Fair Value of Unvested Awards as of 12/31 |
Add Change in Fair Value of Vested Awards during Year |
Forfeited during Year |
Accrued Dividend Equivalents |
CAP |
|||||||||||||||||||||||||||
2024 |
$23,744,421 |
$(4,385,577) |
$(12,542,380) |
$11,730,530 |
$(1,157,955) |
$(1,762,113) |
$ — |
$824,272 |
$16,451,198 |
|||||||||||||||||||||||||||
2023 |
24,017,321 |
(3,904,609 |
) |
(12,518,840 |
) |
12,051,685 |
134,268 |
5,037,937 |
— |
458,401 |
25,276,163 |
|||||||||||||||||||||||||
2022 |
20,521,929 |
(3,505,075 |
) |
(11,036,050 |
) |
10,018,375 |
(5,674,233 |
) |
(4,664,116 |
) |
— |
1,503,807 |
7,164,637 |
|||||||||||||||||||||||
2021 |
19,111,894 |
(3,163,533 |
) |
(9,818,515 |
) |
24,933,600 |
25,690,784 |
18,530,775 |
— |
401,757 |
75,686,762 |
|||||||||||||||||||||||||
| (A) | In determining the fair value of unvested equity awards, we applied the same methodology used to determine grant date fair value of equity awards for purposes of accounting for share-based payments as described in our 2025 Form 10-K, but calculated fair value as of the last day of the year. Factors impacting the fair value of the equity awards primarily relate to the price of our common stock at year end, as well as the projected and actual achievement of performance goals related to our PSUs. |
| (3) | Our NEOs other than our PEOs for each fiscal year included in the table were as follows: 2025 — Richard C. Adkerson, Maree E. Robertson, Stephen T. Higgins and Douglas N. Currault II; 2024 — Maree E. Robertson, Stephen T. Higgins and Douglas N. Currault II; 2023 and 2022 — Kathleen L. Quirk, Maree E. Robertson, Stephen T. Higgins and Douglas N. Currault II; and 2021 — Kathleen L. Quirk, Stephen T. Higgins and Douglas N. Currault II. The amounts reported in this column represent the average of the total compensation reported for each NEO (excluding our PEOs) in the Summary Compensation Table in each applicable year. |
| (4) | The amounts reported in this column represent the average CAP for the NEOs as a group (excluding our PEOs), as computed in accordance with Item 402(v) of Regulation S-K. The amounts do not reflect the actual average amount of compensation earned by or delivered to the NEOs as a group during the applicable year. In accordance with the requirements of Item 402(v) of Regulation S-K, the adjustments reflected in the table below were made to the average total compensation for the NEOs for each year reflected in the Summary Compensation Table on page 51 to determine the CAP values. Messrs. Adkerson and Higgins, the only NEOs who have pension benefits, reached the maximum years of service under the SERP and SRP, respectively, and thus FCX did not recognize a service cost for them during any of the years reflected in the table. |
SCT to CAP Reconciliation — Average of All Other NEOs (A)
Adjust Value of Current Year’s Equity Grant |
Adjust For Incremental Increase/(Decrease) in Value of All Other Outstanding Equity Grants |
|||||||||||||||||||||||||||||||||||
Year |
SCT Total |
Subtract Pension Value reported in SCT |
Subtract Grant Date Fair Value as reported in SCT |
Add Fair Value at 12/31 |
Add Change in Fair Value of Unvested Awards as of 12/31 |
Add Change in Fair Value of Awards Vested during Year |
Forfeited during Year |
Accrued Dividend Equivalents |
CAP |
|||||||||||||||||||||||||||
2025 |
$ 7,310,132 |
$ |
(1,294,491) |
$ |
(3,733,371) |
$5,031,230 |
$1,349,631 |
$1,473,360 |
$ |
— |
$161,075 |
$10,297,566 |
||||||||||||||||||||||||
2024 |
3,646,350 |
— |
(1,917,153 |
) |
1,799,912 |
(182,497 |
) |
(223,898 |
) |
— |
62,867 |
3,185,580 |
||||||||||||||||||||||||
2023 |
5,123,031 |
(311 |
) |
(3,266,249 |
) |
3,152,590 |
113,415 |
576,402 |
— |
99,300 |
5,798,178 |
|||||||||||||||||||||||||
2022 |
5,191,453 |
— |
(3,358,315 |
) |
2,970,644 |
(600,525 |
) |
(459,070 |
) |
— |
187,462 |
3,931,649 |
||||||||||||||||||||||||
2021 |
4,086,801 |
— |
(2,132,295 |
) |
4,334,855 |
4,842,400 |
3,498,433 |
— |
80,938 |
14,711,132 |
||||||||||||||||||||||||||
| (A) | In determining the fair value of unvested equity awards, we applied the same methodology used to determine grant date fair value of equity awards for purposes of accounting for share-based payments as described in our 2025 Form 10-K, but calculated fair value as of the last day of the year. Factors impacting the fair value of the equity awards primarily relate to the price of our common stock at year end, as well as the projected and actual achievement of performance goals related to our PSUs. |
| (5) | Represents the weighted peer group total stockholder return, or “TSR,” weighted according to the respective companies’ stock market capitalization at the beginning of each period for which a return is indicated. The peer group used for this purpose is the following published industry index: S&P Metals and Mining Select Industry Index, which is the industry line peer group reported in our performance graph under Item 201(e) of Regulation S-K included in our annual reports. |
| (6) | Net income represents net income attributable to common stock as reported in our consolidated financial statements that appear in our annual reports on Form 10-K. |
| (7) | While we use numerous financial and non-financial performance measures for the purpose of evaluating performance under our AIP and LTIP, we believe that ROI represents the most important performance measure (that is not otherwise required to be disclosed in the table) we use to link compensation actually paid to our executive officers to company performance. Per SEC guidance, the table reflects our annual ROI for each year; however, we use a three-year average ROI to measure performance for purposes of the PSUs granted under our LTIP. |
S-K
included in our annual reports.
| (2) | The amounts reported in this column represent the CAP for each PEO, as computed in accordance with Item 402(v) of Regulation S-K. The amounts do not reflect the actual amount of compensation earned by or delivered to each PEO during the applicable year. In accordance with the requirements of Item 402(v) of Regulation S-K, the adjustments reflected in the tables below were made to each PEO’s total compensation for each year reflected in the Summary Compensation Table (SCT) to determine the CAP values. For Mr. Adkerson, he has reached the maximum years of service under the SERP and thus FCX did not recognize a service cost for him during any of the years reflected in the table. |
SCT to CAP Reconciliation — PEO — Quirk (A)
Adjust Value of Current Year’s Equity Grant |
Adjust For Incremental Increase/(Decrease) in Value of All Other Outstanding Equity Grants |
|||||||||||||||||||||||||||||||||||
Year |
SCT Total |
Subtract Pension Value reported in SCT |
Subtract Grant Date Fair Value as reported in SCT |
Add Fair Value at 12/31 |
Add Change in Fair Value of Unvested Awards as of 12/31 |
Add Change in Fair Value of Vested Awards during Year |
Forfeited during Year |
Accrued Dividend Equivalents |
CAP |
|||||||||||||||||||||||||||
2025 |
$14,808,126 |
$ — |
$(11,631,590) |
$15,669,610 |
$2,677,515 |
$2,461,467 |
$ — |
$373,000 |
$24,358,128 |
|||||||||||||||||||||||||||
2024 |
13,286,084 |
— |
(9,528,290) |
8,606,435 |
(731,685 |
) |
(1,111,390 |
) |
— |
414,721 |
10,935,875 |
|||||||||||||||||||||||||
SCT to CAP Reconciliation — PEO — Adkerson (A)
Adjust Value of Current Year’s Equity Grant |
Adjust For Incremental Increase/(Decrease) in Value of All Other Outstanding Equity Grants |
|||||||||||||||||||||||||||||||||||
Year |
SCT Total |
Subtract Pension Value reported in SCT |
Subtract Grant Date Fair Value as reported in SCT |
Add Fair Value at 12/31 |
Add Change in Fair Value of Unvested Awards as of 12/31 |
Add Change in Fair Value of Vested Awards during Year |
Forfeited during Year |
Accrued Dividend Equivalents |
CAP |
|||||||||||||||||||||||||||
2024 |
$23,744,421 |
$(4,385,577) |
$(12,542,380) |
$11,730,530 |
$(1,157,955) |
$(1,762,113) |
$ — |
$824,272 |
$16,451,198 |
|||||||||||||||||||||||||||
2023 |
24,017,321 |
(3,904,609 |
) |
(12,518,840 |
) |
12,051,685 |
134,268 |
5,037,937 |
— |
458,401 |
25,276,163 |
|||||||||||||||||||||||||
2022 |
20,521,929 |
(3,505,075 |
) |
(11,036,050 |
) |
10,018,375 |
(5,674,233 |
) |
(4,664,116 |
) |
— |
1,503,807 |
7,164,637 |
|||||||||||||||||||||||
2021 |
19,111,894 |
(3,163,533 |
) |
(9,818,515 |
) |
24,933,600 |
25,690,784 |
18,530,775 |
— |
401,757 |
75,686,762 |
|||||||||||||||||||||||||
| (A) | In determining the fair value of unvested equity awards, we applied the same methodology used to determine grant date fair value of equity awards for purposes of accounting for share-based payments as described in our 2025 Form 10-K, but calculated fair value as of the last day of the year. Factors impacting the fair value of the equity awards primarily relate to the price of our common stock at year end, as well as the projected and actual achievement of performance goals related to our PSUs. |
| (4) | The amounts reported in this column represent the average CAP for the NEOs as a group (excluding our PEOs), as computed in accordance with Item 402(v) of Regulation S-K. The amounts do not reflect the actual average amount of compensation earned by or delivered to the NEOs as a group during the applicable year. In accordance with the requirements of Item 402(v) of Regulation S-K, the adjustments reflected in the table below were made to the average total compensation for the NEOs for each year reflected in the Summary Compensation Table on page 51 to determine the CAP values. Messrs. Adkerson and Higgins, the only NEOs who have pension benefits, reached the maximum years of service under the SERP and SRP, respectively, and thus FCX did not recognize a service cost for them during any of the years reflected in the table. |
SCT to CAP Reconciliation — Average of All Other NEOs (A)
Adjust Value of Current Year’s Equity Grant |
Adjust For Incremental Increase/(Decrease) in Value of All Other Outstanding Equity Grants |
|||||||||||||||||||||||||||||||||||
Year |
SCT Total |
Subtract Pension Value reported in SCT |
Subtract Grant Date Fair Value as reported in SCT |
Add Fair Value at 12/31 |
Add Change in Fair Value of Unvested Awards as of 12/31 |
Add Change in Fair Value of Awards Vested during Year |
Forfeited during Year |
Accrued Dividend Equivalents |
CAP |
|||||||||||||||||||||||||||
2025 |
$ 7,310,132 |
$ |
(1,294,491) |
$ |
(3,733,371) |
$5,031,230 |
$1,349,631 |
$1,473,360 |
$ |
— |
$161,075 |
$10,297,566 |
||||||||||||||||||||||||
2024 |
3,646,350 |
— |
(1,917,153 |
) |
1,799,912 |
(182,497 |
) |
(223,898 |
) |
— |
62,867 |
3,185,580 |
||||||||||||||||||||||||
2023 |
5,123,031 |
(311 |
) |
(3,266,249 |
) |
3,152,590 |
113,415 |
576,402 |
— |
99,300 |
5,798,178 |
|||||||||||||||||||||||||
2022 |
5,191,453 |
— |
(3,358,315 |
) |
2,970,644 |
(600,525 |
) |
(459,070 |
) |
— |
187,462 |
3,931,649 |
||||||||||||||||||||||||
2021 |
4,086,801 |
— |
(2,132,295 |
) |
4,334,855 |
4,842,400 |
3,498,433 |
— |
80,938 |
14,711,132 |
||||||||||||||||||||||||||
| (A) | In determining the fair value of unvested equity awards, we applied the same methodology used to determine grant date fair value of equity awards for purposes of accounting for share-based payments as described in our 2025 Form 10-K, but calculated fair value as of the last day of the year. Factors impacting the fair value of the equity awards primarily relate to the price of our common stock at year end, as well as the projected and actual achievement of performance goals related to our PSUs. |
Performance Measures
As described in greater detail in “Compensation Discussion and Analysis,” our executive compensation program reflects a philosophy. The metrics that we use under our AIP and LTIP are selected with the objective of linking our NEO’s compensation to the key metrics driving our future growth and incentivizing our NEOs to focus on critical elements of our strategic priorities each year. In accordance with the requirements of Item 402(v) of Regulation
pay-for-performance
S-K,
the most important financial and non-financial
performance measures used to link executive compensation actually paid to our NEOs, for the most recently completed fiscal year, to our performance are as follows: Most Important Performance Measures (Without Ranking) | ||
§ Return on Investment |
§ Relative TSR | |
§ Consolidated Adjusted EBITDA |
§ Copper Sales | |