Pay vs Performance Disclosure - USD ($)
Dec. 31, 2025
Dec. 31, 2024
Dec. 31, 2023
Dec. 31, 2022
Dec. 31, 2021
| Year | Summary compensation table total for PEO ($)(1) | Compensation actually paid to PEO ($)(2) (3) | Average summary compensation table total for non-PEO named executive officers ($)(1) | Average compensation actually paid to non-PEO named executive officers ($)(1) (2) (3) | Value of Initial Fixed $100 investment based on Total Shareholder Return ($)(4) | Net income (loss) attributable to common stockholders ($ in thousands) | ||||||||||||||||||||||||||||||||
| 2025 | 12,843,261 | 5,984,267 | 2,456,952 | 228,871 | 252.15 | (306,434) | ||||||||||||||||||||||||||||||||
| 2024 | 4,729,311 | 17,040,792 | 1,649,034 | 4,857,558 | 368.90 | (61,751) | ||||||||||||||||||||||||||||||||
| 2023 | 11,587,552 | 13,730,641 | 3,871,347 | 4,129,042 | 228.23 | (182,745) | ||||||||||||||||||||||||||||||||
| 2022 | 11,112,239 | 14,942,672 | 3,590,843 | 4,104,788 | 236.36 | (84,353) | ||||||||||||||||||||||||||||||||
| 2021 | 9,202,686 | 8,768,254 | 3,301,344 | 3,197,972 | 136.36 | (40,396) | ||||||||||||||||||||||||||||||||
(3)Compensation Actually Paid reflects the exclusions and inclusions for the PEO and, on average, the non-PEO named executive officers set forth below. Amounts excluded, which are set forth in the “Minus Stock Awards from Summary Compensation Table” columns below, represent the Stock Awards reported in the “Stock Awards” column of the Summary Compensation Table for each applicable year. Amounts added back to determine Compensation Actually Paid are made up of the following components which are set forth in the table below, as applicable: (i) the fair value as of the end of the fiscal year of outstanding and unvested equity awards granted in that year; (ii) the change in fair value during the year of equity awards granted in prior years that remained outstanding and unvested at the end of the year; (iii) the fair value as of the vesting date of equity awards that were granted and vested in that year; and (iv) the change in fair value during the year through the vesting date of equity awards granted in prior years that vested during that year. The fair value at the end of the prior year of awards granted in any prior year that failed to meet applicable vesting conditions during the covered year are subtracted, although there were no such awards for the PEO or the non-PEO named executive officers in 2022, 2023 or 2024. The dollar value of any dividends or other earnings paid on stock awards in a covered fiscal year prior to the vesting date that are not otherwise included in the total compensation for the covered fiscal year are added, although there were no such payments for the PEO or the non-PEO named executive officers in 2022, 2023 or 2024. Equity values are calculated in accordance with ASC Topic 718.
| Year | Summary compensation table total for PEO ($) | Minus stock awards from summary compensation table ($) | Plus year-end equity value of unvested awards granted during year ($) | Plus change in value of unvested awards granted in prior years ($) | Plus value of awards granted and vested during year ($) | Plus change in value of prior year awards vested during year ($) | Compensation actually paid to PEO ($) | |||||||||||||||||||||||||||||||||||||
| 2025 | 12,843,261 | (9,903,480) | 3,714,970 | (5,733,632) | 1,365,640 | 3,697,508 | 5,984,267 | |||||||||||||||||||||||||||||||||||||
| 2024 | 4,729,311 | (3,006,812) | 5,224,079 | 7,658,748 | — | 2,435,466 | 17,040,792 | |||||||||||||||||||||||||||||||||||||
| 2023 | 11,587,552 | (8,244,858) | 6,183,657 | -491,119 | — | 4,695,409 | 13,730,641 | |||||||||||||||||||||||||||||||||||||
| 2022 | 11,112,239 | (9,578,906) | 5,722,220 | 5,771,336 | 679,106 | 1,236,677 | 14,942,672 | |||||||||||||||||||||||||||||||||||||
| 2021 | 9,202,686 | (7,851,228) | 6,786,705 | 599,920 | — | 30,171 | 8,768,254 | |||||||||||||||||||||||||||||||||||||
| Year | Average summary compensation table total for non-PEO named executive officers ($) | Minus stock awards from summary compensation table ($) | Plus year-end equity value of unvested awards granted during year ($) | Plus change in value of unvested awards granted in prior years ($) | Plus value of awards granted and vested during year ($) | Plus change in value of prior year awards vested during year ($) | Average compensation actually paid to non-PEO named executive officers ($) | |||||||||||||||||||||||||||||||||||||
| 2025 | 2,456,952 | (1,502,310) | 564,425 | (2,030,512) | 297,403 | 442,913 | 228,871 | |||||||||||||||||||||||||||||||||||||
| 2024 | 1,649,034 | (835,225) | 1,451,132 | 1,996,809 | — | 595,808 | 4,857,558 | |||||||||||||||||||||||||||||||||||||
| 2023 | 3,871,347 | (2,438,664) | 1,717,680 | -124,672 | 148430 | 954,921 | 4,129,042 | |||||||||||||||||||||||||||||||||||||
| 2022 | 3,590,843 | (2,745,426) | 1,527,756 | 1,274,204 | 322,935 | 134,476 | 4,104,788 | |||||||||||||||||||||||||||||||||||||
| 2021 | 3,301,344 | (2,542,010) | 2,265,038 | 75,240 | — | 98,360 | 3,197,972 | |||||||||||||||||||||||||||||||||||||
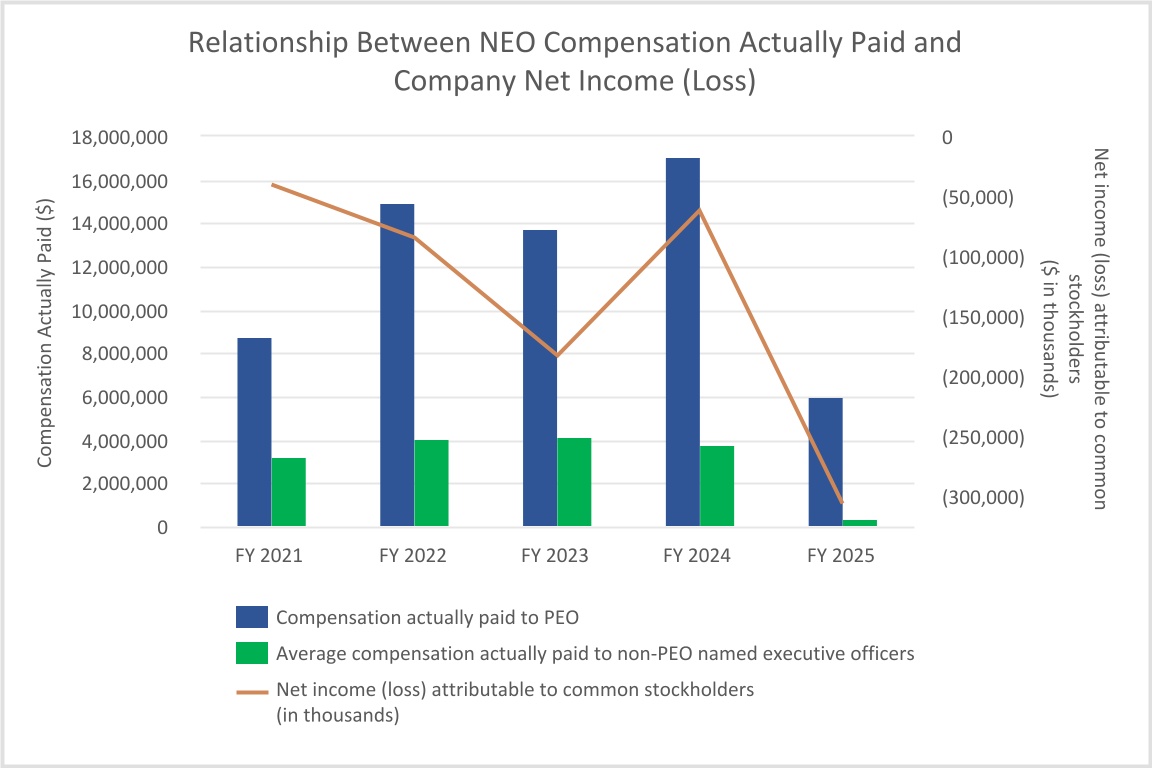
The following chart sets forth the relationship between Compensation Actually Paid to our PEO, the average of Compensation Paid to our Non-PEO named executive officers, and the Company’s TSR over the fiscal three-year period from 2023 through 2025.
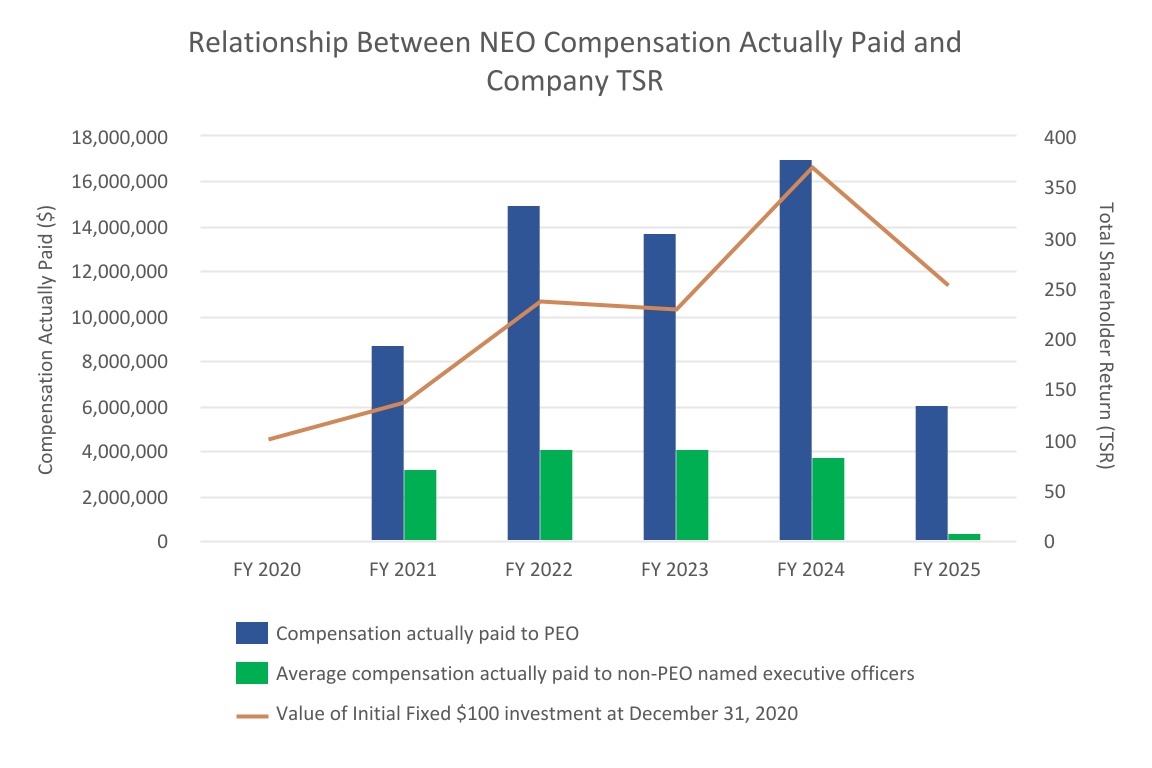
The following chart sets forth the relationship between Compensation Actually Paid to our PEO, the average of Compensation Paid to our Non-PEO named executive officers, and the Company’s TSR over the fiscal five-year period from 2021 through 2025.
The fair value or change in fair value, as applicable, of stock awards was determined by reference to (x) for RSU awards, the closing price of our common stock on the applicable measurement date, (y) for PSU awards (excluding market-conditioned awards), the closing price of our common stock on the applicable measurement date, and (z) for market-conditioned PSU awards, a Monte Carlo simulation with reference to the risk free rate, dividend yield and volatility assumptions as of the applicable measurement date.
Description of the Information Presented in the Pay Versus Performance Table
As described in greater detail above in this proxy statement, the Company’s executive compensation program reflects a pay-for-performance philosophy. While the Company aligns executive compensation with Company performance by providing for compensation outcomes aligned with significant value creation events, not all of such events are measures presented in the Pay Versus Performance table. Moreover, the Company generally seeks to incentivize long-term performance, and therefore does not specifically align Company performance measures with compensation that is actually paid (as computed in accordance with Item 402(v) of Regulation S-K) for a particular fiscal year. Compensation actually paid is influenced by numerous factors, including but not limited to the timing of new grant issuances and outstanding grant vesting, share price volatility during the fiscal year, and many other factors. In accordance with Item 402(v) of Regulation S-K, the Company is providing the following descriptions for the relationships between information represented in the Pay Versus Performance table.