PAY VERSUS PERFORMANCE
This disclosure has been prepared in accordance with the SEC’s pay versus performance rules in Item 402(v) of Regulation S-K under the 1934 Act (“Item 402(v)”) and does not necessarily reflect value actually realized by the NEOs. The following tables and related disclosures provide information about (i) the total compensation (“SCT Total”) of our principal executive officer (“PEO”) and our non-PEO NEOs (collectively, the “Other NEOs”) as presented in the Summary Compensation Table on page 50, (ii) the “compensation actually paid” (“CAP”) to our PEO and our Other NEOs, as calculated pursuant to Item 402(v), (iii) certain financial performance measures used by the Company when making compensation decisions, and (iv) the relationship of the CAP to those financial performance measures.
| Summary Compensation Total for PEO ($) |
Compensation Actually Paid to PEO ($)(2) |
Average Summary Compensation Table Total for Non-PEO Named Executive Officers ($) |
Average Compensation Actually Paid to Non-PEO Named Executive Officers ($)(2) |
Value of Initial Fixed
$100 Investment Based On: |
Net Income ($M) |
Company EBITDA | ||||||||||
| Year(1) | Total Shareholder Return ($) |
Peer Group Total Shareholder Return ($)(3) |
||||||||||||||
| FY26 | 4,955,340 | 426,362 | 3,111,661 | 1,304,203 | 24 | 126 | 4.1 | 36.1 | ||||||||
| FY25 | 4,671,414 | 4,242,538 | 3,454,639 | 3,481,915 | 45 | 102 | 11.6 | 47.8 | ||||||||
| FY24 | 9,092,935 | 3,744,799 | 1,722,952 | 917,163 | 41 | 87 | 23.9 | 54 | ||||||||
| FY23 | 3,204,682 | (2,926,332 | ) | 2,411,309 | 182,775 | 229 | 118 | 28.2 | 60.4 | |||||||
| FY22 | 1,640,096 | (961,134 | ) | 1,798,217 | 1,123,546 | 445 | 122 | 45.9 | 55.5 | |||||||
| (1) | The Principal Executive Officer (“PEO”) in all five reporting years is our CEO, Shawn Nelson. The Non-PEO NEOs for fiscal years 2026 and 2025 are Mary Fox and Keith Siegner. The Non-PEO NEOs for fiscal year 2024 are Jack Krause, Mary Fox, Donna Dellomo, and Keith Siegner. The Non-PEO NEOs for fiscal years 2023 and 2022 are Jack Krause, Mary Fox, and Donna Dellomo. |
| (2) | “Compensation actually paid” amounts to our CEO and NEOs in each of 2026, 2025, 2024, 2023, and 2022, reflect the respective Summary Compensation Total with adjustments shown below as determined pursuant to SEC rules. |
| Year | SCT
Total ($) |
Minus
SCT Change in Pension Value ($) |
Plus
Pension Value Service Cost ($) |
Minus
SCT Equity ($) |
Plus
(Minus) EOY Fair Value of Equity Awards Granted During Fiscal Year that are Outstanding and Unvested at EOY ($) |
Plus
(Minus) Change from BOY to EOY in Fair Value of Awards Granted in Any Prior Fiscal Year that are Outstanding and Unvested at EOY ($) |
Plus
Fair Value at Vesting Date of Awards Granted and Vested During the Fiscal Year ($) |
Plus
(Minus) Change in Fair Value from BOY to Vesting Date of Awards Granted in Any Prior Fiscal Year that Vested During the Fiscal Year ($) |
Minus
Fair Value at BOY of Awards Granted in Prior Year that were Forfeited During the Fiscal Year ($) |
Plus
Value of Dividends or Other Earnings Paid on Stock or Option Awards not Otherwise Reflected in Fair Value or Total Compensation ($) |
Calculated CAP ($) | |||||||||||
| PEO | ||||||||||||||||||||||
| 2026 | 4,955,340 | 0 | 0 | 1,995,776 | 1,345,782 | (3,759,364) | 0 | (119,620) | 0 | 0 | 426,362 | |||||||||||
| 2025 | 4,671,414 | 0 | 0 | 3,840,346 | 3,848,324 | (409,567) | 0 | (27,287) | 0 | 0 | 4,242,538 | |||||||||||
| 2024 | 9,092,935 | 0 | 0 | 8,526,949 | 3,254,606 | (37,011) | 0 | (38,782) | 0 | 0 | 3,744,799 | |||||||||||
| 2023 | 3,204,682 | 0 | 0 | 2,472,858 | 1,362,906 | (494,398) | 0 | (4,526,664) | 0 | 0 | (2,926,332) | |||||||||||
| 2022 | 1,640,096 | 0 | 0 | 732,744 | 441,972 | (2,832,849) | 0 | 522,391 | 0 | 0 | (961,134) | |||||||||||
| Average Non-PEO NEOs | ||||||||||||||||||||||
| 2026 | 3,111,661 | 0 | 0 | 1,448,945 | 977,046 | (1,219,251) | 0 | (116,308) | 0 | 0 | 1,304,203 | |||||||||||
| 2025 | 3,454,639 | 0 | 0 | 2,644,490 | 2,640,910 | 37,211 | 0 | (6,355) | 0 | 0 | 3,481,915 | |||||||||||
| 2024 | 1,722,952 | 0 | 0 | 1,267,306 | 508,592 | (28,080) | 0 | (18,995) | 0 | 0 | 917,163 | |||||||||||
| 2023 | 2,411,309 | 0 | 0 | 1,579,290 | 870,419 | (346,322) | 0 | (1,173,341) | 0 | 0 | 182,775 | |||||||||||
| 2022 | 1,798,217 | 0 | 0 | 884,257 | 538,217 | (606,465) | 0 | 277,834 | 0 | 0 | 1,123,546 | |||||||||||
 |
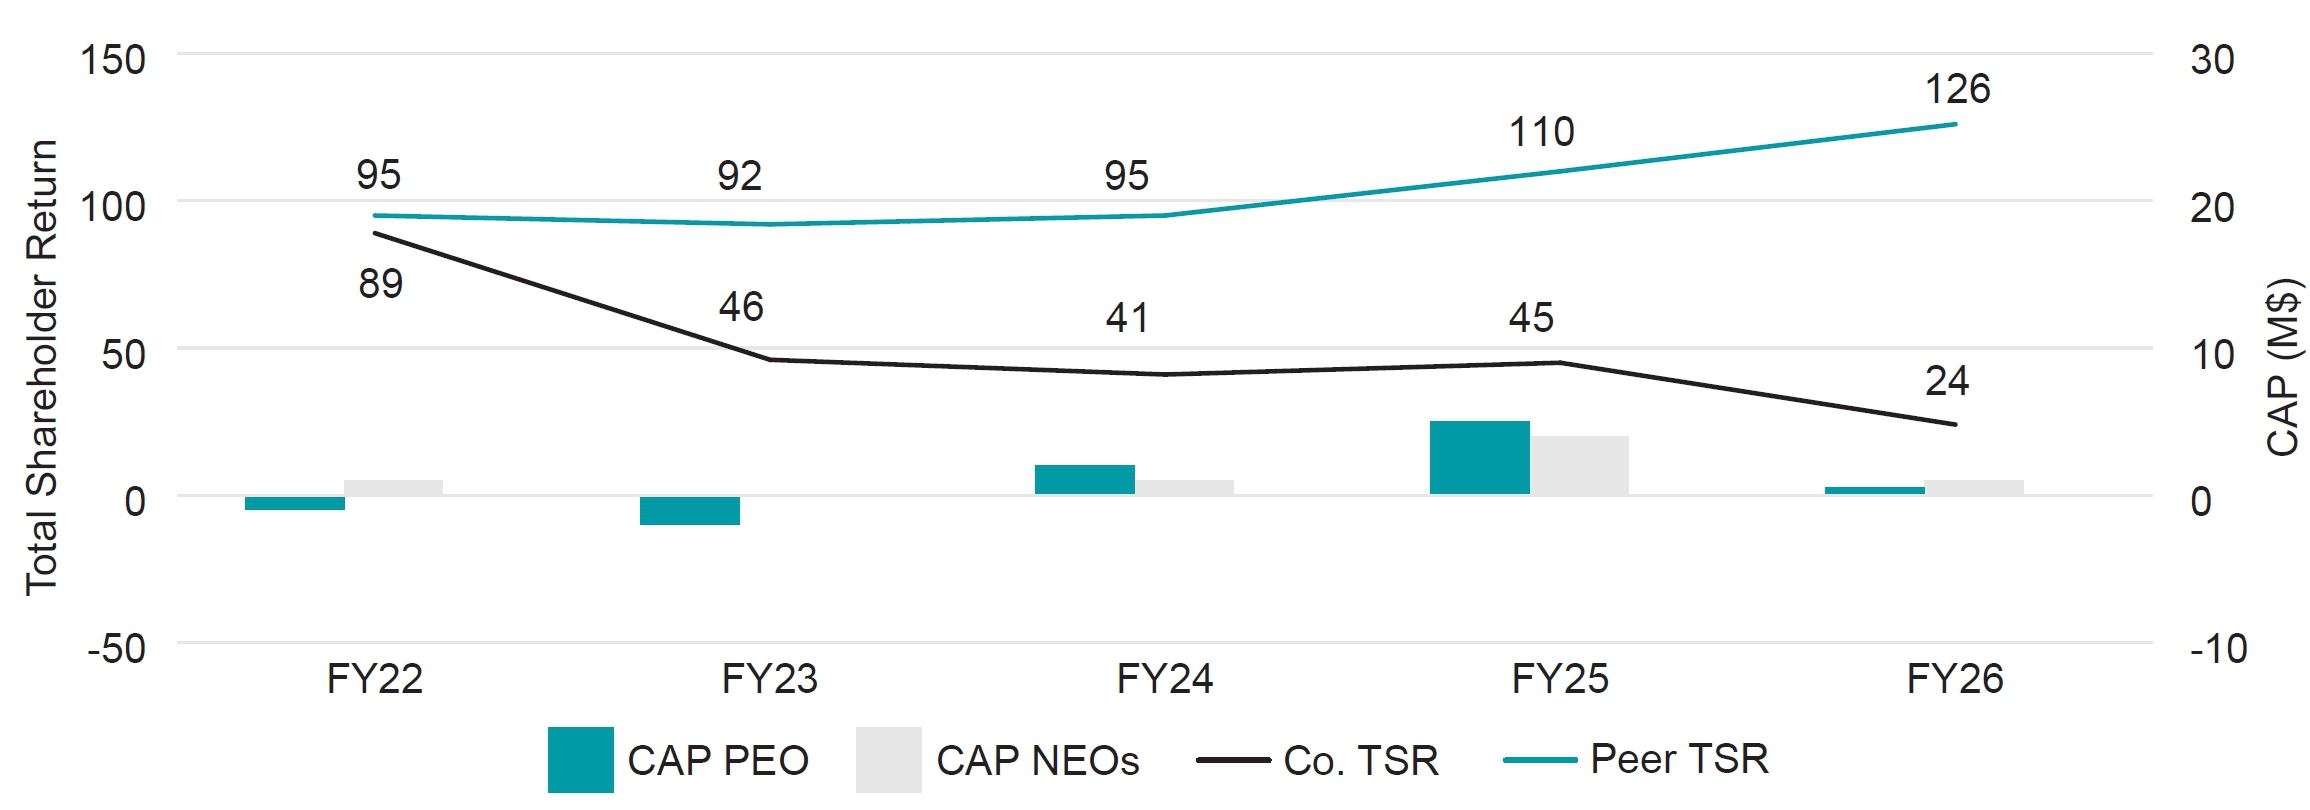
CAP VS TSR FY22 - FY26 |
|
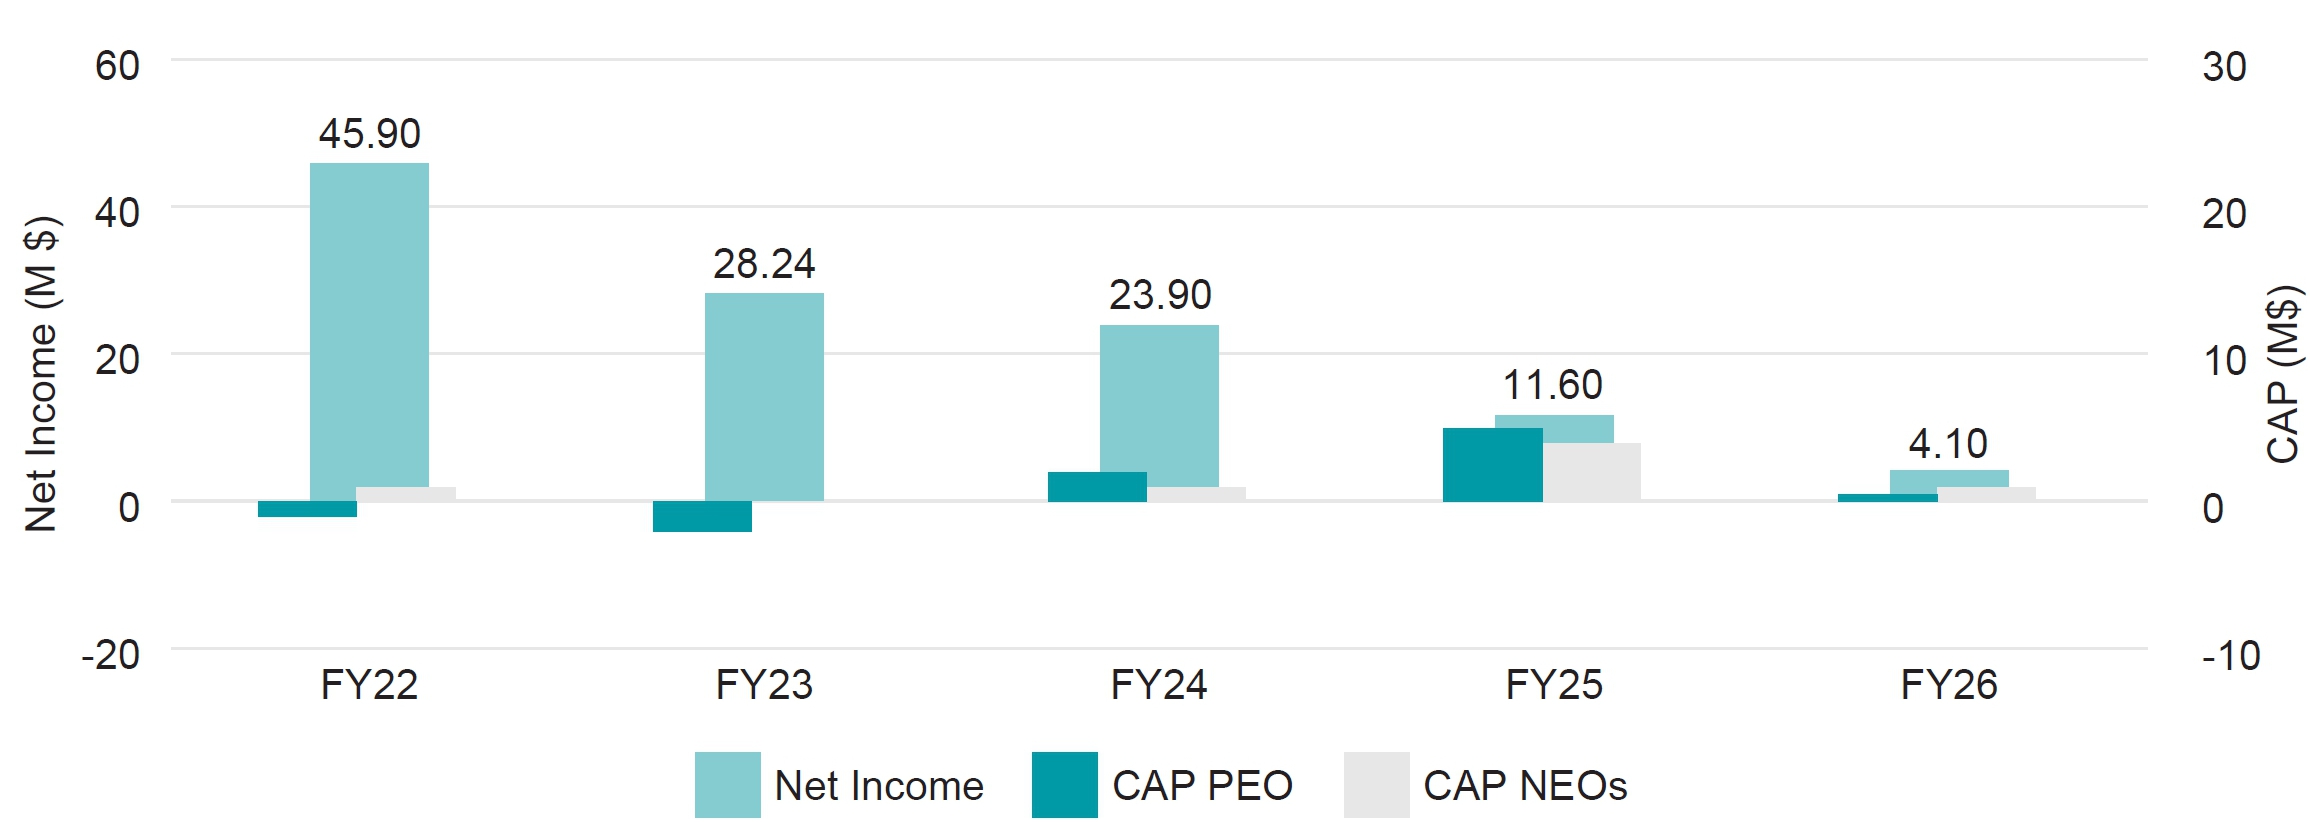
CAP VS NET INCOME FY22 - FY26 |
|
CAP VS ADJUSTED EBITDA FY22 - FY26 |
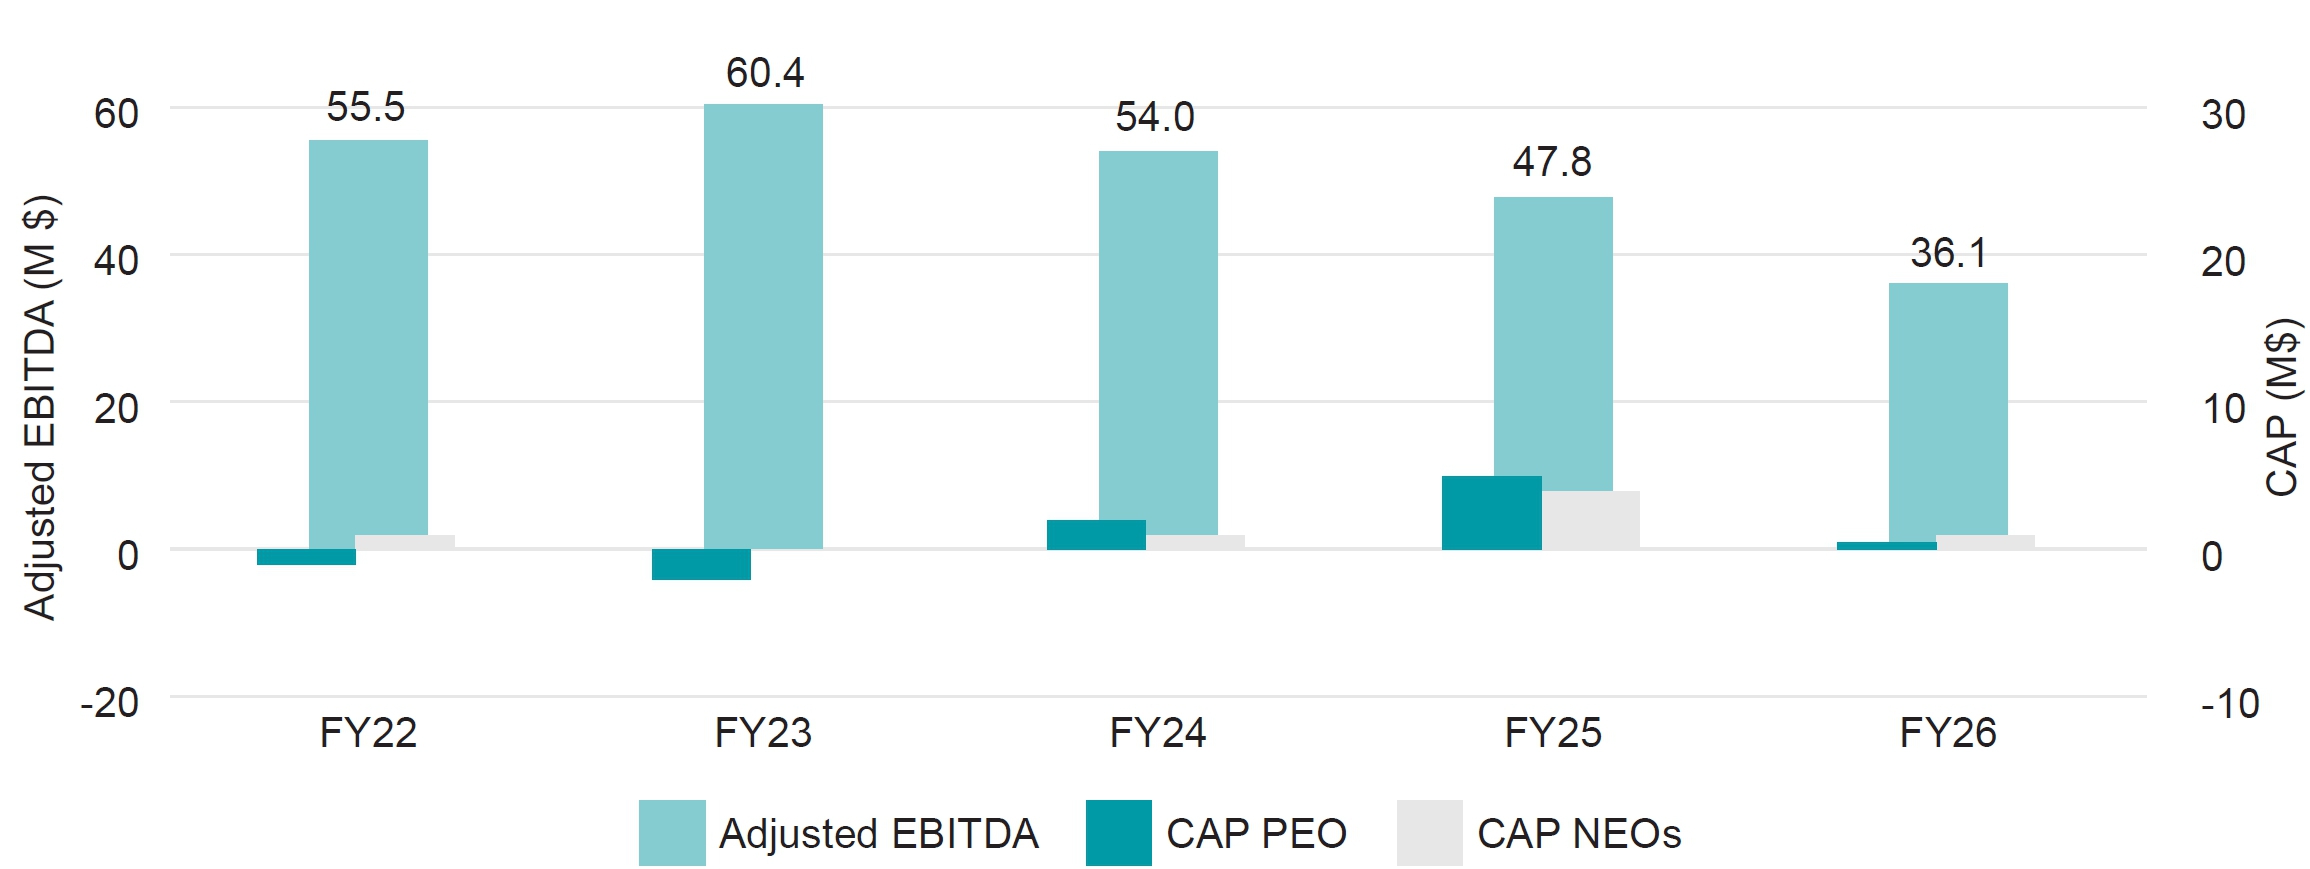
FINANCIAL PERFORMANCE MEASURES
As described in detail in the “Compensation Discussion and Analysis,” the Company’s executive compensation program consists of several compensation elements reflecting the Company’s pay for performance philosophy, including equity compensation. The most important financial performance measures used to link compensation actually paid to the Company’s named executive officers with the Company’s performance for fiscal 2026 are adjusted EBITDA and net sales.