Pay vs Performance Disclosure - USD ($)
|
12 Months Ended |
Dec. 31, 2025 |
Dec. 31, 2024 |
| Pay vs Performance Disclosure |
|
|
| Pay vs Performance Disclosure, Table |
| | | | | | | | | | | | | | | | | | | | | | | | | | | | | | | Year | Summary Compensation Table Total for PEO ($)(1) | Compensation Actually Paid to PEO ($)(2) | Average Summary Compensation Table Total for Non-PEO NEOs ($)(1) | Average Compensation Actually Paid to Non-PEO NEOs ($)(2)(3) | Year-end value of $100 invested on 03/21/2024 based on: | Net Income (in millions) ($)(6) | Company-Selected Measure: Revenue (in millions) ($)(7) | | Total Shareholder Return ($)(4) | Peer Group Total Shareholder Return ($)(5) | | | | | | | | | | | | | 2025 | 3,101,009 | | 307,430,831 | | 2,702,619 | | 47,610,252 | | 455.73 | | 130.94 | | 530 | | 2,203 | | | | 2024 | 2,613,869 | | 861,753,126 | | 6,947,158 | | 155,342,721 | | 324.03 | | 118.17 | | (484) | | 1,300 | | |
|
|
| Company Selected Measure Name |
Revenue
|
|
| Named Executive Officers, Footnote |
Amounts shown are the total compensation as calculated in the Summary Compensation Table for our Chief Executive Officer (Mr. Huffman) and the average for our non-PEO NEOs (Messrs. Vollero, Slowe, and Lee and Ms. Wong).
|
|
| Peer Group Issuers, Footnote |
The peer group used for the purpose of this disclosure in each covered year is the Dow Jones Internet Composite Index (DJINET) which we also use in the stock performance graph required by Item 201(e) of Regulation S-K included in our Annual Report. This column assumes $100.00 was invested in this peer group on March 21, 2024 (same period as used for footnote (4) above).
|
|
| PEO Total Compensation Amount |
$ 3,101,009
|
$ 2,613,869
|
| PEO Actually Paid Compensation Amount |
$ 307,430,831
|
861,753,126
|
| Adjustment To PEO Compensation, Footnote |
Amounts shown reflect “compensation actually paid” for our Chief Executive Officer and the average compensation actually paid for our non-PEO NEOs. These amounts are calculated in accordance with SEC rules and do not reflect compensation actually earned, realized, or received. As required, the dollar amounts include (among other items) unvested amounts of equity compensation that may be realizable in future periods, and as such, the dollar amounts shown do not represent the actual final amount of compensation earned or actually paid to our Named Executive Officers during the applicable years. The adjustments made to the Summary Compensation Table to determine compensation actually paid (with fair value measured at year-end rather than at grant) are shown in the table below. | | | | | | | | | | | | | | | | | | | | | | PEO | | Average Non-PEO NEOs | | | Year | 12/31/2024 ($) | 12/31/2025 ($) | | 12/31/2024 ($) | 12/31/2025 ($) | | | | | | | | | | Total Compensation from Summary Compensation Table | 2,613,869 | | 3,101,009 | | | 6,947,158 | | 2,702,619 | | | | Adjustments for Equity Awards: | | | | | | | | Adjustment for grant date values in the Summary Compensation Table | — | | — | | | (5,576,457) | | (1,459,714) | | | | Year-end fair value of unvested awards granted in the current year | — | | — | | | 13,194,675 | | 392,446 | | | | Year-over-year difference of year-end fair values for unvested awards granted in prior years | 735,588,807 | | 283,106,420 | | | 113,569,011 | | 41,873,967 | | | | Fair values at vest date for awards granted and vested in current year | — | | — | | | 3,427,088 | | 863,635 | | | | Difference in fair values between prior year-end fair values and vest date fair values for awards granted in prior years | 123,550,450 | | 21,223,401 | | | 23,781,247 | | 3,237,299 | | | | Compensation Actually Paid (as calculated) | 861,753,126 | | 307,430,831 | | | 155,342,721 | | 47,610,252 | | |
No dividends or earnings were paid, and there were no changes in pension values as we do not sponsor any pensions.
|
|
| Non-PEO NEO Average Total Compensation Amount |
$ 2,702,619
|
6,947,158
|
| Non-PEO NEO Average Compensation Actually Paid Amount |
$ 47,610,252
|
155,342,721
|
| Adjustment to Non-PEO NEO Compensation Footnote |
Amounts shown reflect “compensation actually paid” for our Chief Executive Officer and the average compensation actually paid for our non-PEO NEOs. These amounts are calculated in accordance with SEC rules and do not reflect compensation actually earned, realized, or received. As required, the dollar amounts include (among other items) unvested amounts of equity compensation that may be realizable in future periods, and as such, the dollar amounts shown do not represent the actual final amount of compensation earned or actually paid to our Named Executive Officers during the applicable years. The adjustments made to the Summary Compensation Table to determine compensation actually paid (with fair value measured at year-end rather than at grant) are shown in the table below. | | | | | | | | | | | | | | | | | | | | | | PEO | | Average Non-PEO NEOs | | | Year | 12/31/2024 ($) | 12/31/2025 ($) | | 12/31/2024 ($) | 12/31/2025 ($) | | | | | | | | | | Total Compensation from Summary Compensation Table | 2,613,869 | | 3,101,009 | | | 6,947,158 | | 2,702,619 | | | | Adjustments for Equity Awards: | | | | | | | | Adjustment for grant date values in the Summary Compensation Table | — | | — | | | (5,576,457) | | (1,459,714) | | | | Year-end fair value of unvested awards granted in the current year | — | | — | | | 13,194,675 | | 392,446 | | | | Year-over-year difference of year-end fair values for unvested awards granted in prior years | 735,588,807 | | 283,106,420 | | | 113,569,011 | | 41,873,967 | | | | Fair values at vest date for awards granted and vested in current year | — | | — | | | 3,427,088 | | 863,635 | | | | Difference in fair values between prior year-end fair values and vest date fair values for awards granted in prior years | 123,550,450 | | 21,223,401 | | | 23,781,247 | | 3,237,299 | | | | Compensation Actually Paid (as calculated) | 861,753,126 | | 307,430,831 | | | 155,342,721 | | 47,610,252 | | |
No dividends or earnings were paid, and there were no changes in pension values as we do not sponsor any pensions.
|
|
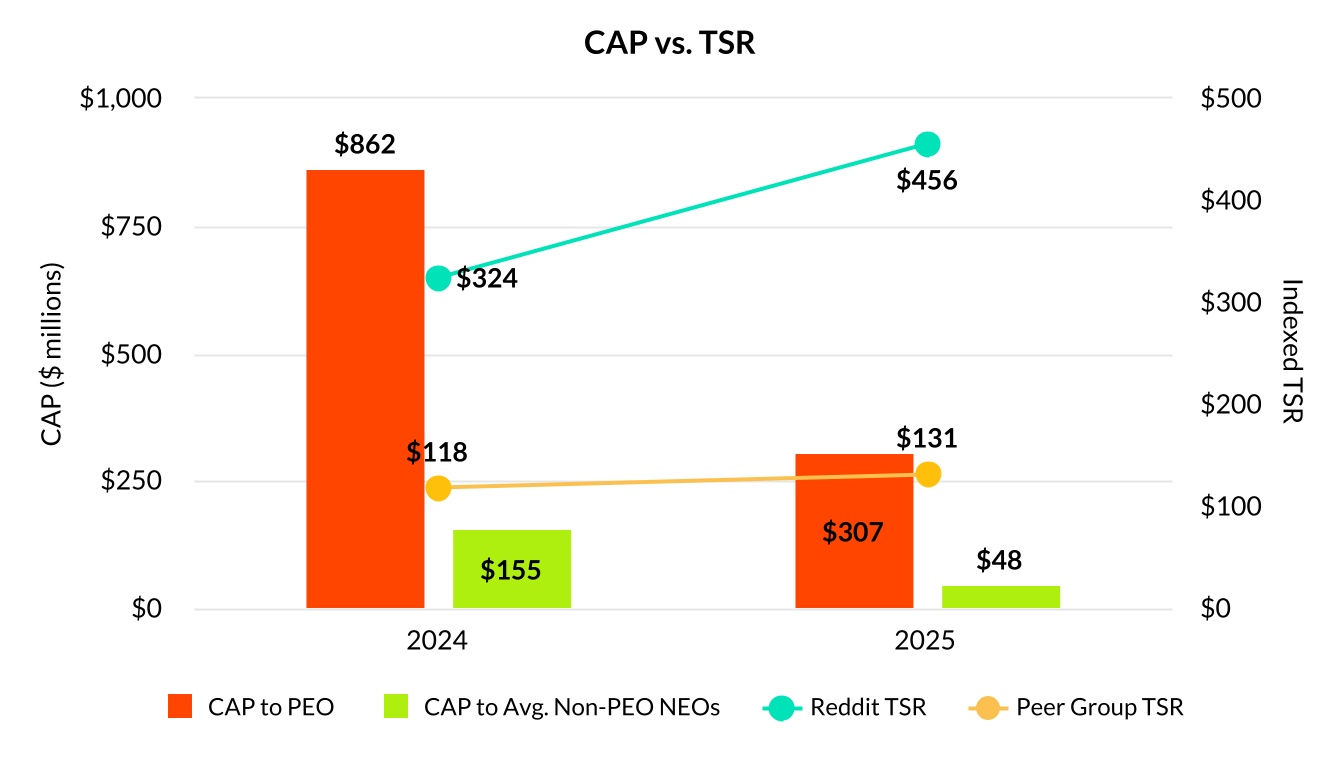
| Compensation Actually Paid vs. Total Shareholder Return |
|
|
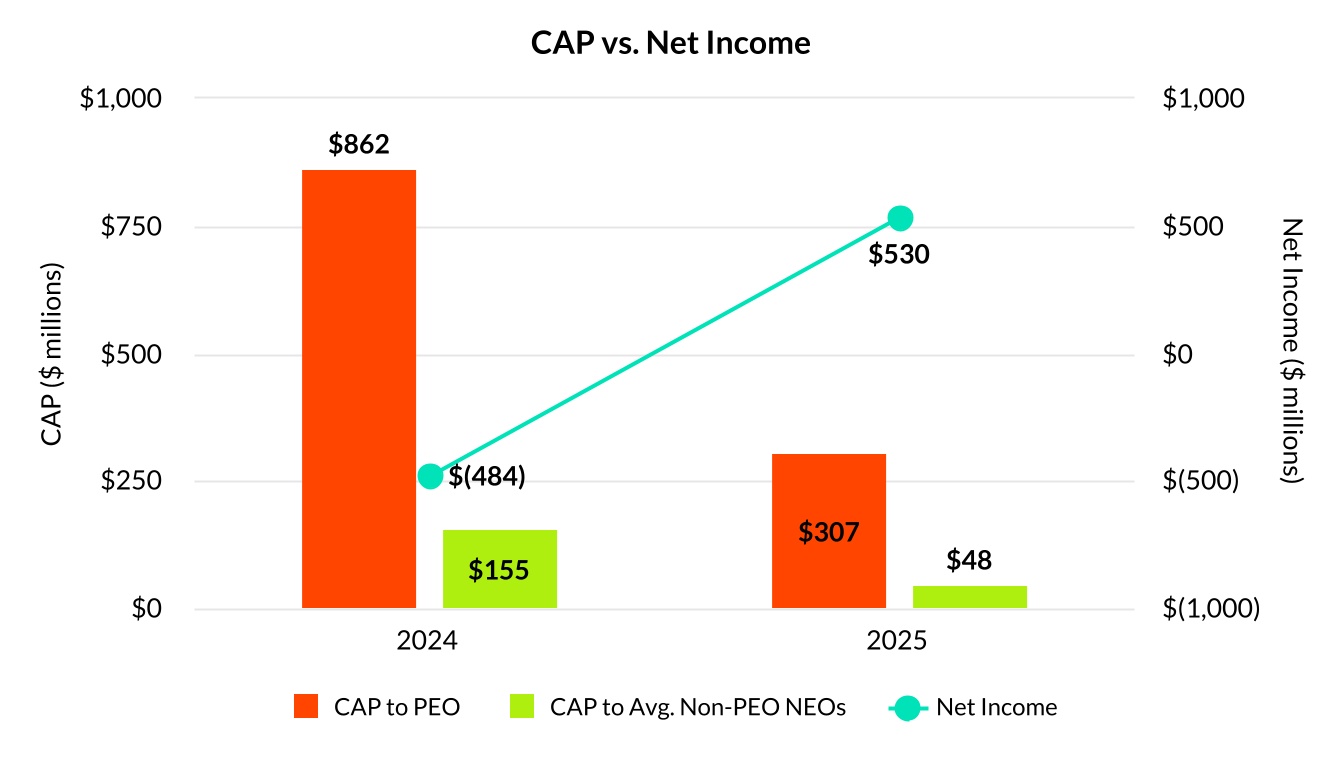
| Compensation Actually Paid vs. Net Income |
|
|
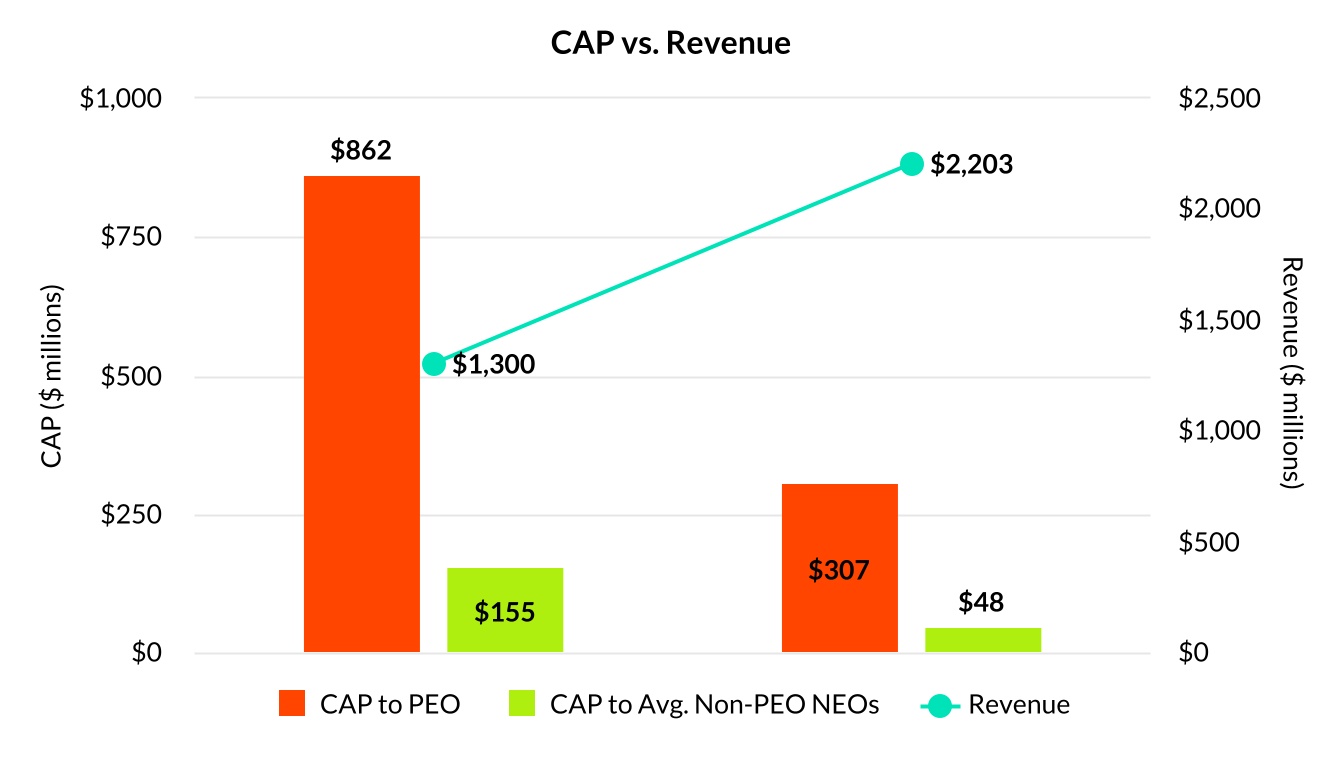
| Compensation Actually Paid vs. Company Selected Measure |
|
|
| Total Shareholder Return Vs Peer Group |
|
|
| Tabular List, Table |
Revenue •DAUq •Adjusted EBITDA
|
|
| Total Shareholder Return Amount |
$ 455.73
|
324.03
|
| Peer Group Total Shareholder Return Amount |
130.94
|
118.17
|
| Net Income (Loss) |
$ 530,000,000
|
$ (484,000,000)
|
| Company Selected Measure Amount |
2,203,000,000
|
1,300,000,000
|
| PEO Name |
Mr. Huffman
|
|
| Additional 402(v) Disclosure |
Stock options are valued as of the applicable measurement date using a Black-Scholes model, with assumptions consistent with those used for grant date fair value under ASC 718.Total Shareholder Return reflects the cumulative total return of an initial $100 investment in our Class A common stock, measured from March 21, 2024 (the date our Class A common stock began trading on the NYSE). Historic stock price performance is not necessarily indicative of future stock price performance. There were no dividends or other earnings paid in the covered fiscal years.Reflects the Net Income reported in our audited financial statements for the applicable fiscal year.Revenue, in our view, represents the most important financial performance measure used to link compensation actually paid to our Chief Executive Officer and non-PEO NEOs to our performance because it is weighted as 40% of our annual cash bonus incentive opportunity funding for both 2024 and 2025, the highest weighted financial measure for such funding.We completed our initial public offering in 2024. Compensation actually paid, as defined by SEC rules, reflects adjustments to the value of equity awards based on factors such as year-end stock price, but does not represent actual payouts. Compensation actually paid generally moves with our stock price. While net income is not part of our compensation program, revenue has historically served as the highest-weighted financial performance measure under our annual bonus incentive opportunity.
|
|
| Measure:: 1 |
|
|
| Pay vs Performance Disclosure |
|
|
| Name |
Revenue
|
|
| Measure:: 2 |
|
|
| Pay vs Performance Disclosure |
|
|
| Name |
DAUq
|
|
| Measure:: 3 |
|
|
| Pay vs Performance Disclosure |
|
|
| Name |
Adjusted EBITDA
|
|
| PEO | Aggregate Grant Date Fair Value of Equity Award Amounts Reported in Summary Compensation Table |
|
|
| Pay vs Performance Disclosure |
|
|
| Adjustment to Compensation, Amount |
$ 0
|
$ 0
|
| PEO | Year-end Fair Value of Equity Awards Granted in Covered Year that are Outstanding and Unvested |
|
|
| Pay vs Performance Disclosure |
|
|
| Adjustment to Compensation, Amount |
0
|
0
|
| PEO | Year-over-Year Change in Fair Value of Equity Awards Granted in Prior Years That are Outstanding and Unvested |
|
|
| Pay vs Performance Disclosure |
|
|
| Adjustment to Compensation, Amount |
283,106,420
|
735,588,807
|
| PEO | Vesting Date Fair Value of Equity Awards Granted and Vested in Covered Year |
|
|
| Pay vs Performance Disclosure |
|
|
| Adjustment to Compensation, Amount |
0
|
0
|
| PEO | Change in Fair Value as of Vesting Date of Prior Year Equity Awards Vested in Covered Year |
|
|
| Pay vs Performance Disclosure |
|
|
| Adjustment to Compensation, Amount |
21,223,401
|
123,550,450
|
| Non-PEO NEO | Aggregate Grant Date Fair Value of Equity Award Amounts Reported in Summary Compensation Table |
|
|
| Pay vs Performance Disclosure |
|
|
| Adjustment to Compensation, Amount |
(1,459,714)
|
(5,576,457)
|
| Non-PEO NEO | Year-end Fair Value of Equity Awards Granted in Covered Year that are Outstanding and Unvested |
|
|
| Pay vs Performance Disclosure |
|
|
| Adjustment to Compensation, Amount |
392,446
|
13,194,675
|
| Non-PEO NEO | Year-over-Year Change in Fair Value of Equity Awards Granted in Prior Years That are Outstanding and Unvested |
|
|
| Pay vs Performance Disclosure |
|
|
| Adjustment to Compensation, Amount |
41,873,967
|
113,569,011
|
| Non-PEO NEO | Vesting Date Fair Value of Equity Awards Granted and Vested in Covered Year |
|
|
| Pay vs Performance Disclosure |
|
|
| Adjustment to Compensation, Amount |
863,635
|
3,427,088
|
| Non-PEO NEO | Change in Fair Value as of Vesting Date of Prior Year Equity Awards Vested in Covered Year |
|
|
| Pay vs Performance Disclosure |
|
|
| Adjustment to Compensation, Amount |
$ 3,237,299
|
$ 23,781,247
|