Pay vs Performance Disclosure - USD ($)
|
12 Months Ended |
Dec. 31, 2025 |
Dec. 31, 2024 |
Dec. 31, 2023 |
| Pay vs Performance Disclosure |
|
|
|
| Pay vs Performance Disclosure, Table |
| | | | | | | | | | | | | | | | | | | | | | | | | | | Value of Initial Fixed $100 Investment based on: | | |
Year | Summary Compensation Table (SCT) Total for PEO(1) |
Compensation Actually Paid to PEO(1) | Average SCT Total for non-PEO NEOs(1) | Average Compensation Actually Paid to non-PEO NEOs(1) |
TSR(4) |
Net Income (in thousands)(5) | | 2025 | $1,417,130 | $1,427,410 | $563,873 | $603,559 | $132 | $15,104 | | 2024 | $1,364,116 | $1,359,582 | $471,459 | $469,830 | $113 | $23,671 | 2023 | $1,283,098 | $1,306,932 | $449,628 | $465,866 | $112 | $25,000 | | | | | | | | | | | | | | |
|
|
|
| Named Executive Officers, Footnote |
Mr. Tomson was our PEO in 2025, 2024, and 2023. In 2025, the non-PEO NEOs were Messrs. McKim, Cosgrove, Fariello, and Kenefick. In 2024, the non-PEO NEOs were Messrs. McKim, Cole, Cosgrove and Fariello, and in 2023 the non-PEO NEOs were Messrs. Krebs, McKim, Cole, Cosgrove and Fariello.
|
|
|
| Peer Group Issuers, Footnote |
Cumulative TSR is calculated using the Corporation's common share price at the end and the beginning of the applicable measurement period assuming reinvestment of dividends based on an initial investment of $100 on December 31, 2022.
|
|
|
| PEO Total Compensation Amount |
$ 1,417,130
|
$ 1,364,116
|
$ 1,283,098
|
| PEO Actually Paid Compensation Amount |
$ 1,427,410
|
1,359,582
|
1,306,932
|
| Adjustment To PEO Compensation, Footnote |
To calculate Compensation Actually Paid for the PEO, the following adjustments were made to Summary Compensation Table total compensation, calculated in accordance with the SEC methodology for determining Compensation Actually Paid for each year shown: | | | | | | | | | | | | | | | | | | | | | | Adjustments to PEO Compensation | | 2025 | | 2024 | | 2023 | | | Summary Compensation Table Total | $1,417,130 | | $1,364,116 | | $1,283,098 | | Minus Restricted Stock Awards from Summary Compensation Table | (230,044) | | | (220,053) | | | (210,038) | | | Plus Year-End Equity Value of Unvested Awards Granted During the Year | 248,143 | | | 223,208 | | | 227,934 | | | Plus Change in Value of Unvested Awards Granted in Prior Years | (7,819) | | | (7,689) | | | 5,938 | | | Plus Value of Awards Granted and Vested During Year | — | | | — | | | — | | | Plus Change in Value of Prior Years' Awards Vested During Year | — | | | — | | | — | | | Minus Value of Performance-Based Awards Forfeited During Year | — | | | — | | | — | | | Plus Dividends and Earning Paid on Awards in the Covered Fiscal Year Prior to Vest | — | | | — | | | — | | | | Compensation Actually Paid | $1,427,410 | | $1,359,582 | | $1,306,932 | |
|
|
|
| Non-PEO NEO Average Total Compensation Amount |
$ 563,873
|
471,459
|
449,628
|
| Non-PEO NEO Average Compensation Actually Paid Amount |
$ 603,559
|
469,830
|
465,866
|
| Adjustment to Non-PEO NEO Compensation Footnote |
To calculate average Compensation Actually Paid for the non-PEO NEOs, the following adjustments were made to Summary Compensation Table total compensation, calculated in accordance with the SEC methodology for determining Compensation Actually Paid for each year shown: | | | | | | | | | | | | | | | | | | | | | | Adjustments to Average non-PEO Compensation | | 2025 | | 2024 | | 2023 | | Average Summary Compensation Table Total | $563,873 | | $471,459 | | $449,628 | | Minus Restricted Stock Awards from Summary Compensation Table | (80,841) | | | — | | | (76,539) | | | Plus Year-End Equity Value of Unvested Awards Granted During the Year | 87,201 | | | — | | | 83,335 | | | Plus Change in Value of Unvested Awards Granted in Prior Years | 24,535 | | | (2,998) | | | 6,616 | | | Plus Value of Awards Granted and Vested During Year | — | | | — | | | — | | | Plus Change in Value of Prior Years' Awards Vested During Year | 8,791 | | | 1,369 | | | 2,826 | | | Minus Value of Performance-Based Awards Forfeited During Year | — | | | — | | | — | | | Plus Dividends and Earning Paid on Awards in the Covered Fiscal Year Prior to Vest | — | | | — | | | — | | | Average Compensation Actually Paid | $603,559 | | $469,830 | | $465,866 | |
|
|
|
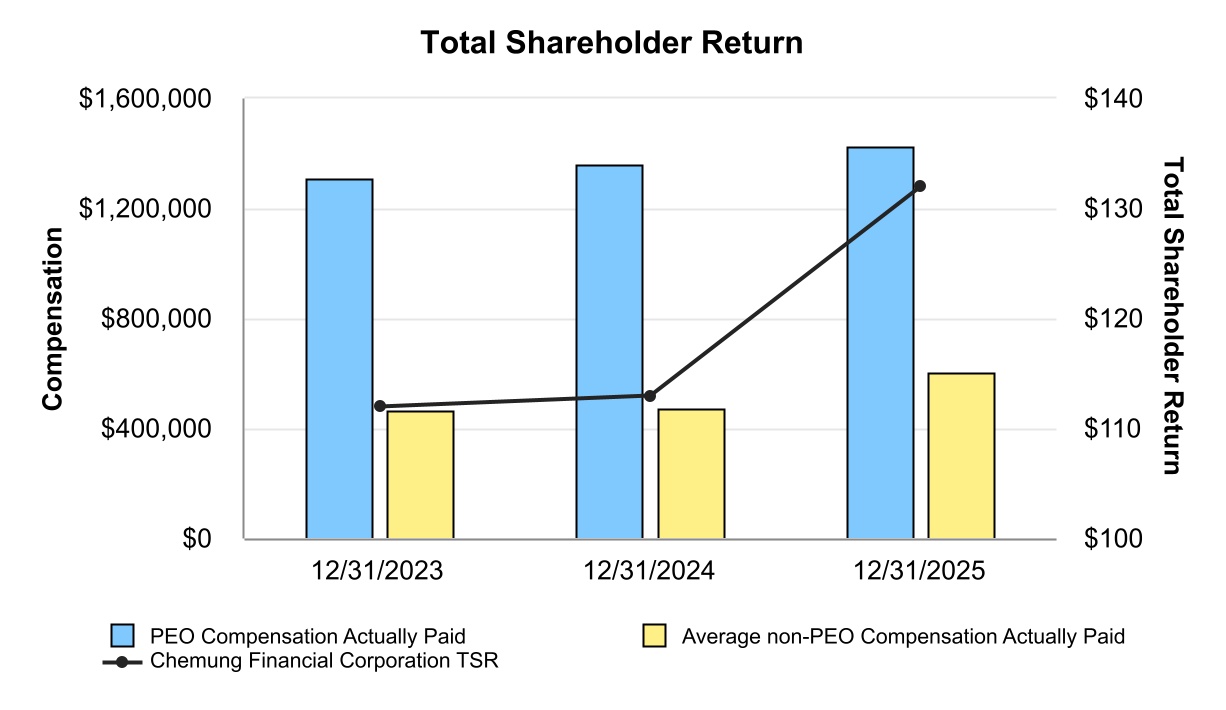
| Compensation Actually Paid vs. Total Shareholder Return |
|
|
|
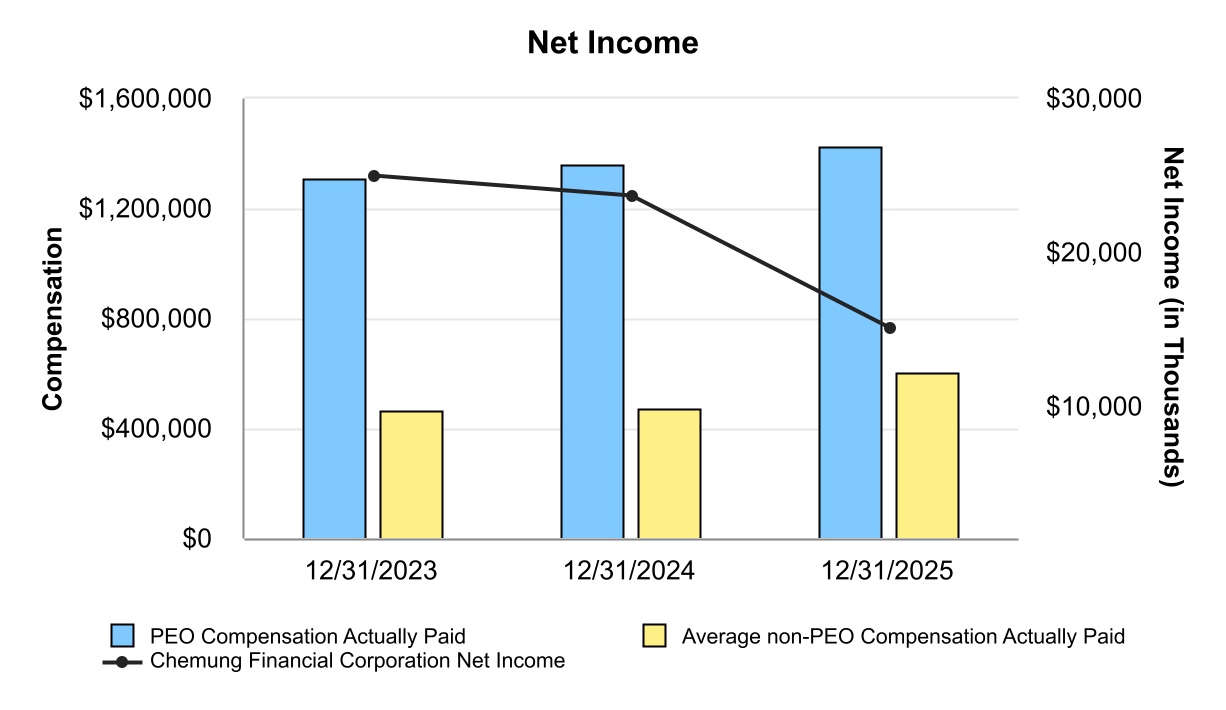
| Compensation Actually Paid vs. Net Income |
The following charts illustrate the relationship between Compensation Actually Paid to the PEO and the average Compensation Actually Paid to the non-PEO NEOs for 2023, 2024, and 2025, and each of the financial metrics stated therein.
|
|
|
| Total Shareholder Return Amount |
$ 132
|
113
|
112
|
| Net Income (Loss) |
$ 15,104,000
|
23,671,000
|
25,000,000
|
| PEO Name |
(1)Mr. Tomson
|
|
|
| Additional 402(v) Disclosure |
Net income as reported on the Corporation's consolidated financial statements.
|
|
|
| PEO | Aggregate Grant Date Fair Value of Equity Award Amounts Reported in Summary Compensation Table |
|
|
|
| Pay vs Performance Disclosure |
|
|
|
| Adjustment to Compensation, Amount |
$ (230,044)
|
(220,053)
|
(210,038)
|
| PEO | Year-end Fair Value of Equity Awards Granted in Covered Year that are Outstanding and Unvested |
|
|
|
| Pay vs Performance Disclosure |
|
|
|
| Adjustment to Compensation, Amount |
248,143
|
223,208
|
227,934
|
| PEO | Year-over-Year Change in Fair Value of Equity Awards Granted in Prior Years That are Outstanding and Unvested |
|
|
|
| Pay vs Performance Disclosure |
|
|
|
| Adjustment to Compensation, Amount |
(7,819)
|
(7,689)
|
5,938
|
| PEO | Vesting Date Fair Value of Equity Awards Granted and Vested in Covered Year |
|
|
|
| Pay vs Performance Disclosure |
|
|
|
| Adjustment to Compensation, Amount |
0
|
0
|
0
|
| PEO | Change in Fair Value as of Vesting Date of Prior Year Equity Awards Vested in Covered Year |
|
|
|
| Pay vs Performance Disclosure |
|
|
|
| Adjustment to Compensation, Amount |
0
|
0
|
0
|
| PEO | Prior Year End Fair Value of Equity Awards Granted in Any Prior Year that Fail to Meet Applicable Vesting Conditions During Covered Year |
|
|
|
| Pay vs Performance Disclosure |
|
|
|
| Adjustment to Compensation, Amount |
0
|
0
|
0
|
| PEO | Dividends or Other Earnings Paid on Equity Awards not Otherwise Reflected in Total Compensation for Covered Year |
|
|
|
| Pay vs Performance Disclosure |
|
|
|
| Adjustment to Compensation, Amount |
0
|
0
|
0
|
| Non-PEO NEO | Aggregate Grant Date Fair Value of Equity Award Amounts Reported in Summary Compensation Table |
|
|
|
| Pay vs Performance Disclosure |
|
|
|
| Adjustment to Compensation, Amount |
(80,841)
|
0
|
(76,539)
|
| Non-PEO NEO | Year-end Fair Value of Equity Awards Granted in Covered Year that are Outstanding and Unvested |
|
|
|
| Pay vs Performance Disclosure |
|
|
|
| Adjustment to Compensation, Amount |
87,201
|
0
|
83,335
|
| Non-PEO NEO | Year-over-Year Change in Fair Value of Equity Awards Granted in Prior Years That are Outstanding and Unvested |
|
|
|
| Pay vs Performance Disclosure |
|
|
|
| Adjustment to Compensation, Amount |
24,535
|
(2,998)
|
6,616
|
| Non-PEO NEO | Vesting Date Fair Value of Equity Awards Granted and Vested in Covered Year |
|
|
|
| Pay vs Performance Disclosure |
|
|
|
| Adjustment to Compensation, Amount |
0
|
0
|
0
|
| Non-PEO NEO | Change in Fair Value as of Vesting Date of Prior Year Equity Awards Vested in Covered Year |
|
|
|
| Pay vs Performance Disclosure |
|
|
|
| Adjustment to Compensation, Amount |
8,791
|
1,369
|
2,826
|
| Non-PEO NEO | Prior Year End Fair Value of Equity Awards Granted in Any Prior Year that Fail to Meet Applicable Vesting Conditions During Covered Year |
|
|
|
| Pay vs Performance Disclosure |
|
|
|
| Adjustment to Compensation, Amount |
0
|
0
|
0
|
| Non-PEO NEO | Dividends or Other Earnings Paid on Equity Awards not Otherwise Reflected in Total Compensation for Covered Year |
|
|
|
| Pay vs Performance Disclosure |
|
|
|
| Adjustment to Compensation, Amount |
$ 0
|
$ 0
|
$ 0
|