As required by Section 953(a) of the Dodd-Frank Wall Street Reform and Consumer Protection Act, and Item 402(v) of SEC Regulation S-K, we are providing the following information about the relationship between executive compensation actually paid and certain financial performance of the Company. For further information concerning the Company’s compensation philosophy and objectives and how the Company aligns executive compensation with the Company’s performance, see the section titled “COMPENSATION OF EXECUTIVE OFFICERS” beginning on page 16 of this Proxy Statement.
Pay Versus Performance Table for 2025
|
|
|
|
|
|
|
|
|
|
|
|
|
|
|
|
|
|
Value of Initial Fixed $100 Investment Based On: |
|
|
|
|
||||||
Year |
|
Summary Compensation Table Total for PEO1 |
|
|
Compensation Actually Paid to PEO2. |
|
|
Average Summary Compensation Table Total for Non-PEO NEOs3 |
|
|
Average Compensation Actually Paid to Non-PEO NEOs4 |
|
|
Total Shareholder Return5 |
|
|
Net Income (millions)6 |
|||||||||||
(a) |
|
|
(b) |
|
|
|
(c) |
|
|
|
(d) |
|
|
|
(e) |
|
|
|
(f) |
|
|
|
(g) |
|||||
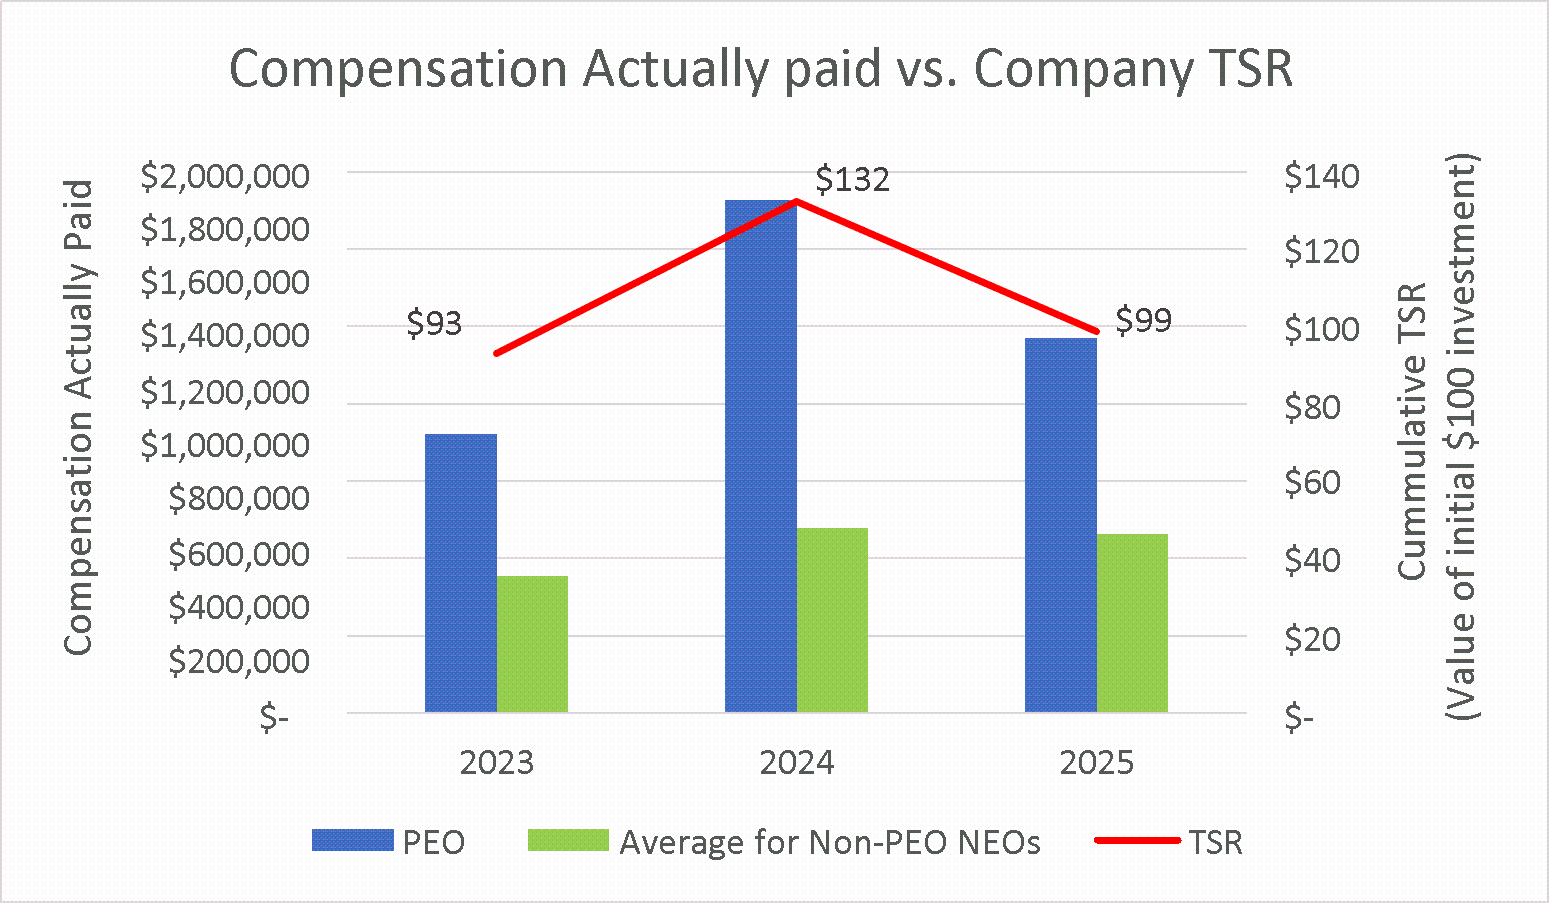
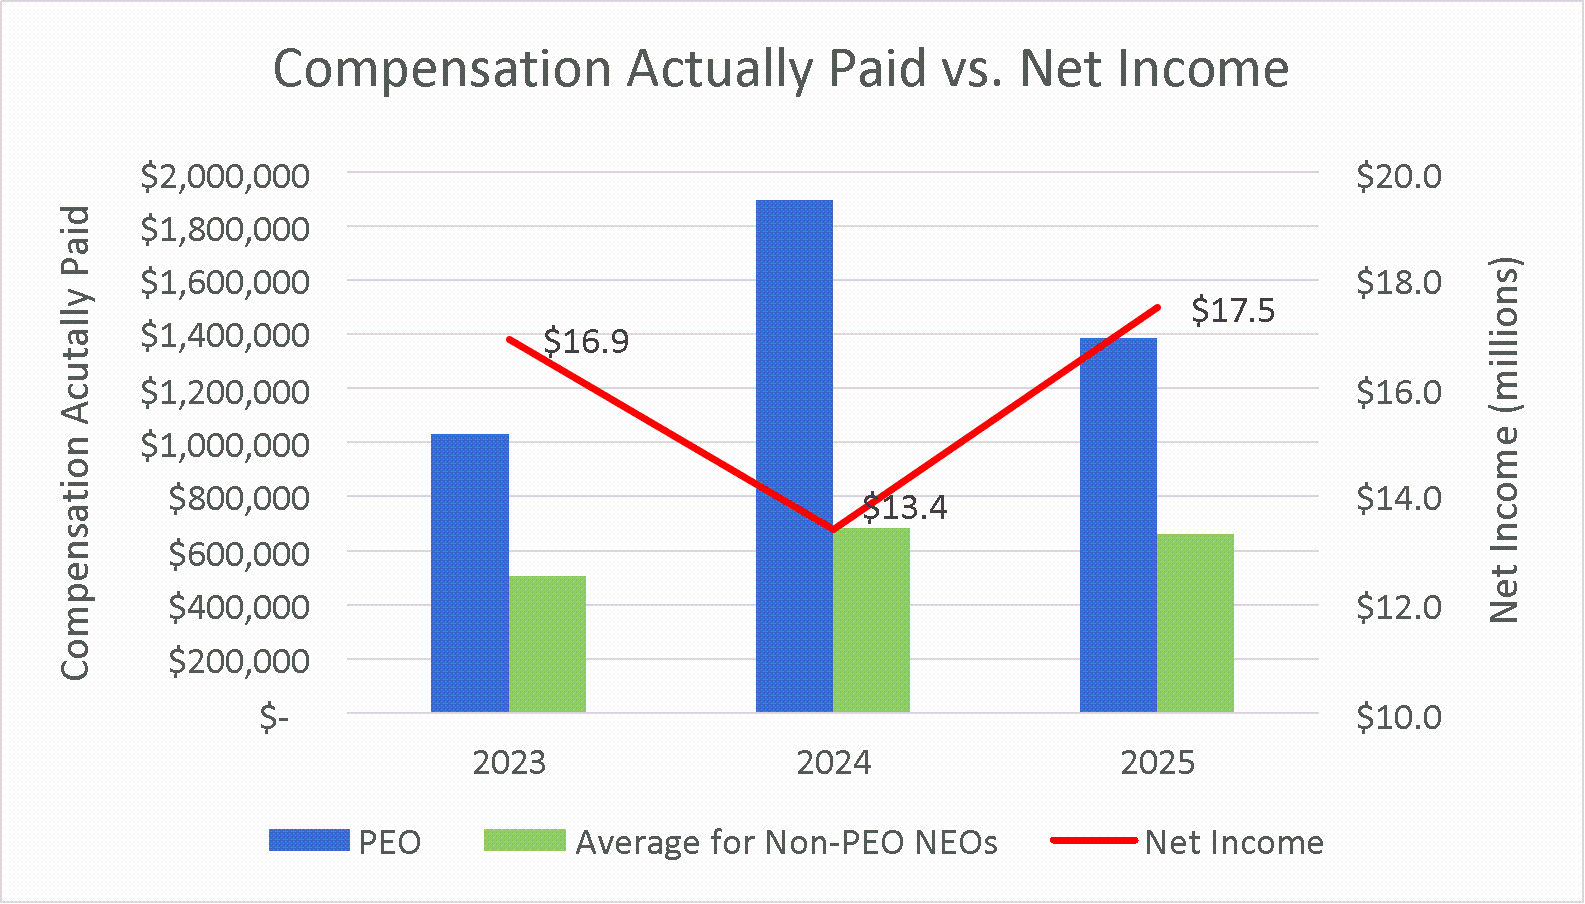
2025 |
|
$ |
|
1,392,313 |
|
|
$ |
|
1,384,904 |
|
|
$ |
|
728,260 |
|
|
$ |
|
663,150 |
|
|
$ |
|
99 |
|
|
$ |
17.5 |
2024 |
|
$ |
|
1,593,188 |
|
|
$ |
|
1,894,422 |
|
|
$ |
|
612,931 |
|
|
$ |
|
681,719 |
|
|
$ |
|
132 |
|
|
$ |
13.4 |
2023 |
|
$ |
|
1,080,496 |
|
|
$ |
|
1,032,034 |
|
|
$ |
|
512,266 |
|
|
$ |
|
506,087 |
|
|
$ |
|
93 |
|
|
$ |
16.9 |
1 The dollar amounts reported in column (b) are the amounts of total compensation reported for Mr. O’Dell (our Chief Executive Officer and President) for each corresponding year in the “Total” column of the Summary Compensation Table. See “Compensation OF EXECUTIVE OFFICERS – 2025 Compensation – Summary Compensation Table” on page 18 of this Proxy Statement (and on page 17 of the 2025 Proxy Statement with respect to total compensation for 2023).
2 The dollar amounts reported in column (c) represent the amount of “compensation actually paid” to Mr. O’Dell, as computed in accordance with Item 402(v) of Regulation S-K. The dollar amounts do not reflect the actual amounts of compensation earned by or paid to Mr. O’Dell during the applicable years. In accordance with the requirements of Item 402(v) of Regulation S-K, the following adjustments were made to Mr. O’Dell’s total compensation for each year to determine the compensation actually paid:
Year |
|
Reported |
|
|
Reported |
|
|
Equity |
|
|
Reported |
|
|
Pension Benefit |
|
|
Compensation Actually Paid to PEO |
|
||||||||||||
2025 |
|
$ |
|
1,392,313 |
|
|
$ |
|
(387,450 |
) |
|
$ |
|
380,041 |
|
|
$ |
|
- |
|
|
$ |
|
- |
|
|
$ |
|
1,384,904 |
|
2024 |
|
$ |
|
1,593,188 |
|
|
$ |
|
(624,650 |
) |
|
$ |
|
925,884 |
|
|
$ |
|
- |
|
|
$ |
|
- |
|
|
$ |
|
1,894,422 |
|
2023 |
|
$ |
|
1,080,496 |
|
|
$ |
|
(356,249 |
) |
|
$ |
|
307,787 |
|
|
$ |
|
- |
|
|
$ |
|
- |
|
|
$ |
|
1,032,034 |
|
Year |
|
(i) |
|
|
(ii) |
|
|
(iii) |
|
|
(iv) |
|
|
(v) |
|
|
(vi) |
|
|
Total |
|
||||||||||||||
2025 |
|
$ |
|
436,625 |
|
|
$ |
|
(16,267 |
) |
|
$ |
|
- |
|
|
$ |
|
(54,946 |
) |
|
$ |
|
- |
|
|
$ |
|
14,629 |
|
|
$ |
|
380,041 |
|
2024 |
|
$ |
|
830,050 |
|
|
$ |
|
65,865 |
|
|
$ |
|
- |
|
|
$ |
|
19,291 |
|
|
$ |
|
- |
|
|
$ |
|
10,678 |
|
|
$ |
|
925,884 |
|
2023 |
|
$ |
|
345,443 |
|
|
$ |
|
(18,480 |
) |
|
$ |
|
- |
|
|
$ |
|
(27,180 |
) |
|
$ |
|
- |
|
|
$ |
|
8,004 |
|
|
$ |
|
307,787 |
|
3 The dollar amounts reported in column (d) represent the average of the amounts reported for the Company’s named executive officers (NEOs) as a group (excluding Mr. O’Dell) in the “Total” column of the Summary Compensation Table in each applicable year. The names of each of the NEOs (excluding Mr. O’Dell) included for purposes of calculating the average amounts in each applicable year are Bradley J. Ringwald (President of CFBank) and Kevin J. Beerman (Executive Vice President and Chief Financial Officer).
4 The dollar amounts reported in column (e) represent the average amount of “compensation actually paid” to the NEOs as a group (excluding Mr. O’Dell), as computed in accordance with Item 402(v) of Regulation S-K. The dollar amounts do not reflect the actual average amounts of compensation earned by or paid to the NEOs as a group (excluding Mr. O’Dell) during the applicable years. In accordance with the requirements of Item 402(v) of Regulation S-K, the following adjustments were made to average total compensation for the NEOs as a group (excluding Mr. O’Dell) for each year to determine the compensation actually paid, using the same methodology described above in Note 2:
Year |
|
Average |
|
|
Average |
|
|
Average Equity |
|
|
Average |
|
|
Average Pension Benefit |
|
|
Average Compensation Actually Paid to Non-PEO NEOs |
|
||||||||||||
2025 |
|
$ |
|
728,260 |
|
|
$ |
|
(290,035 |
) |
|
$ |
|
224,925 |
|
|
$ |
|
- |
|
|
$ |
|
- |
|
|
$ |
|
663,150 |
|
2024 |
|
$ |
|
612,931 |
|
|
$ |
|
(199,260 |
) |
|
$ |
|
268,048 |
|
|
$ |
|
- |
|
|
$ |
|
- |
|
|
$ |
|
681,719 |
|
2023 |
|
$ |
|
512,266 |
|
|
$ |
|
(102,630 |
) |
|
$ |
|
96,451 |
|
|
$ |
|
- |
|
|
$ |
|
- |
|
|
$ |
|
506,087 |
|
Year |
|
Average |
|
|
Year over Year Average Change in Fair Value of Outstanding and Unvested EquityYear over Year Average Change in Fair Value of Outstanding and Unvested Equity Awards |
|
|
Average Fair Value as of Vesting Date of Equity Awards Granted and Vested in the Year |
|
|
Year over Year Average Change in Fair Value of Equity Awards Granted in Prior Years that Vested in Year over Year Average Change in Fair Value of Equity Awards Granted in Prior Years that Vested in the Year |
|
|
Average Fair Value at the End of the Prior Year of Equity Awards that Failed to Meet Vesting Conditions in the Year |
|
|
Average Value of Dividends or other Earnings Paid on Stock or Option Awards not Otherwise Reflected in Fair Value or Total Compensation |
|
|
Total |
|
||||||||||||||
2025 |
|
$ |
|
237,025 |
|
|
$ |
|
(3,097 |
) |
|
$ |
|
- |
|
|
$ |
|
(13,406 |
) |
|
$ |
|
- |
|
|
$ |
|
4,403 |
|
|
$ |
|
224,925 |
|
2024 |
|
$ |
|
229,860 |
|
|
$ |
|
27,675 |
|
|
$ |
|
- |
|
|
$ |
|
8,322 |
|
|
$ |
|
- |
|
|
$ |
|
2,191 |
|
|
$ |
|
268,048 |
|
2023 |
|
$ |
|
102,630 |
|
|
$ |
|
(6,439 |
) |
|
$ |
|
- |
|
|
$ |
|
(1,733 |
) |
|
$ |
|
- |
|
|
$ |
|
1,992 |
|
|
$ |
|
96,451 |
|
5 Cumulative TSR is calculated by dividing the sum of the cumulative amount of dividends for the measurement period, assuming dividend reinvestment, and the difference between the Company’s share price at the end and the beginning of the measurement period by the Company’s share price at the beginning of the measurement period.
6 The dollar amounts reported represent the amount of net income reflected in the Company’s audited financial statements for the applicable year.