Pay vs Performance Disclosure - USD ($)
|
5 Months Ended |
7 Months Ended |
12 Months Ended |
Dec. 31, 2025 |
Aug. 15, 2025 |
Dec. 31, 2025 |
Dec. 31, 2024 |
Dec. 31, 2023 |
Dec. 31, 2022 |
Dec. 31, 2021 |
| Pay vs Performance Disclosure [Table] |
|
|
|
|
|
|
|
| Pay vs Performance Disclosure, Table |
|
|
Pay Versus Performance
Pursuant to the amendments to Section 14(i) of
the Exchange Act, Section 953(b) of the Dodd-Frank Wall Street Reform and Consumer Protection Act and Item 402(v) of Regulation
S-K, this section provides information regarding the relationship of compensation paid to our Named Executive Officers (“NEOs”)
relative to our financial performance.
The following table summarizes compensation values
reported in the Summary Compensation Table for our principal executive officer (“PEO”) and the average for our other
NEOs, as compared to “compensation actually paid” or “CAP” and the Company’s financial performance
for the years ended December 31, 2025, 2024, 2023, 2022, and 2021:
| Year | |
Summary
Compensation
Table Total for
PEO(1) | | |
Summary
Compensation
Table Total for
PEO(1) | | |
Compensation
Actually Paid to
PEO(1)(2) | | |
Compensation
Actually
Paid to PEO | | |
Average
Summary
Compensation
Table
Total
for Non-PEO
NEOs(1) | | |
Average
Compensation
Actually
Paid
to Non-PEO
NEOs(1)(2) | | |
Value of Initial Fixed $100
Investment Based On: | | |
Net
Income
($MM)(4) | | |
Total Net
Debt
($MM)(5) | |
| |
| |
| |
| |
| |
| |
| |
TSR | | |
2024
Peer
Group
TSR(3) | | |
2025
Peer
Group
TSR(3)
| | |
| |
|
| (a) | |
| (b-1) | | |
| (b-2) | | |
| (c-1) | | |
| (c-2) | | |
| (d) | | |
| (e) | | |
| (f) | | |
| (g-1) | | |
| (g-2) | | |
| (h) | | |
| (i) | |
| 2025 | |
$ | 12,231,359 | | |
$ | 6,687,656 | | |
$ | 12,771,849 | | |
$ | 6,925,302 | | |
$ | 3,817,023 | | |
$ | 4,026,716 | | |
$ | 632 | | |
$ | 342 | | |
$ | 311 | | |
$ | 675 | | |
$ | 1,188 | |
| 2024 | |
$ | 14,160,181 | | |
| | | |
$ | 40,471,186 | | |
| | | |
$ | 4,940,119 | | |
$ | 12,567,940 | | |
$ | 643 | | |
$ | 326 | | |
$ | 307 | | |
$ | 94 | | |
$ | 1,489 | |
| 2023 | |
$ | 13,512,463 | | |
| | | |
$ | (6,495,757 | ) | |
| | | |
$ | 4,879,345 | | |
$ | 1,133,652 | | |
$ | 416 | | |
$ | 319 | | |
$ | 324 | | |
$ | 297 | | |
$ | 1,538 | |
| 2022 | |
$ | 24,641,821 | | |
| | | |
$ | 65,573,452 | | |
| | | |
$ | 7,538,143 | | |
$ | 14,955,404 | | |
$ | 569 | | |
$ | 321 | | |
$ | 315 | | |
$ | 1,999 | | |
$ | 1,183 | |
| 2021 | |
$ | 6,456,142 | | |
| | | |
$ | 34,006,228 | | |
| | | |
$ | 1,966,171 | | |
$ | 12,904,483 | | |
$ | 321 | | |
$ | 213 | | |
$ | 209 | | |
$ | (162 | ) | |
$ | 2,125 | |
|
|
|
|
|
| Company Selected Measure Name |
|
|
Total Net Debt
|
|
|
|
|
| Named Executive Officers, Footnote |
|
|
| (1) |
The PEO reflected in columns (b-1) and (c-1) represents Paul M. Rady who served as our PEO through August 15, 2025 and the PEO reflected in columns (b-2) and (c-2) represents Michael N. Kennedy who has served as our PEO since August 15, 2025. The non-PEO NEOs reflected in columns (d) and (e) represent the following individuals by year: |
| |
a. |
2025: Yvette K. Schultz and Brendan E. Krueger. |
| |
b. |
2024: Michael N. Kennedy and Yvette K. Schultz. |
| |
c. |
2023: Michael N. Kennedy and Yvette K. Schultz. |
| |
d. |
2022: Michael N. Kennedy, W. Patrick Ash and Yvette K. Schultz. |
| |
e. |
2021: Alvyn A. Schopp, Michael N. Kennedy, W. Patrick Ash and Glen C. Warren, Jr. |
|
|
|
|
|
| Peer Group Issuers, Footnote |
|
|
a
| (3) |
The peer group disclosed is the group of companies whose executive compensation we consider when
determining our NEO’s compensation as described in “Compensation Discussion and Analysis—Implementing Our
Compensation Program Objectives—Competitive Peer Analysis”. For 2025, the peer group was comprised of APA Corp.,
Civitas Resources, Inc., Coterra Energy Inc., Devon Energy Corporation, Diamondback Energy Inc., EQT Corporation, Expand Energy
Corporation, Murphy Oil Corporation, Ovintiv Inc., and Range Resources Corporation. The 2025 peer group removed Marathon Oil
Corporation, and Southwestern Energy Company and added Civitas Resources, Inc., Expand Energy Corporation, and Murphy Oil
Corporation when compared to the 2024 peer group to reflect shifts in the market, including as a result of merger activity,
and maintain a comparable peer group. The value of the initial $100 fixed investment of the 2024 peer group’s TSR for
the 2025 year is included in column (g-1). |
|
|
|
|
|
| PEO Total Compensation Amount |
|
|
|
$ 14,160,181
|
$ 13,512,463
|
$ 24,641,821
|
$ 6,456,142
|
| PEO Actually Paid Compensation Amount |
|
|
|
40,471,186
|
(6,495,757)
|
65,573,452
|
34,006,228
|
| Adjustment To PEO Compensation, Footnote |
|
|
| (2) |
The Company deducted from and added to the Summary Compensation Table
total compensation the following amounts to calculate compensation actually paid in accordance with Item 402(v) of Regulation
S-K as disclosed in columns (c) and (e) for each PEO and Non-PEO NEOs in 2025. As the Company’s NEOs do not participate
in any defined benefit plans, no adjustments were required to amounts reported in the Summary Compensation Table totals
related to the value of benefits under such plans.
|
| |
| |
2025 | |
| |
| |
| Paul Rady | | |
| Michael
Kennedy | | |
| Average
Non-CEO
NEOs | |
| |
Total Compensation from Summary Compensation Table | |
| $12,231,359 | | |
| $6,687,656 | | |
| $3,817,023 | |
| |
Adjustments for Equity Awards | |
| | | |
| | | |
| | |
| |
Grant date values in the Summary Compensation Table | |
| $(10,059,907 | ) | |
| $(4,325,734 | ) | |
| $(2,640,712 | ) |
| |
Year-end fair value of unvested awards granted in the current year | |
| $12,873,692 | | |
| $5,535,645 | | |
| $3,379,327 | |
| |
Year-over-year difference of year-end fair values for unvested awards granted in prior years | |
| $(2,296,451 | ) | |
| $(978,357 | ) | |
| $(542,592 | ) |
| |
Fair values at vest date for awards granted and vested in current year | |
| $ — | | |
| $ — | | |
| $ — | |
| |
Difference in fair values between prior year-end fair values and vest date fair values for awards granted in prior years | |
| $23,156 | | |
| $6,092 | | |
| $13,670 | |
| |
Forfeitures during current year equal to prior year-end fair value | |
| $ — | | |
| $ — | | |
| $ — | |
| |
Dividends or dividend equivalents not otherwise included in the total compensation | |
| $ — | | |
| $ — | | |
| $ — | |
| |
Total Adjustments for Equity Awards | |
| $540,490 | | |
| $237,646 | | |
| $209,693 | |
| |
Compensation Actually Paid (as calculated) | |
| $12,771,849 | | |
| $6,925,302 | | |
| $4,026,716 | |
|
|
|
|
|
| Non-PEO NEO Average Total Compensation Amount |
|
|
$ 3,817,023
|
4,940,119
|
4,879,345
|
7,538,143
|
1,966,171
|
| Non-PEO NEO Average Compensation Actually Paid Amount |
|
|
$ 4,026,716
|
12,567,940
|
1,133,652
|
14,955,404
|
12,904,483
|
| Adjustment to Non-PEO NEO Compensation Footnote |
|
|
| (2) |
The Company deducted from and added to the Summary Compensation Table
total compensation the following amounts to calculate compensation actually paid in accordance with Item 402(v) of Regulation
S-K as disclosed in columns (c) and (e) for each PEO and Non-PEO NEOs in 2025. As the Company’s NEOs do not participate
in any defined benefit plans, no adjustments were required to amounts reported in the Summary Compensation Table totals
related to the value of benefits under such plans.
|
| |
| |
2025 | |
| |
| |
| Paul Rady | | |
| Michael
Kennedy | | |
| Average
Non-CEO
NEOs | |
| |
Total Compensation from Summary Compensation Table | |
| $12,231,359 | | |
| $6,687,656 | | |
| $3,817,023 | |
| |
Adjustments for Equity Awards | |
| | | |
| | | |
| | |
| |
Grant date values in the Summary Compensation Table | |
| $(10,059,907 | ) | |
| $(4,325,734 | ) | |
| $(2,640,712 | ) |
| |
Year-end fair value of unvested awards granted in the current year | |
| $12,873,692 | | |
| $5,535,645 | | |
| $3,379,327 | |
| |
Year-over-year difference of year-end fair values for unvested awards granted in prior years | |
| $(2,296,451 | ) | |
| $(978,357 | ) | |
| $(542,592 | ) |
| |
Fair values at vest date for awards granted and vested in current year | |
| $ — | | |
| $ — | | |
| $ — | |
| |
Difference in fair values between prior year-end fair values and vest date fair values for awards granted in prior years | |
| $23,156 | | |
| $6,092 | | |
| $13,670 | |
| |
Forfeitures during current year equal to prior year-end fair value | |
| $ — | | |
| $ — | | |
| $ — | |
| |
Dividends or dividend equivalents not otherwise included in the total compensation | |
| $ — | | |
| $ — | | |
| $ — | |
| |
Total Adjustments for Equity Awards | |
| $540,490 | | |
| $237,646 | | |
| $209,693 | |
| |
Compensation Actually Paid (as calculated) | |
| $12,771,849 | | |
| $6,925,302 | | |
| $4,026,716 | |
|
|
|
|
|
| Compensation Actually Paid vs. Total Shareholder Return |
|
|
CAP and Cumulative TSR/Cumulative Peer Group
TSR
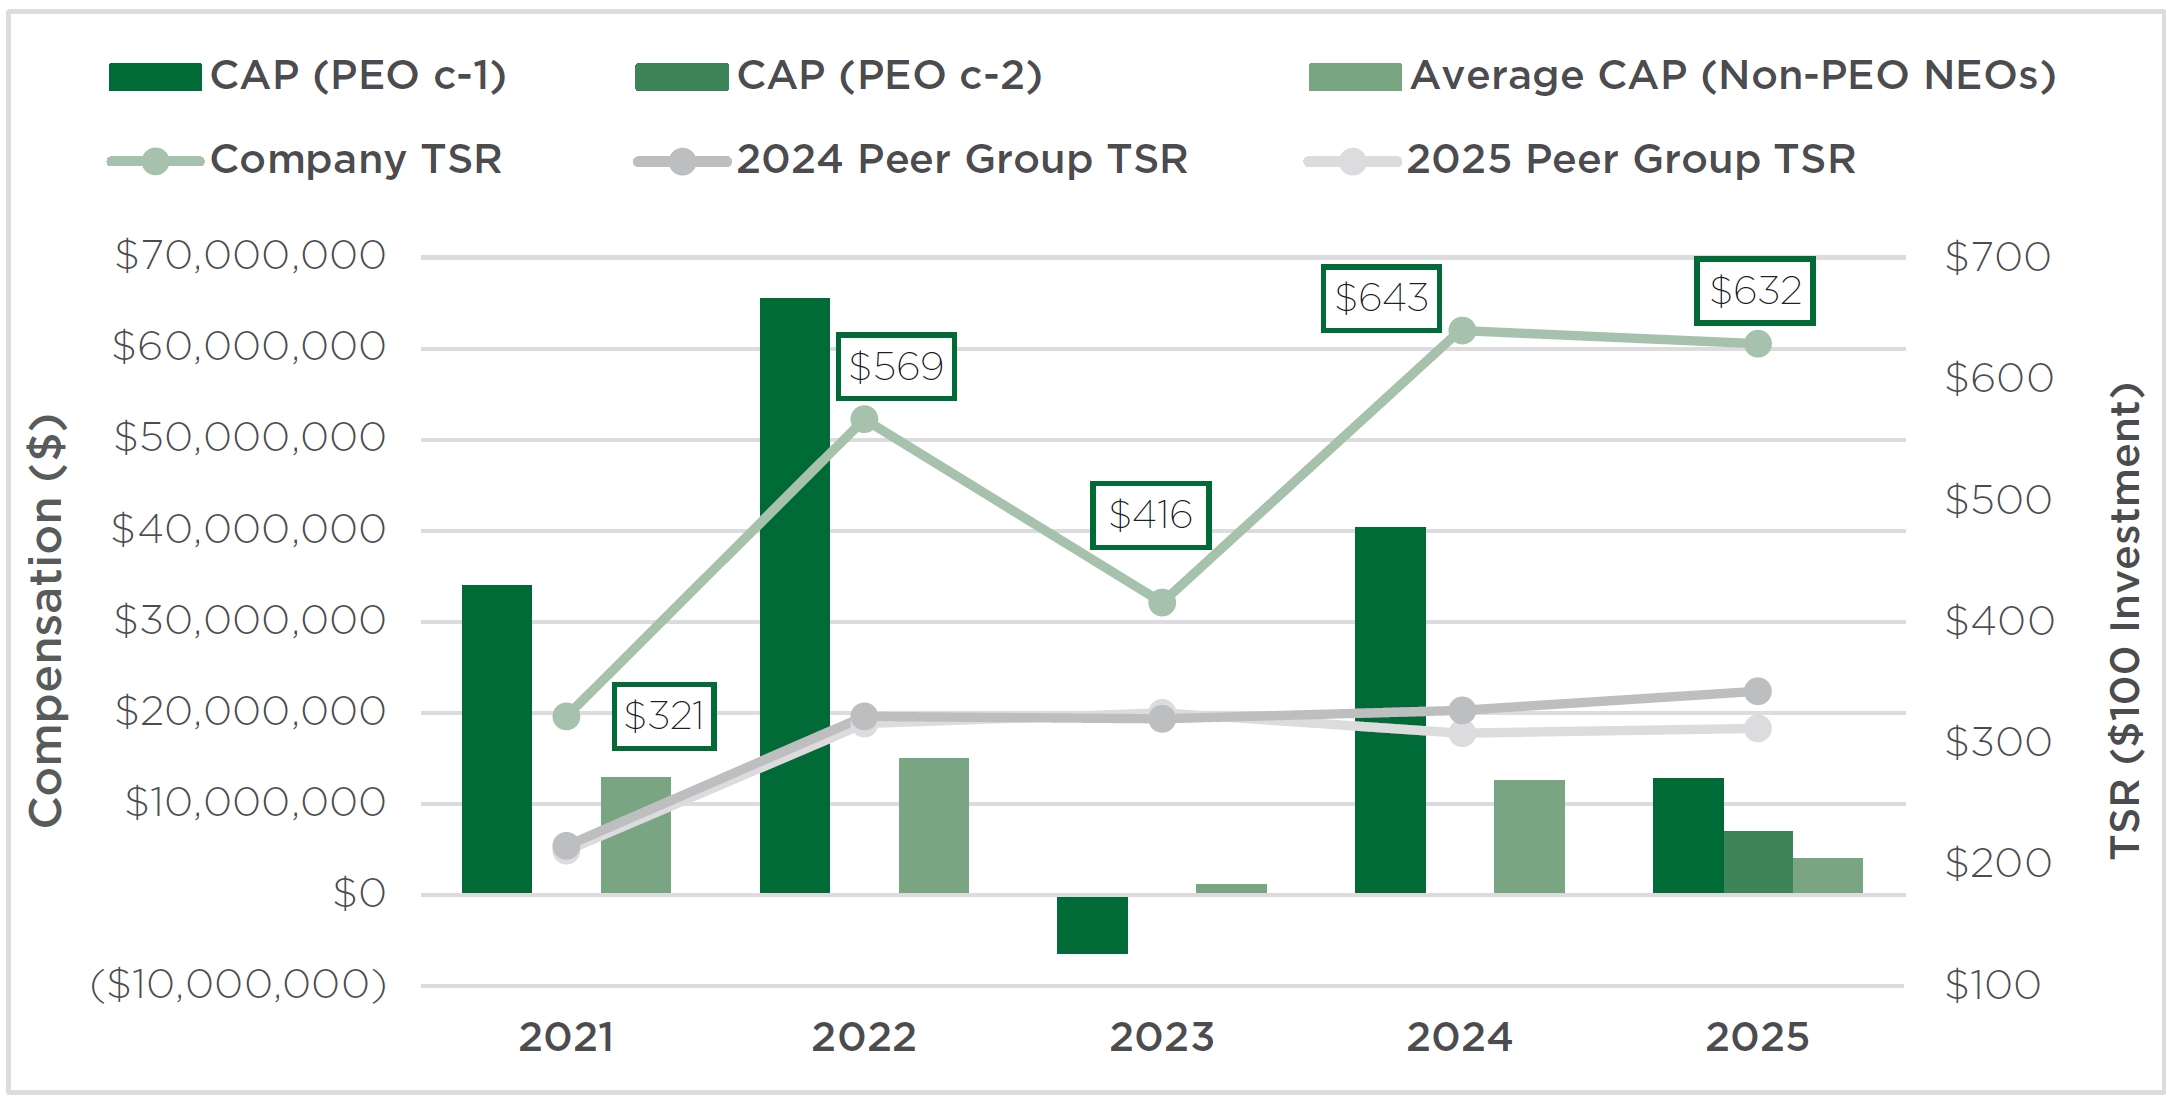
|
|
|
|
|
| Compensation Actually Paid vs. Net Income |
|
|
CAP and Net Income
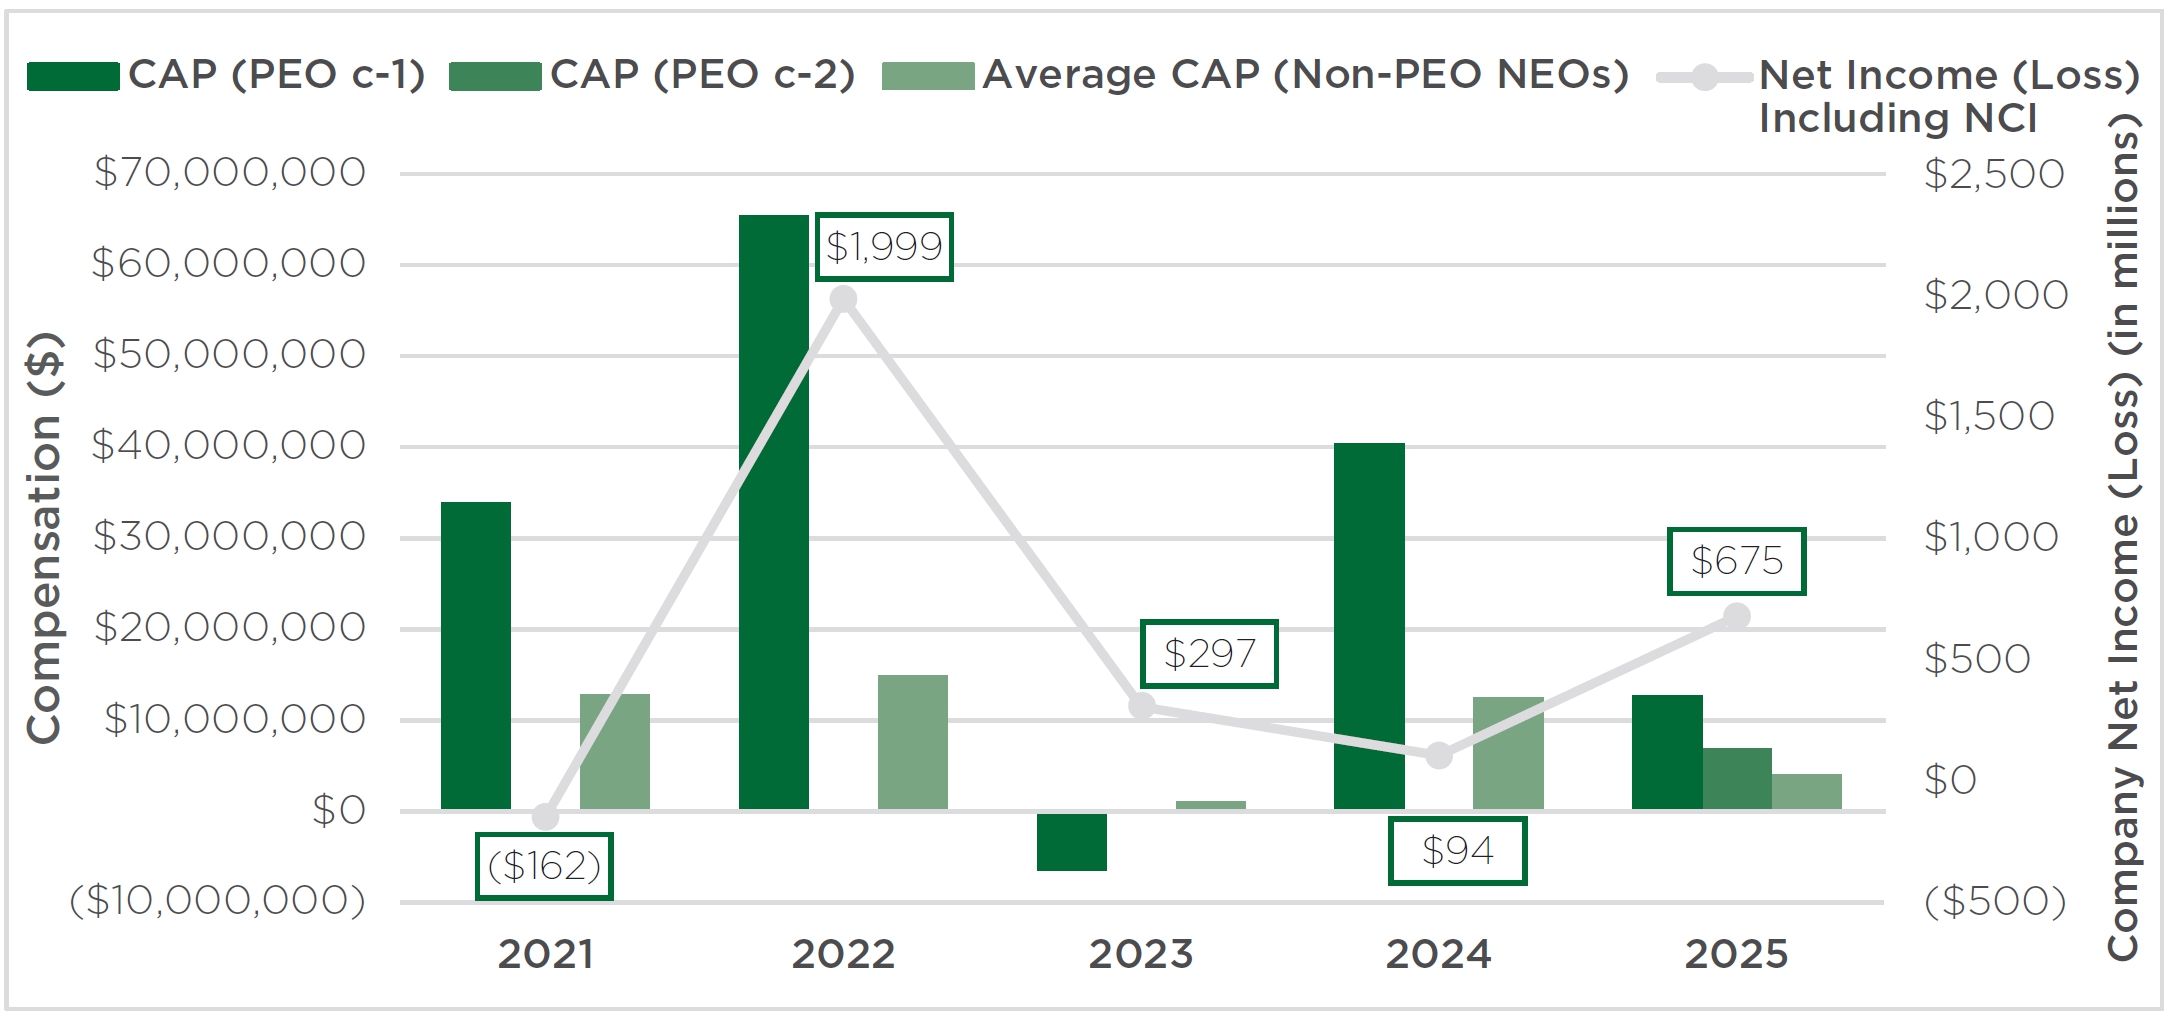
|
|
|
|
|
| Compensation Actually Paid vs. Company Selected Measure |
|
|
CAP and Total Net Debt
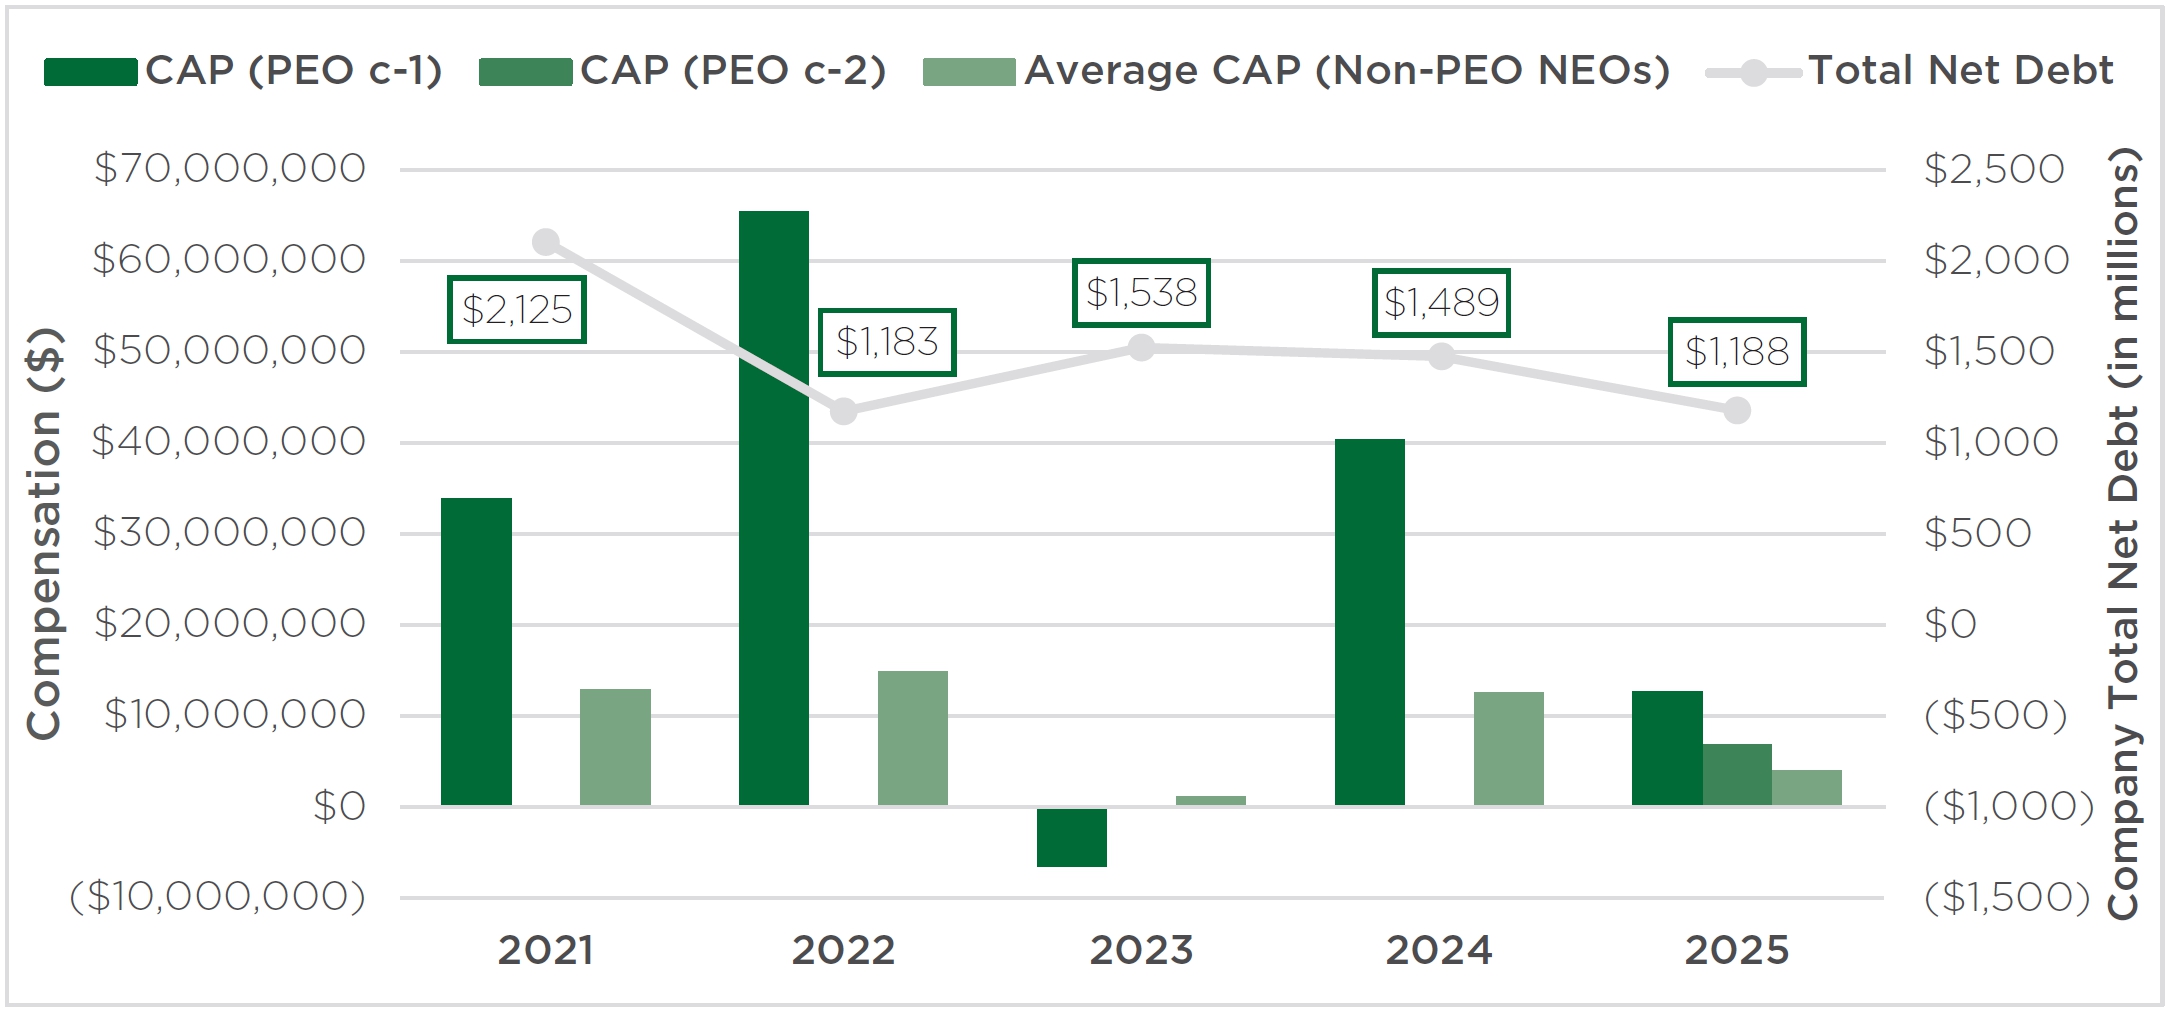
|
|
|
|
|
| Total Shareholder Return Vs Peer Group |
|
|
CAP and Cumulative TSR/Cumulative Peer Group
TSR
|
|
|
|
|
| Tabular List, Table |
|
|
Disclosure of Most Important Performance Measures for Fiscal Year
2025
The measures listed below represent the most
important financial performance measures that we used to determine CAP for fiscal year 2025.
| |
Most Important
Performance Measures |
|
| |
D&C Capital |
|
| |
Average Net Production Volumes |
|
| |
Net Debt to EBITDAX |
|
| |
Total Net Debt |
|
| |
TSR |
|
|
|
|
|
|
| Total Shareholder Return Amount |
|
|
$ 632
|
643
|
416
|
569
|
321
|
| Net Income (Loss) Attributable to Parent |
|
|
$ 675,000,000
|
$ 94,000,000
|
$ 297,000,000
|
$ 1,999,000,000
|
$ (162,000,000)
|
| Company Selected Measure Amount |
|
|
1,188,000,000
|
1,489,000,000
|
1,538,000,000
|
1,183,000,000
|
2,125,000,000
|
| PEO Name |
Michael N. Kennedy
|
Paul M. Rady
|
|
Paul M. Rady
|
Paul M. Rady
|
Paul M. Rady
|
Paul M. Rady
|
| Measure [Axis]: 1 |
|
|
|
|
|
|
|
| Pay vs Performance Disclosure [Table] |
|
|
|
|
|
|
|
| Measure Name |
|
|
Total Net Debt
|
|
|
|
|
| Measure [Axis]: 2 |
|
|
|
|
|
|
|
| Pay vs Performance Disclosure [Table] |
|
|
|
|
|
|
|
| Measure Name |
|
|
D&C Capital
|
|
|
|
|
| Measure [Axis]: 3 |
|
|
|
|
|
|
|
| Pay vs Performance Disclosure [Table] |
|
|
|
|
|
|
|
| Measure Name |
|
|
Average Net Production Volumes
|
|
|
|
|
| Measure [Axis]: 4 |
|
|
|
|
|
|
|
| Pay vs Performance Disclosure [Table] |
|
|
|
|
|
|
|
| Measure Name |
|
|
Net Debt to EBITDAX
|
|
|
|
|
| Measure [Axis]: 5 |
|
|
|
|
|
|
|
| Pay vs Performance Disclosure [Table] |
|
|
|
|
|
|
|
| Measure Name |
|
|
TSR
|
|
|
|
|
| Aggregate Grant Date Fair Value of Equity Award Amounts Reported in Summary Compensation Table [Member] | Non-PEO NEO [Member] |
|
|
|
|
|
|
|
| Pay vs Performance Disclosure [Table] |
|
|
|
|
|
|
|
| Adjustment to Compensation Amount |
|
|
$ (2,640,712)
|
|
|
|
|
| Year-end Fair Value of Equity Awards Granted in Covered Year that are Outstanding and Unvested [Member] | Non-PEO NEO [Member] |
|
|
|
|
|
|
|
| Pay vs Performance Disclosure [Table] |
|
|
|
|
|
|
|
| Adjustment to Compensation Amount |
|
|
3,379,327
|
|
|
|
|
| Year-over-Year Change in Fair Value of Equity Awards Granted in Prior Years That are Outstanding and Unvested [Member] | Non-PEO NEO [Member] |
|
|
|
|
|
|
|
| Pay vs Performance Disclosure [Table] |
|
|
|
|
|
|
|
| Adjustment to Compensation Amount |
|
|
(542,592)
|
|
|
|
|
| Vesting Date Fair Value of Equity Awards Granted and Vested in Covered Year [Member] | Non-PEO NEO [Member] |
|
|
|
|
|
|
|
| Pay vs Performance Disclosure [Table] |
|
|
|
|
|
|
|
| Adjustment to Compensation Amount |
|
|
0
|
|
|
|
|
| Change in Fair Value as of Vesting Date of Prior Year Equity Awards Vested in Covered Year [Member] | Non-PEO NEO [Member] |
|
|
|
|
|
|
|
| Pay vs Performance Disclosure [Table] |
|
|
|
|
|
|
|
| Adjustment to Compensation Amount |
|
|
13,670
|
|
|
|
|
| Prior Year End Fair Value of Equity Awards Granted in Any Prior Year that Fail to Meet Applicable Vesting Conditions During Covered Year [Member] | Non-PEO NEO [Member] |
|
|
|
|
|
|
|
| Pay vs Performance Disclosure [Table] |
|
|
|
|
|
|
|
| Adjustment to Compensation Amount |
|
|
0
|
|
|
|
|
| Dividends or Other Earnings Paid on Equity Awards not Otherwise Reflected in Total Compensation for Covered Year [Member] | Non-PEO NEO [Member] |
|
|
|
|
|
|
|
| Pay vs Performance Disclosure [Table] |
|
|
|
|
|
|
|
| Adjustment to Compensation Amount |
|
|
0
|
|
|
|
|
| Equity Awards Adjustments [Member] | Non-PEO NEO [Member] |
|
|
|
|
|
|
|
| Pay vs Performance Disclosure [Table] |
|
|
|
|
|
|
|
| Adjustment to Compensation Amount |
|
|
209,693
|
|
|
|
|
| Paul M. Rady [Member] |
|
|
|
|
|
|
|
| Pay vs Performance Disclosure [Table] |
|
|
|
|
|
|
|
| PEO Total Compensation Amount |
|
$ 12,231,359
|
|
|
|
|
|
| PEO Actually Paid Compensation Amount |
|
$ 12,771,849
|
|
|
|
|
|
| Paul M. Rady [Member] | Aggregate Grant Date Fair Value of Equity Award Amounts Reported in Summary Compensation Table [Member] | PEO [Member] |
|
|
|
|
|
|
|
| Pay vs Performance Disclosure [Table] |
|
|
|
|
|
|
|
| Adjustment to Compensation Amount |
|
|
(10,059,907)
|
|
|
|
|
| Paul M. Rady [Member] | Year-end Fair Value of Equity Awards Granted in Covered Year that are Outstanding and Unvested [Member] | PEO [Member] |
|
|
|
|
|
|
|
| Pay vs Performance Disclosure [Table] |
|
|
|
|
|
|
|
| Adjustment to Compensation Amount |
|
|
12,873,692
|
|
|
|
|
| Paul M. Rady [Member] | Year-over-Year Change in Fair Value of Equity Awards Granted in Prior Years That are Outstanding and Unvested [Member] | PEO [Member] |
|
|
|
|
|
|
|
| Pay vs Performance Disclosure [Table] |
|
|
|
|
|
|
|
| Adjustment to Compensation Amount |
|
|
(2,296,451)
|
|
|
|
|
| Paul M. Rady [Member] | Vesting Date Fair Value of Equity Awards Granted and Vested in Covered Year [Member] | PEO [Member] |
|
|
|
|
|
|
|
| Pay vs Performance Disclosure [Table] |
|
|
|
|
|
|
|
| Adjustment to Compensation Amount |
|
|
0
|
|
|
|
|
| Paul M. Rady [Member] | Change in Fair Value as of Vesting Date of Prior Year Equity Awards Vested in Covered Year [Member] | PEO [Member] |
|
|
|
|
|
|
|
| Pay vs Performance Disclosure [Table] |
|
|
|
|
|
|
|
| Adjustment to Compensation Amount |
|
|
23,156
|
|
|
|
|
| Paul M. Rady [Member] | Prior Year End Fair Value of Equity Awards Granted in Any Prior Year that Fail to Meet Applicable Vesting Conditions During Covered Year [Member] | PEO [Member] |
|
|
|
|
|
|
|
| Pay vs Performance Disclosure [Table] |
|
|
|
|
|
|
|
| Adjustment to Compensation Amount |
|
|
0
|
|
|
|
|
| Paul M. Rady [Member] | Dividends or Other Earnings Paid on Equity Awards not Otherwise Reflected in Total Compensation for Covered Year [Member] | PEO [Member] |
|
|
|
|
|
|
|
| Pay vs Performance Disclosure [Table] |
|
|
|
|
|
|
|
| Adjustment to Compensation Amount |
|
|
0
|
|
|
|
|
| Paul M. Rady [Member] | Equity Awards Adjustments [Member] | PEO [Member] |
|
|
|
|
|
|
|
| Pay vs Performance Disclosure [Table] |
|
|
|
|
|
|
|
| Adjustment to Compensation Amount |
|
|
540,490
|
|
|
|
|
| Michael N. Kennedy [Member] |
|
|
|
|
|
|
|
| Pay vs Performance Disclosure [Table] |
|
|
|
|
|
|
|
| PEO Total Compensation Amount |
$ 6,687,656
|
|
|
|
|
|
|
| PEO Actually Paid Compensation Amount |
$ 6,925,302
|
|
|
|
|
|
|
| Michael N. Kennedy [Member] | Aggregate Grant Date Fair Value of Equity Award Amounts Reported in Summary Compensation Table [Member] | PEO [Member] |
|
|
|
|
|
|
|
| Pay vs Performance Disclosure [Table] |
|
|
|
|
|
|
|
| Adjustment to Compensation Amount |
|
|
(4,325,734)
|
|
|
|
|
| Michael N. Kennedy [Member] | Year-end Fair Value of Equity Awards Granted in Covered Year that are Outstanding and Unvested [Member] | PEO [Member] |
|
|
|
|
|
|
|
| Pay vs Performance Disclosure [Table] |
|
|
|
|
|
|
|
| Adjustment to Compensation Amount |
|
|
5,535,645
|
|
|
|
|
| Michael N. Kennedy [Member] | Year-over-Year Change in Fair Value of Equity Awards Granted in Prior Years That are Outstanding and Unvested [Member] | PEO [Member] |
|
|
|
|
|
|
|
| Pay vs Performance Disclosure [Table] |
|
|
|
|
|
|
|
| Adjustment to Compensation Amount |
|
|
(978,357)
|
|
|
|
|
| Michael N. Kennedy [Member] | Vesting Date Fair Value of Equity Awards Granted and Vested in Covered Year [Member] | PEO [Member] |
|
|
|
|
|
|
|
| Pay vs Performance Disclosure [Table] |
|
|
|
|
|
|
|
| Adjustment to Compensation Amount |
|
|
0
|
|
|
|
|
| Michael N. Kennedy [Member] | Change in Fair Value as of Vesting Date of Prior Year Equity Awards Vested in Covered Year [Member] | PEO [Member] |
|
|
|
|
|
|
|
| Pay vs Performance Disclosure [Table] |
|
|
|
|
|
|
|
| Adjustment to Compensation Amount |
|
|
6,092
|
|
|
|
|
| Michael N. Kennedy [Member] | Prior Year End Fair Value of Equity Awards Granted in Any Prior Year that Fail to Meet Applicable Vesting Conditions During Covered Year [Member] | PEO [Member] |
|
|
|
|
|
|
|
| Pay vs Performance Disclosure [Table] |
|
|
|
|
|
|
|
| Adjustment to Compensation Amount |
|
|
0
|
|
|
|
|
| Michael N. Kennedy [Member] | Dividends or Other Earnings Paid on Equity Awards not Otherwise Reflected in Total Compensation for Covered Year [Member] | PEO [Member] |
|
|
|
|
|
|
|
| Pay vs Performance Disclosure [Table] |
|
|
|
|
|
|
|
| Adjustment to Compensation Amount |
|
|
0
|
|
|
|
|
| Michael N. Kennedy [Member] | Equity Awards Adjustments [Member] | PEO [Member] |
|
|
|
|
|
|
|
| Pay vs Performance Disclosure [Table] |
|
|
|
|
|
|
|
| Adjustment to Compensation Amount |
|
|
237,646
|
|
|
|
|
| Peer Group 2024 [Member] |
|
|
|
|
|
|
|
| Pay vs Performance Disclosure [Table] |
|
|
|
|
|
|
|
| Peer Group Total Shareholder Return Amount |
|
|
342
|
$ 326
|
$ 319
|
$ 321
|
$ 213
|
| Peer Group 2025 [Member] |
|
|
|
|
|
|
|
| Pay vs Performance Disclosure [Table] |
|
|
|
|
|
|
|
| Peer Group Total Shareholder Return Amount |
|
|
$ 311
|
$ 307
|
$ 324
|
$ 315
|
$ 209
|