Pay vs Performance Disclosure - USD ($)
Dec. 31, 2025
Dec. 31, 2024
Dec. 31, 2023
Dec. 31, 2022
Dec. 31, 2021
PAY VERSUS PERFORMANCE TABLE
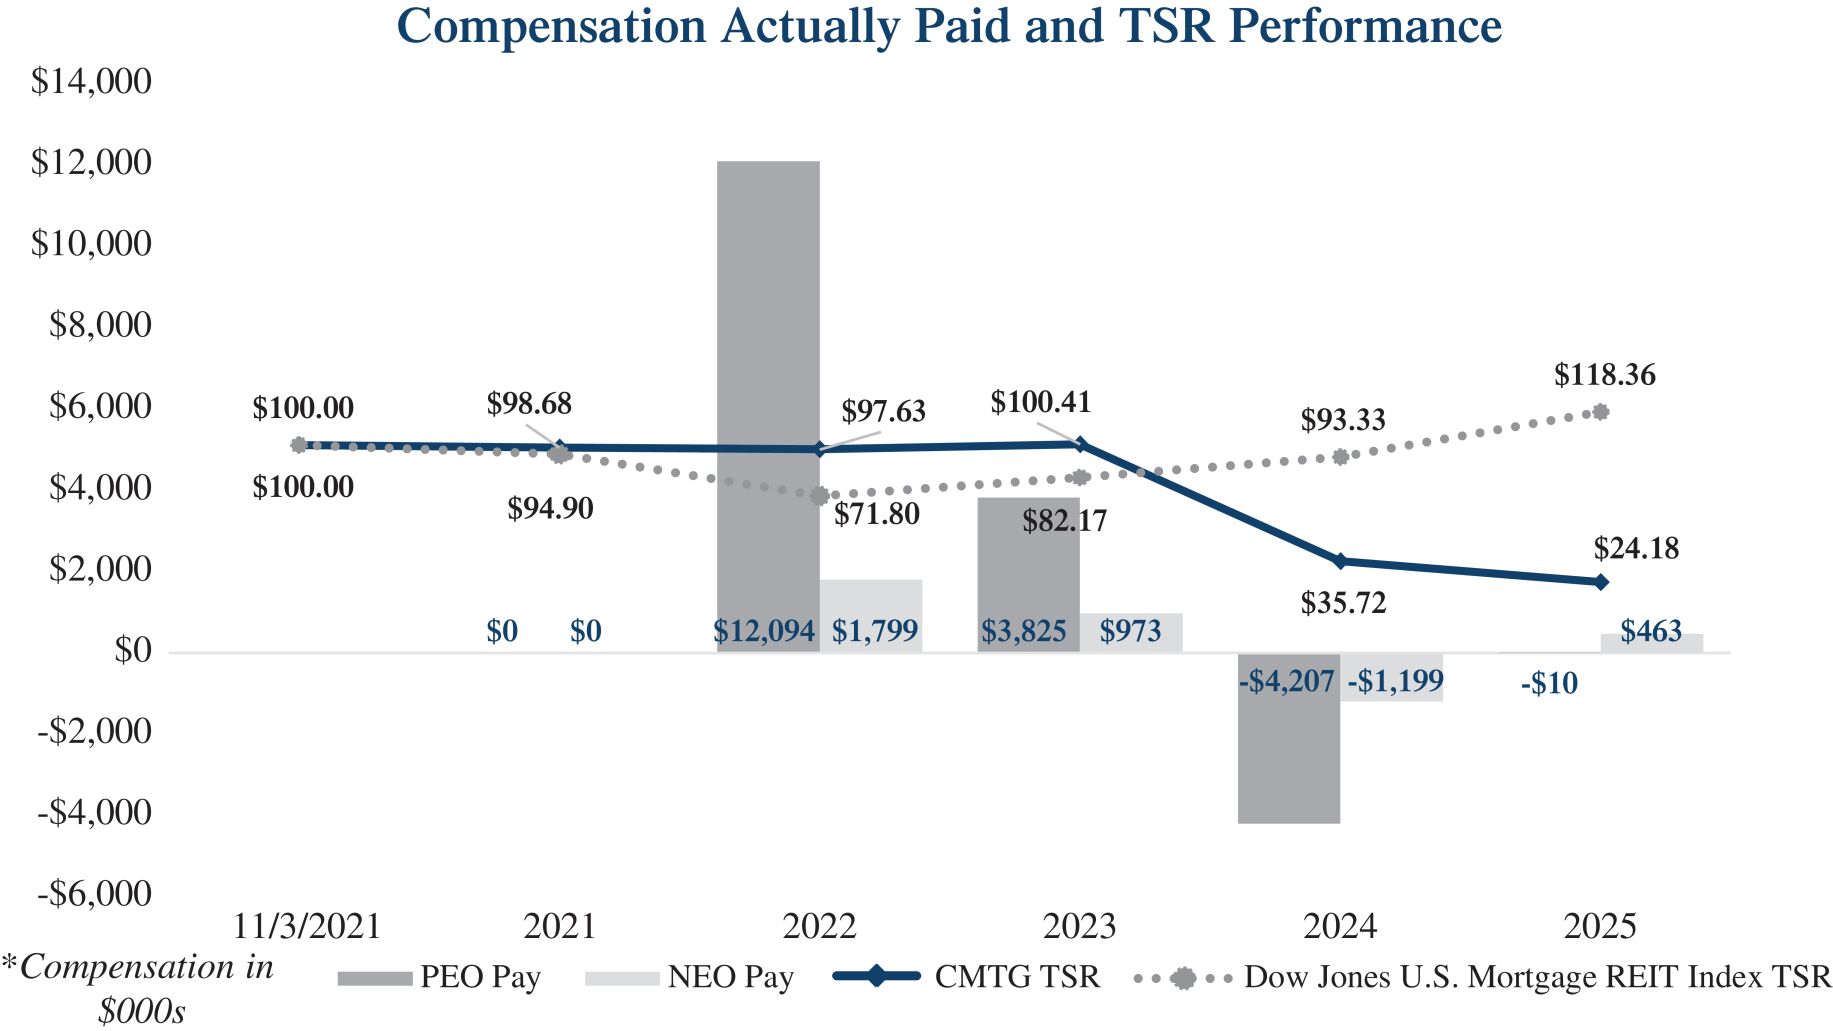
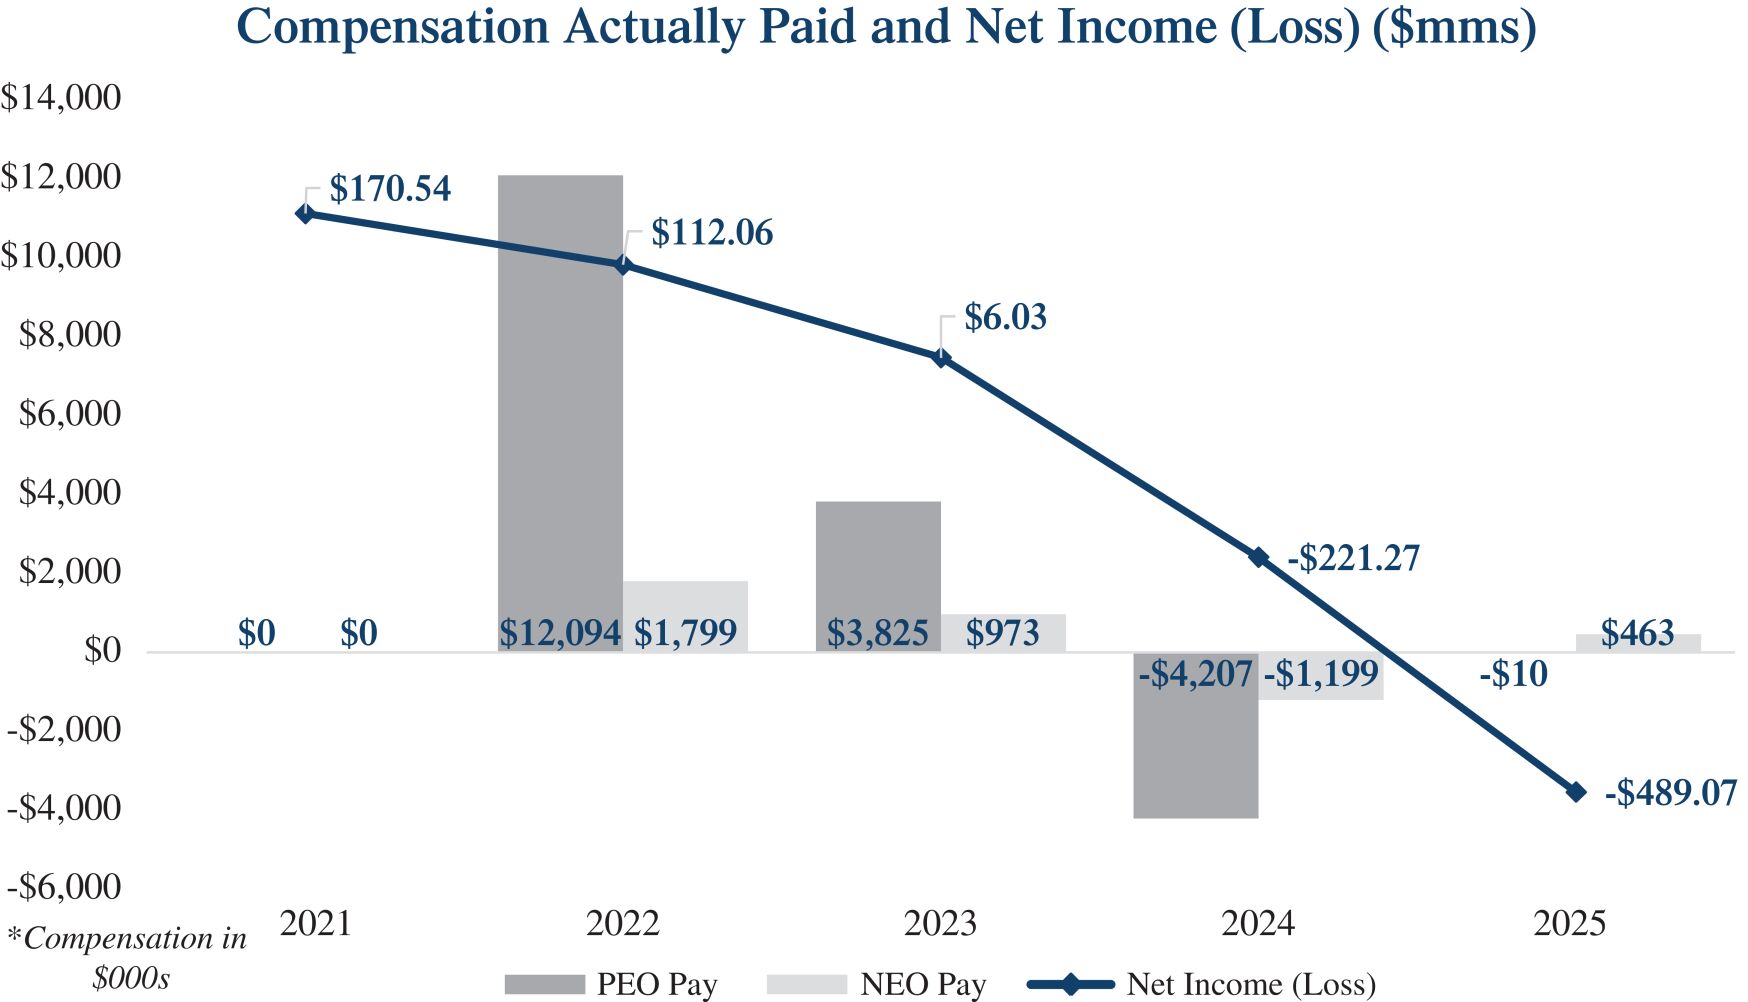
The following table sets forth information concerning the compensation of our named executive officers (NEOs), including our principal executive officer (PEO), for each of the fiscal years ended December 31, 2021, 2022, 2023, 2024, and 2025 and our financial performance for each such fiscal year:
Value of Initial Fixed $100 Investment Based on: (2) |
||||||||||||||||||||||||||||||||
Year |
Summary Compensation Table Total for Principal Executive Officer (“PEO”) ($) |
Compensation Actually Paid to PEO ($) (1) |
Average Summary Compensation Table Total for Non-PEO NEOs ($) |
Average Compensation Actually Paid to Non-PEO NEOs ($) (1) |
Total Shareholder Return ($) |
Peer Group Total Shareholder Return ($) (3) |
Net Income (Loss) ($mms) |
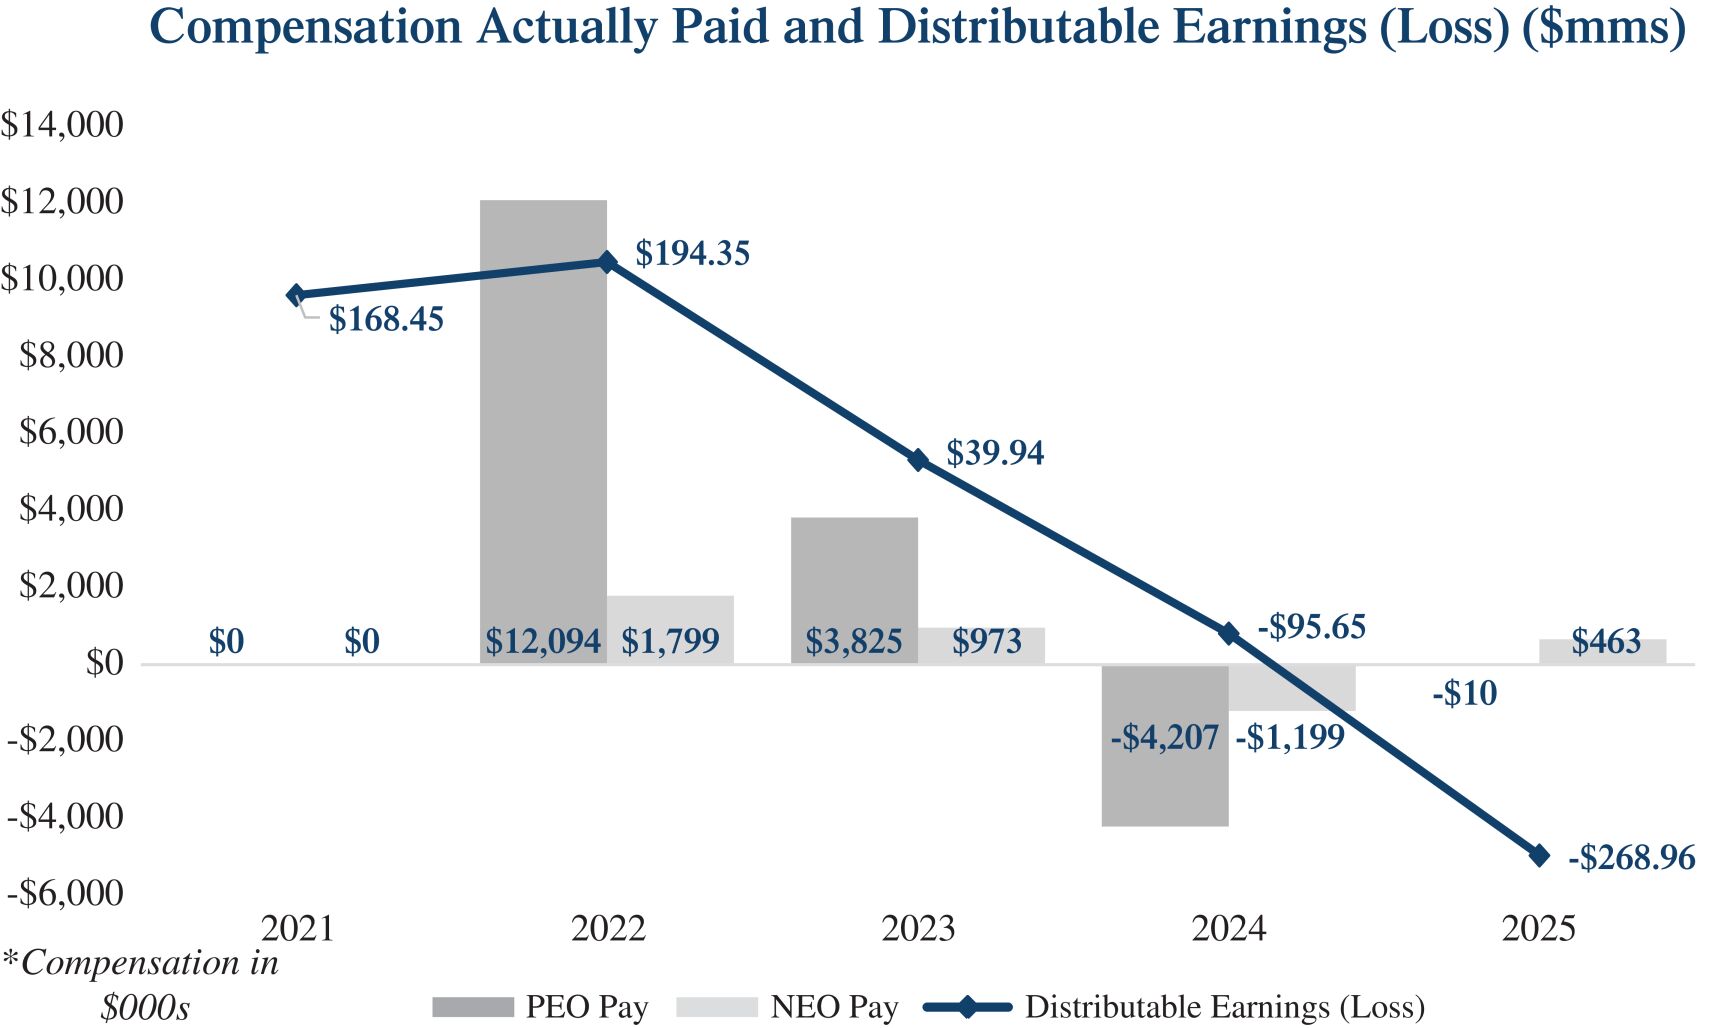
Distributable Earnings (Loss) ($mms) (4)(5) |
||||||||||||||||||||||||
2025 |
$ | 757,249 | $ | (10,238 | ) | $ | 598,893 | $ | 463,046 | $ | 24.18 | $ | 118.36 | $ | (489.07 | ) | $ | (268.96 | ) | |||||||||||||
2024 |
$ | 2,556,914 | $ | (4,206,659 | ) | $ | 978,873 | $ | (1,198,536 | ) | $ | 35.72 | $ | 93.33 | $ | (221.27 | ) | $ | (95.65 | ) | ||||||||||||
2023 |
$ | 3,354,032 | $ | 3,825,032 | $ | 868,714 | $ | 973,020 | $ | 100.41 | $ | 82.17 | $ | 6.03 | $ | 39.94 | ||||||||||||||||
2022 |
$ | 14,310,747 | $ | 12,093,805 | $ | 2,109,503 | $ | 1,798,969 | $ | 97.63 | $ | 71.80 | $ | 112.06 | $ | 194.35 | ||||||||||||||||
2021 |
— | — | — | — | $ | 98.68 | $ | 94.90 | $ | 170.54 | $ | 168.45 | ||||||||||||||||||||
| (1) | Amounts represent compensation actually paid to our PEO and the average compensation actually paid to our remaining NEOs for the relevant fiscal year, as determined under SEC rules (and described below), which includes the individuals indicated in the table below for each fiscal year: |
Year |
PEO |
Non-PEO NEOs | ||
2025 |
Richard J. Mack | Michael McGillis, Priyanka Garg and J.D. Siegel | ||
2024 |
Richard J. Mack | Michael McGillis, Kevin Cullinan, Priyanka Garg and J.D. Siegel | ||
2023 |
Richard J. Mack | Jai Agarwal, Michael McGillis, Kevin Cullinan, Priyanka Garg and J.D. Siegel | ||
2022 |
Richard J. Mack | Jai Agarwal, Michael McGillis, Kevin Cullinan, Priyanka Garg and J.D. Siegel | ||
2021 |
Richard J. Mack | Michael McGillis |
Compensation actually paid to our NEOs represents the “Total” compensation reported in the Summary Compensation Table for the applicable fiscal year, as adjusted as follows. No other adjustments are required under applicable SEC rules.
2025 |
||||||||
Adjustments (a) |
PEO |
Average Non- PEO NEOs |
||||||
Deduction for Amounts Reported under the “Stock Awards” and “Option Awards” Columns in the Summary Compensation Table for Applicable Fiscal Year (“FY”) |
($ | 757,249 | ) | ($ | 368,145 | ) | ||
Increase based on ASC 718 Fair Value of Awards Granted during Applicable FY that Remain Unvested as of Applicable FY End, determined as of Applicable FY End |
$ | 953,573 | $ | 463,590 | ||||
Deduction for Change in Fair Value from prior Year-end to current Year-end of Awards Granted Prior to year that were Outstanding and Unvested as of Year-end |
($ | 402,618 | ) | ($ | 118,985 | ) | ||
Deduction for Change in Fair Value from Prior Year-end to Vesting Date of Awards Granted Prior to year that Vested during year |
($ | 561,192 | ) | ($ | 112,308 | ) | ||
Deduction of Fair Value of Awards Granted Prior to year that were Forfeited during year |
$ | — | $ | — | ||||
Increase based on Dividends or Other Earnings Paid during Applicable FY prior to Vesting Date |
$ | — | $ | — | ||||
TOTAL ADJUSTMENTS |
($ | 767,487 | ) | ($ | 135,848 | ) | ||
| (a) | Time-based RSU award grant date fair values were calculated using the stock price as of the date of grant. The valuation assumptions used to calculate the fair values of the time-based RSU awards that were outstanding as of the end of the covered fiscal year have been adjusted using the stock price as of year-end. The closing price of our Common Stock on the NYSE as of December 31, 2025, the last trading day of the fiscal year, was $3.06 per share. |
| (2) | TSR as calculated based on a fixed investment of one hundred ($100) dollars measured from the market close on November 3, 2021 (the date our common stock began trading on the NYSE) through and including the end of the fiscal year for each year reported in the table as required by Item 402(v) of Regulation S-K. |
| (3) | For the 2024 and 2025 fiscal years, represents the cumulative TSR (the “Peer Group TSR”) of the Dow Jones U.S. Mortgage REIT Index (the “ Peer Group Prior Peer Group |
| (4) | As an externally managed company, we do not maintain an incentive compensation program that enables us to disclose a “company-selected measure” within the meaning of the SEC rules. However, we have chosen to disclose information regarding Distributable Earnings (Loss), which we believe is the most important financial performance measure in evaluating our NEOs’ compensation as compared to company performance. |
| (5) | Distributable Earnings (Loss) is a non-Generally Accepted Accounting Principles (“GAAP”) measure used to evaluate our performance excluding the effects of certain transactions, non-cash items and GAAP adjustments, as determined by our Manager. Distributable Earnings (Loss) is a non-GAAP measure, which we define as net income (loss) in accordance with GAAP, excluding (i) non-cash stock-based compensation expense, (ii) real estate owned held-for-investment mark-to-market (iv) one-time events pursuant to changes in GAAP and (v) certain non-cash items, which in the judgment of our Manager, should not be included in Distributable Earnings (Loss). Pursuant to the Management Agreement, we use Core Earnings, which is substantially the same as Distributable Earnings (Loss) excluding incentive fees, to determine the incentive fees we pay our Manager. A reconciliation of net income (loss) to Distributable Earnings (Loss) is available in Appendix A of this Proxy Statement. |
Year |
PEO |
Non-PEO NEOs | ||
2025 |
Richard J. Mack | Michael McGillis, Priyanka Garg and J.D. Siegel | ||
2024 |
Richard J. Mack | Michael McGillis, Kevin Cullinan, Priyanka Garg and J.D. Siegel | ||
2023 |
Richard J. Mack | Jai Agarwal, Michael McGillis, Kevin Cullinan, Priyanka Garg and J.D. Siegel | ||
2022 |
Richard J. Mack | Jai Agarwal, Michael McGillis, Kevin Cullinan, Priyanka Garg and J.D. Siegel | ||
2021 |
Richard J. Mack | Michael McGillis |
Peer Group
Prior Peer Group
Compensation actually paid to our NEOs represents the “Total” compensation reported in the Summary Compensation Table for the applicable fiscal year, as adjusted as follows. No other adjustments are required under applicable SEC rules.
2025 |
||||||||
Adjustments (a) |
PEO |
Average Non- PEO NEOs |
||||||
Deduction for Amounts Reported under the “Stock Awards” and “Option Awards” Columns in the Summary Compensation Table for Applicable Fiscal Year (“FY”) |
($ | 757,249 | ) | ($ | 368,145 | ) | ||
Increase based on ASC 718 Fair Value of Awards Granted during Applicable FY that Remain Unvested as of Applicable FY End, determined as of Applicable FY End |
$ | 953,573 | $ | 463,590 | ||||
Deduction for Change in Fair Value from prior Year-end to current Year-end of Awards Granted Prior to year that were Outstanding and Unvested as of Year-end |
($ | 402,618 | ) | ($ | 118,985 | ) | ||
Deduction for Change in Fair Value from Prior Year-end to Vesting Date of Awards Granted Prior to year that Vested during year |
($ | 561,192 | ) | ($ | 112,308 | ) | ||
Deduction of Fair Value of Awards Granted Prior to year that were Forfeited during year |
$ | — | $ | — | ||||
Increase based on Dividends or Other Earnings Paid during Applicable FY prior to Vesting Date |
$ | — | $ | — | ||||
TOTAL ADJUSTMENTS |
($ | 767,487 | ) | ($ | 135,848 | ) | ||
| (a) | Time-based RSU award grant date fair values were calculated using the stock price as of the date of grant. The valuation assumptions used to calculate the fair values of the time-based RSU awards that were outstanding as of the end of the covered fiscal year have been adjusted using the stock price as of year-end. The closing price of our Common Stock on the NYSE as of December 31, 2025, the last trading day of the fiscal year, was $3.06 per share. |
Pay Versus Performance Tabular
List
As mentioned above, as an externally managed company we do not maintain an
ince
ntive compensation program that contains financial performance measures related to CMTG. However, we believe the following performance measures represent the most important financial performance measures in evaluating compensation actually paid to our NEOs for the fiscal year ended December 31, 2025 related to CMTG: | • | Distributable Earnings (Loss); |
| • | Net Income (Loss); and |
| • | TSR. |
| (5) | Distributable Earnings (Loss) is a non-Generally Accepted Accounting Principles (“GAAP”) measure used to evaluate our performance excluding the effects of certain transactions, non-cash items and GAAP adjustments, as determined by our Manager. Distributable Earnings (Loss) is a non-GAAP measure, which we define as net income (loss) in accordance with GAAP, excluding (i) non-cash stock-based compensation expense, (ii) real estate owned held-for-investment mark-to-market (iv) one-time events pursuant to changes in GAAP and (v) certain non-cash items, which in the judgment of our Manager, should not be included in Distributable Earnings (Loss). Pursuant to the Management Agreement, we use Core Earnings, which is substantially the same as Distributable Earnings (Loss) excluding incentive fees, to determine the incentive fees we pay our Manager. A reconciliation of net income (loss) to Distributable Earnings (Loss) is available in Appendix A of this Proxy Statement. |