| Year | Summary Compensation Table Total for PEO– M. Murray(1) | Compensation Actually Paid to PEO– M. Murray(1)(2) | Average Summary Compensation Table Total for Non-PEO NEOs(1) | Average Compensation Actually Paid to Non-PEO NEOs(1)(2) | Value of Initial Fixed $100 Investment Based On Total Shareholder Return(3) | Net Income (Loss) | ||||||||||||||||||
| 2025 | $ | 2,257,423 | $ | 2,850,268 | $ | 736,371 | $ | 927,888 | $ | 188.71 | $ | 2,549,249 | ||||||||||||
| 2024 | $ | 2,390,838 | $ | 2,491,558 | $ | 516,011 | $ | 427,512 | $ | 33.25 | $ | (43,877,896 | ) | |||||||||||
| 2023 | $ | 1,042,357 | $ | 1,651,367 | $ | 602,068 | $ | 684,290 | $ | 49.63 | $ | (19,748,219 | ) | |||||||||||
| (1) | Mr. Murray was PEO for fiscal years 2025, 2024 and 2023. The Non-PEO NEOs presented for fiscal year 2025 consists of Mr. Manz commencing with his employment on September 2, 2025, Mr. Sneider through September 1, 2025 (termination of position Chief Financial Officer and Treasurer) and Mr. Baker. The Non-PEO NEOs presented for fiscal years 2024 and 2023 consists of Mr. Sneider and Mr. Baker. |
| (2) | Compensation Actually Paid reflects the exclusions and inclusions of certain amounts for the PEO and the Non-PEO NEOs as set forth below. Equity values are calculated in accordance with FASB ASC Topic 718. |
| (3) | The cumulative total shareholder return (“TSR”) measures the cumulative value of $100 invested on the last trading day before the earliest fiscal year in the table, or December 31, 2022, including the reinvestment of dividends, through and including the end of the applicable fiscal year for which TSR is calculated, or December 27, 2025, December 28, 2024, and December 30, 2023. The Company did not pay dividends in the periods presented. |
| Year | Reported Summary Compensation Table Total for PEO (Michael Murray) | Reported Value of Equity Awards(a) | Equity Award Adjustments(b) | Compensation Actually Paid to PEO (Michael Murray) | ||||||||||||
| 2025 | $ | 2,257,423 | $ | (1,176,682 | ) | $ | 1,769,527 | $ | 2,850,268 | |||||||
| 2024 | $ | 2,390,838 | $ | (1,007,880 | ) | $ | 1,108,600 | $ | 2,491,558 | |||||||
| 2023 | $ | 1,042,357 | $ | (431,999 | ) | $ | 1,041,010 | $ | 1,651,367 | |||||||
| (a) | Represents the total of the grant date fair value of equity award reported in the “Stock Awards” column in the Summary Compensation Table for the applicable year. |
| (b) | The equity award adjustments include the addition (or subtraction, as applicable) of the following: (i) the year-end fair value of any equity awards granted in the applicable year that are outstanding and unvested as of the end of the year; (ii) the amount of change as of the end of the applicable year (from the end of the prior fiscal year) in fair value of any awards granted in prior years that are outstanding and unvested as of the end of the applicable year; (iii) for awards that are granted and vest in same applicable year, the fair value as of the vesting date; (iv) for awards granted in prior years that vest in the applicable year, the amount equal to the change as of the vesting date (from the end of the prior fiscal year) in fair value; (v) for awards granted in prior years that are determined to fail to meet the applicable vesting conditions during the applicable year, a deduction for the amount equal to the fair value at the end of the prior fiscal year; and (vi) the dollar value of any dividends or other earnings paid on stock awards in the applicable year prior to the vesting date that are not otherwise reflected in the fair value of such award or included in any other component of total compensation for the applicable year. The valuation assumptions used to calculate fair value did not materially differ from those disclosed at the time of grant. The amounts deducted or added in calculating the equity award adjustments are as follows: |
| Year | Year End Fair Value of Equity Award Granted during Year that Remains Unvested | Year over Year Change in Fair Value of Outstanding and Unvested Equity Awards | Fair Value as of Vesting Date of Equity Awards Granted and Vested in the Year | Change in Fair Value of Equity Awards Granted in Prior Years that Vested in the Year | Fair Value at the End of the Prior Year of Equity Awards that Failed to Meet Vesting Conditions in the Year | Value of Dividends or other Earnings Paid on Stock Awards not Otherwise Reflected in Fair Value or Total Compensation | Total Equity Award Adjustments | |||||||||||||||||||||
| 2025 | $ | 2,161,195 | $ | (637,201 | ) | $ | $ | 245,533 | $ | $ | $ | 1,769,527 | ||||||||||||||||
| 2024 | $ | 1,668,000 | $ | (328,533 | ) | $ | $ | (220,392 | ) | $ | (10,475 | ) | $ | $ | 1,108,600 | |||||||||||||
| 2023 | $ | 428,190 | $ | 505,600 | $ | 56,020 | $ | 51,200 | $ | $ | $ | 1,041,010 | ||||||||||||||||
| Year | Average Reported Summary Compensation Table Total for Non-PEO NEOs(a) | Average Reported Value of Equity Awards | Average Equity Award Adjustments(b) | Average Compensation Actually Paid to Non-PEO NEOs(b) | ||||||||||||
| 2025 | $ | 736,371 | $ | (470,229 | ) | $ | 661,746 | $ | 927,888 | |||||||
| 2024 | $ | 516,011 | $ | (159,873 | ) | $ | 71,375 | $ | 427,513 | |||||||
| 2023 | $ | 602,068 | $ | (255,140 | ) | $ | 337,362 | $ | 684,290 | |||||||
| (a) | Represents the total of the average grant date fair value of the equity awards reported in the “Stock Awards” column in the Summary Compensation Table for the applicable year for all Non-PEO NEOs. | |
| (b) | The equity award adjustments for each applicable year include the addition (or subtraction, as applicable) of the following: (i) the year- end fair value of any equity awards granted in the applicable year that are outstanding and unvested as of the end of the year; (ii) the amount of change as of the end of the applicable year (from the end of the prior fiscal year) in fair value of any awards granted in prior years that are outstanding and unvested as of the end of the applicable year; (iii) for awards that are granted and vest in same applicable year, the fair value as of the vesting date; (iv) for awards granted in prior years that vest in the applicable year, the amount equal to the change as of the vesting date (from the end of the prior fiscal year) in fair value; (v) for awards granted in prior years that are determined to fail to meet the applicable vesting conditions during the applicable year, a deduction for the amount equal to the fair value at the end of the prior fiscal year; and (vi) the dollar value of any dividends or other earnings paid on stock awards in the applicable year prior to the vesting date that are not otherwise reflected in the fair value of such award or included in any other component of total compensation for the applicable year. The valuation assumptions used to calculate fair value did not materially differ from those disclosed at the time of grant. The amounts deducted or added in calculating the equity award adjustments are as follows: |
| Year | Year End Fair Value of Equity Award Granted during Year that Remains Unvested | Year over Year Average Change in Fair Value of Outstanding and Unvested Equity Awards | Average Fair Value as of Vesting Date of Equity Awards Granted and Vested in the Year | Year over Year Average Change in Fair Value of Equity Awards Granted in Prior Years that Vested in the Year | Average Fair Value at the End of the Prior Year of Equity Awards that Failed to Meet Vesting Conditions in the Year | Average Value of Dividends or other Earnings Paid on Stock Awards not Otherwise Reflected in Fair Value or Total Compensation | Total Average Equity Award Adjustments | |||||||||||||||||||||
| 2025 | $ | 624,275 | $ | 43,700 | $ | $ | 24,921 | $ | (31,150 | ) | $ | $ | 661,746 | |||||||||||||||
| 2024 | $ | 164,090 | $ | (27,840 | ) | $ | $ | (57,187 | ) | $ | (7,688 | ) | $ | $ | 71,375 | |||||||||||||
| 2023 | $ | 260,026 | $ | 37,130 | $ | 45,538 | $ | 9,920 | $ | (15,252 | ) | $ | $ | 337,362 | ||||||||||||||
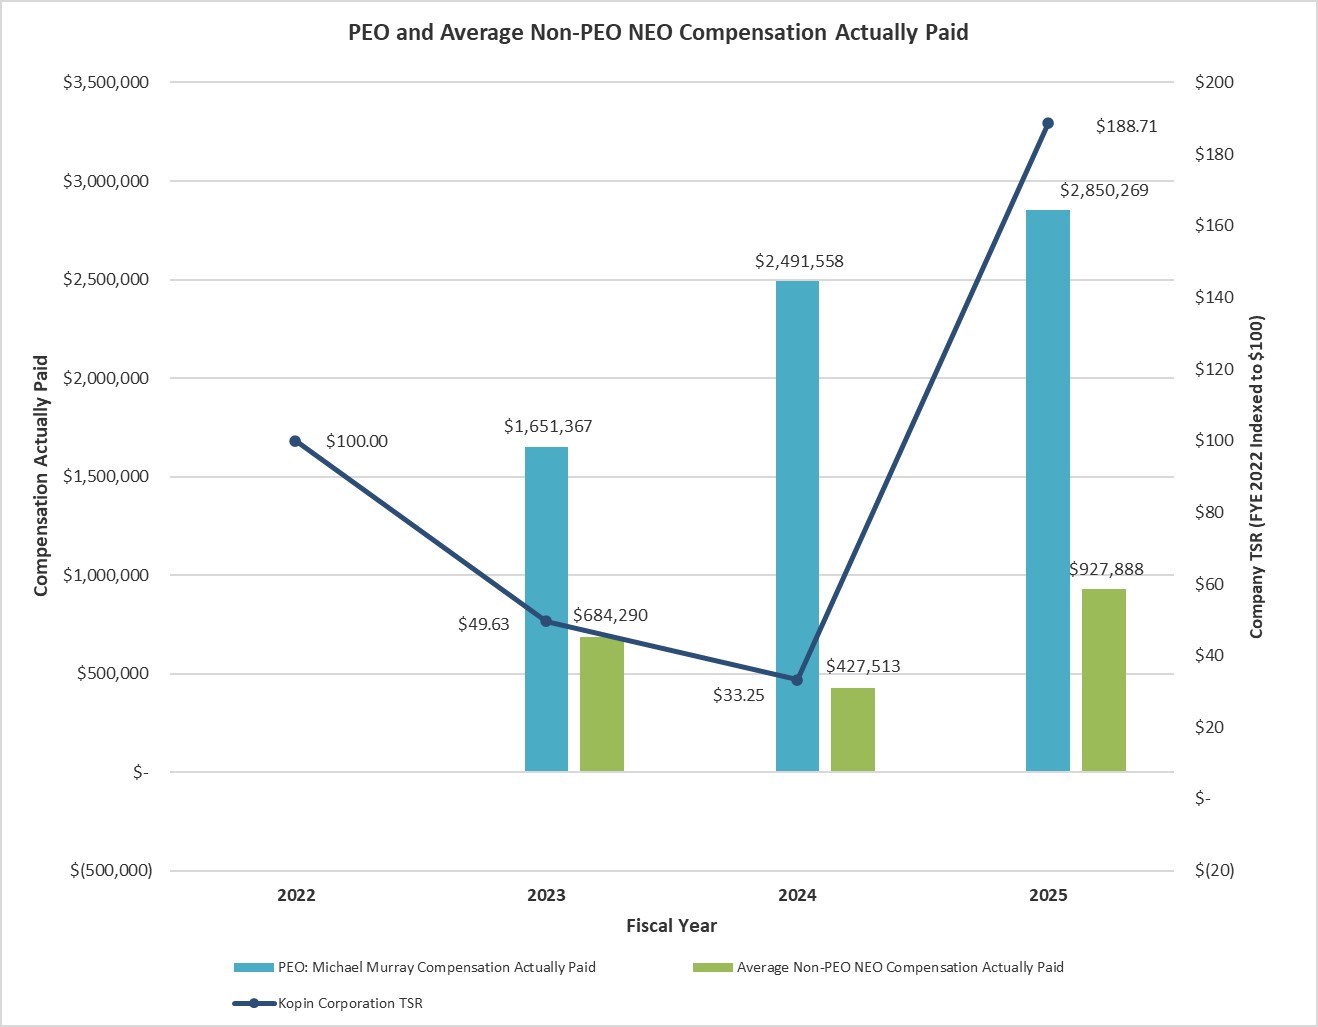
The following chart sets forth the relationship between Compensation Actually Paid to our PEOs, the average of Compensation Actually Paid to our Non-PEO NEOs, and the Company’s cumulative TSR over the two most recently completed fiscal years.
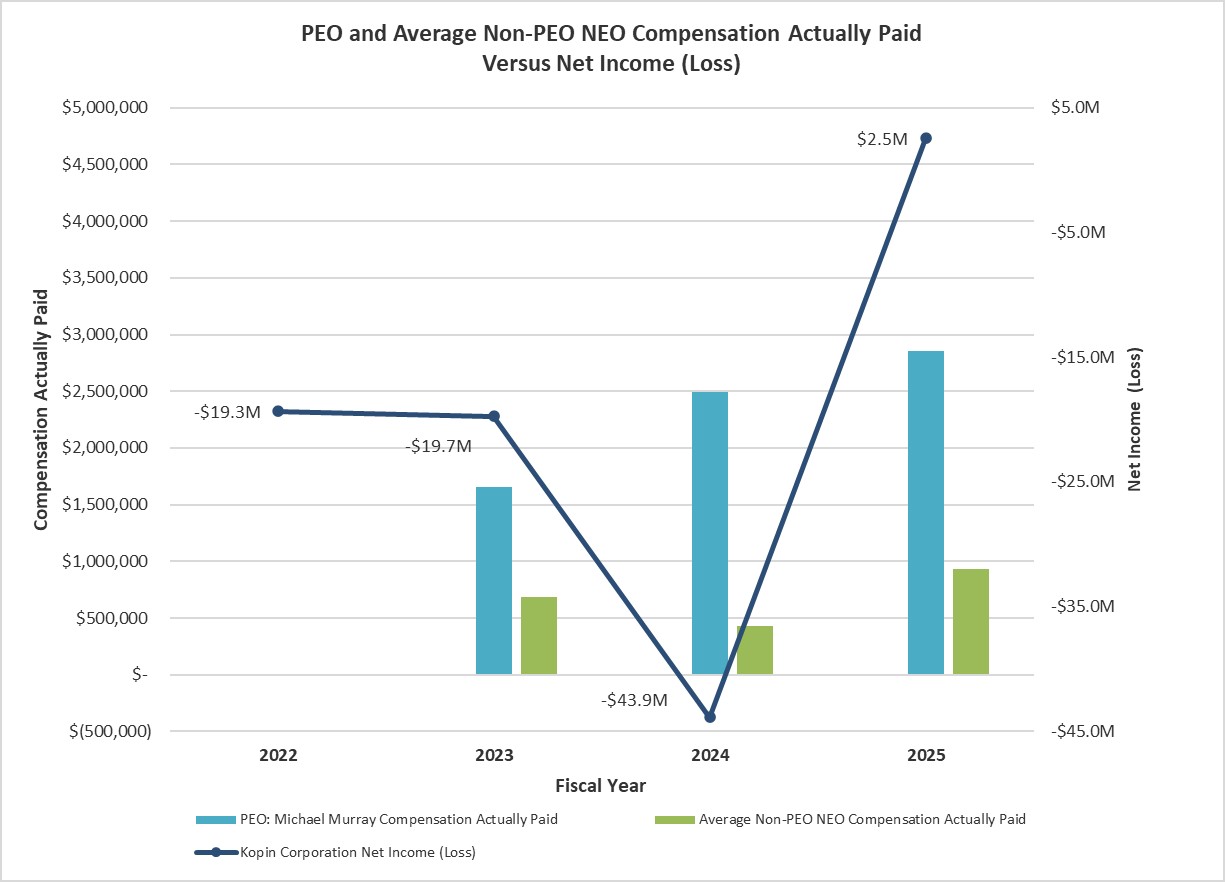
Description of Relationship Between PEO and Non-PEO NEO Compensation Actually Paid and Net Loss
The following chart sets forth the relationship between Compensation Actually Paid to our PEOs, the average of Compensation Actually Paid to our Non-PEO NEOs, and our Net Loss during the two most recently completed fiscal years.
| [1] | Mr. Murray was PEO for fiscal years 2025, 2024 and 2023. The Non-PEO NEOs presented for fiscal year 2025 consists of Mr. Manz commencing with his employment on September 2, 2025, Mr. Sneider through September 1, 2025 (termination of position Chief Financial Officer and Treasurer) and Mr. Baker. The Non-PEO NEOs presented for fiscal years 2024 and 2023 consists of Mr. Sneider and Mr. Baker. |
| [2] | Compensation Actually Paid reflects the exclusions and inclusions of certain amounts for the PEO and the Non-PEO NEOs as set forth below. Equity values are calculated in accordance with FASB ASC Topic 718. |
| [3] | The cumulative total shareholder return (“TSR”) measures the cumulative value of $100 invested on the last trading day before the earliest fiscal year in the table, or December 31, 2022, including the reinvestment of dividends, through and including the end of the applicable fiscal year for which TSR is calculated, or December 27, 2025, December 28, 2024, and December 30, 2023. The Company did not pay dividends in the periods presented. |
| [4] | The equity award adjustments include the addition (or subtraction, as applicable) of the following: (i) the year-end fair value of any equity awards granted in the applicable year that are outstanding and unvested as of the end of the year; (ii) the amount of change as of the end of the applicable year (from the end of the prior fiscal year) in fair value of any awards granted in prior years that are outstanding and unvested as of the end of the applicable year; (iii) for awards that are granted and vest in same applicable year, the fair value as of the vesting date; (iv) for awards granted in prior years that vest in the applicable year, the amount equal to the change as of the vesting date (from the end of the prior fiscal year) in fair value; (v) for awards granted in prior years that are determined to fail to meet the applicable vesting conditions during the applicable year, a deduction for the amount equal to the fair value at the end of the prior fiscal year; and (vi) the dollar value of any dividends or other earnings paid on stock awards in the applicable year prior to the vesting date that are not otherwise reflected in the fair value of such award or included in any other component of total compensation for the applicable year. The valuation assumptions used to calculate fair value did not materially differ from those disclosed at the time of grant. The amounts deducted or added in calculating the equity award adjustments are as follows: |
| [5] | Represents the total of the grant date fair value of equity award reported in the “Stock Awards” column in the Summary Compensation Table for the applicable year. |
| [6] | Represents the total of the average grant date fair value of the equity awards reported in the “Stock Awards” column in the Summary Compensation Table for the applicable year for all Non-PEO NEOs. |
| [7] | The equity award adjustments for each applicable year include the addition (or subtraction, as applicable) of the following: (i) the year- end fair value of any equity awards granted in the applicable year that are outstanding and unvested as of the end of the year; (ii) the amount of change as of the end of the applicable year (from the end of the prior fiscal year) in fair value of any awards granted in prior years that are outstanding and unvested as of the end of the applicable year; (iii) for awards that are granted and vest in same applicable year, the fair value as of the vesting date; (iv) for awards granted in prior years that vest in the applicable year, the amount equal to the change as of the vesting date (from the end of the prior fiscal year) in fair value; (v) for awards granted in prior years that are determined to fail to meet the applicable vesting conditions during the applicable year, a deduction for the amount equal to the fair value at the end of the prior fiscal year; and (vi) the dollar value of any dividends or other earnings paid on stock awards in the applicable year prior to the vesting date that are not otherwise reflected in the fair value of such award or included in any other component of total compensation for the applicable year. The valuation assumptions used to calculate fair value did not materially differ from those disclosed at the time of grant. The amounts deducted or added in calculating the equity award adjustments are as follows: |