2025 Pay Versus Performance
As required by Section 953(a) of the Dodd-Frank Wall Street Reform and Consumer Protection Act and Item 402(v) of Regulation S-K we are providing the following information to show how compensation actually paid (“CAP”) to the PEO and the Non-PEO NEOs (as described below) (averaged) relates to certain total shareholder return results, Garmin net income and Garmin operating income results for the years 2021-2025.
| Average Summary Compensation Table Total for Non-PEO Named Executive Officers | Average Compensation Actually Paid to Non-PEO Named Executive Officers | Value of Initial Fixed $100 Investment Based on: | ||||||||||||||||||||||||||||||
| Year | Summary Compensation Table Total for PEO | Compensation Actually Paid to PEO | Total Shareholder Return | Peer Group Total Shareholder Return | Net Income | Operating Income | ||||||||||||||||||||||||||
| (a) | (b) | (c) | (d) | (e) | (f) | (g) | (h) | (i) | ||||||||||||||||||||||||
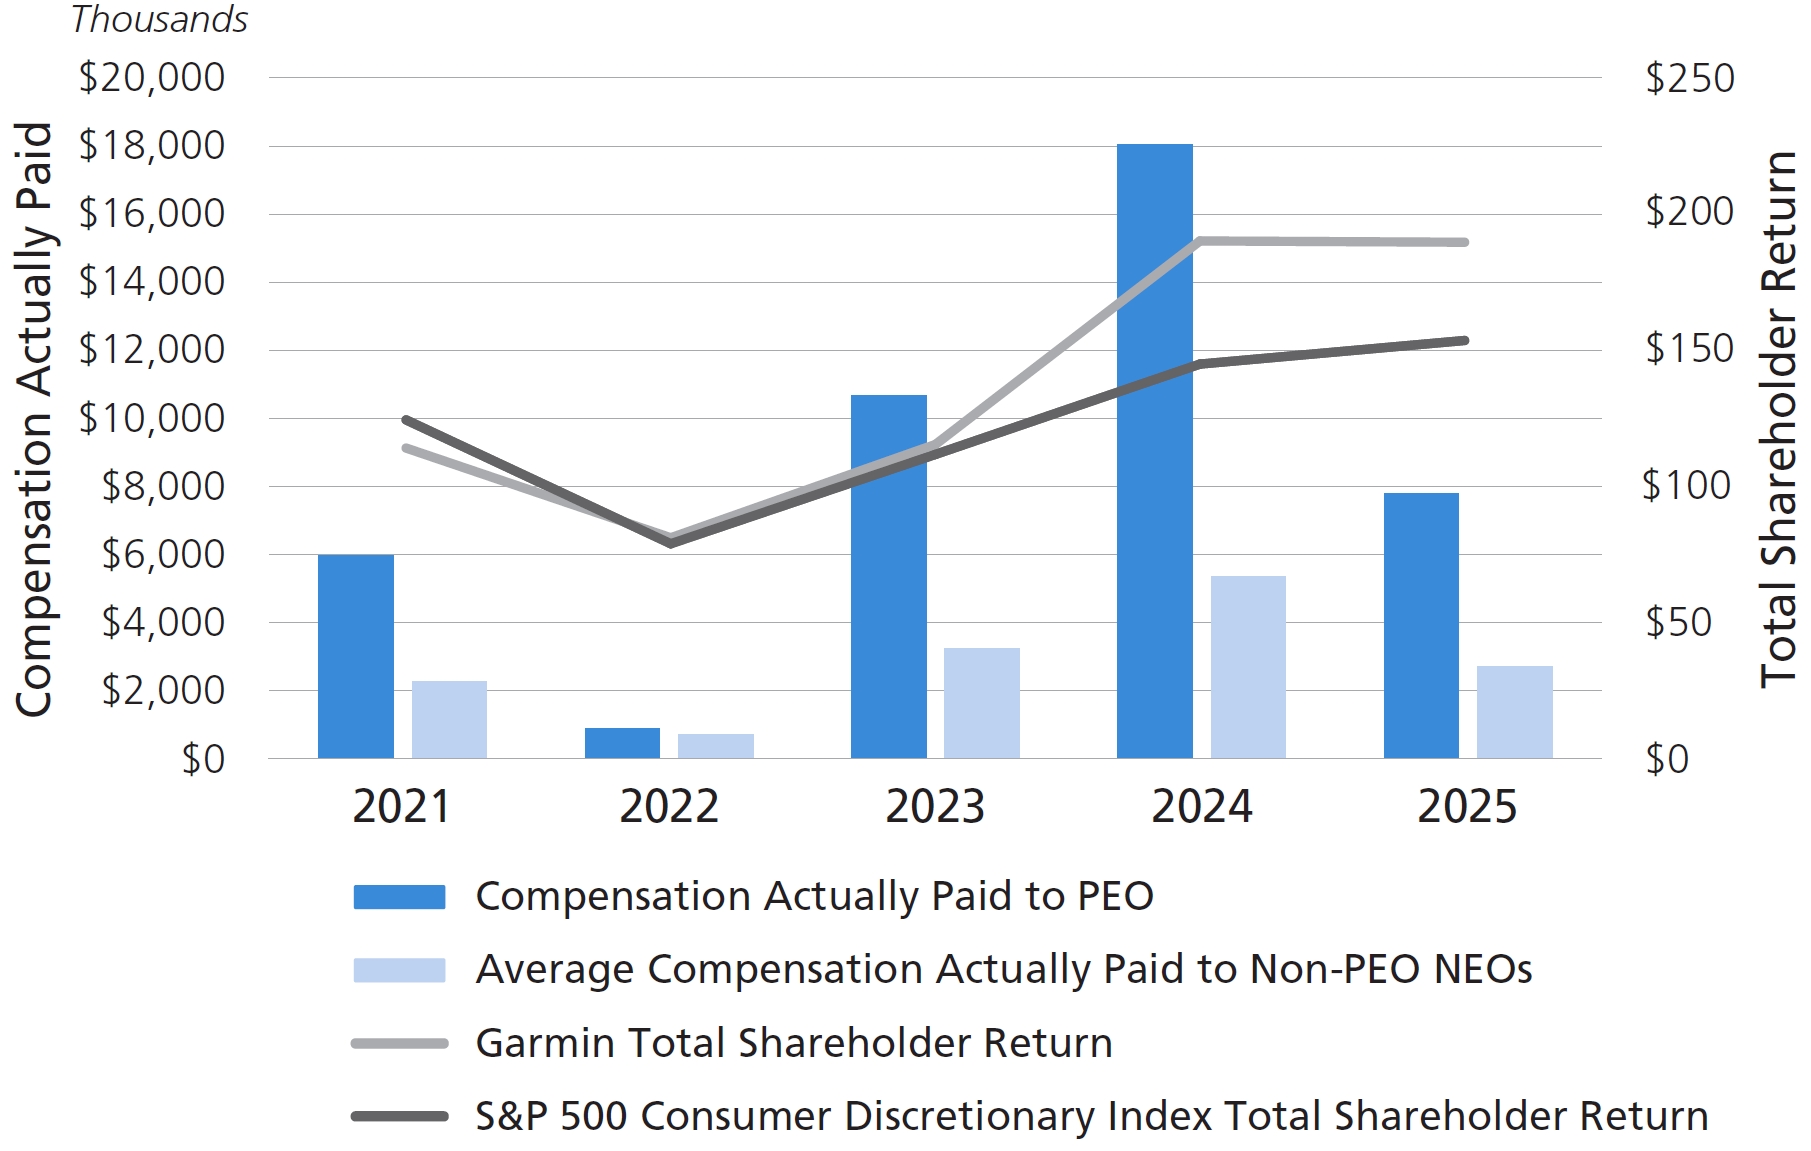
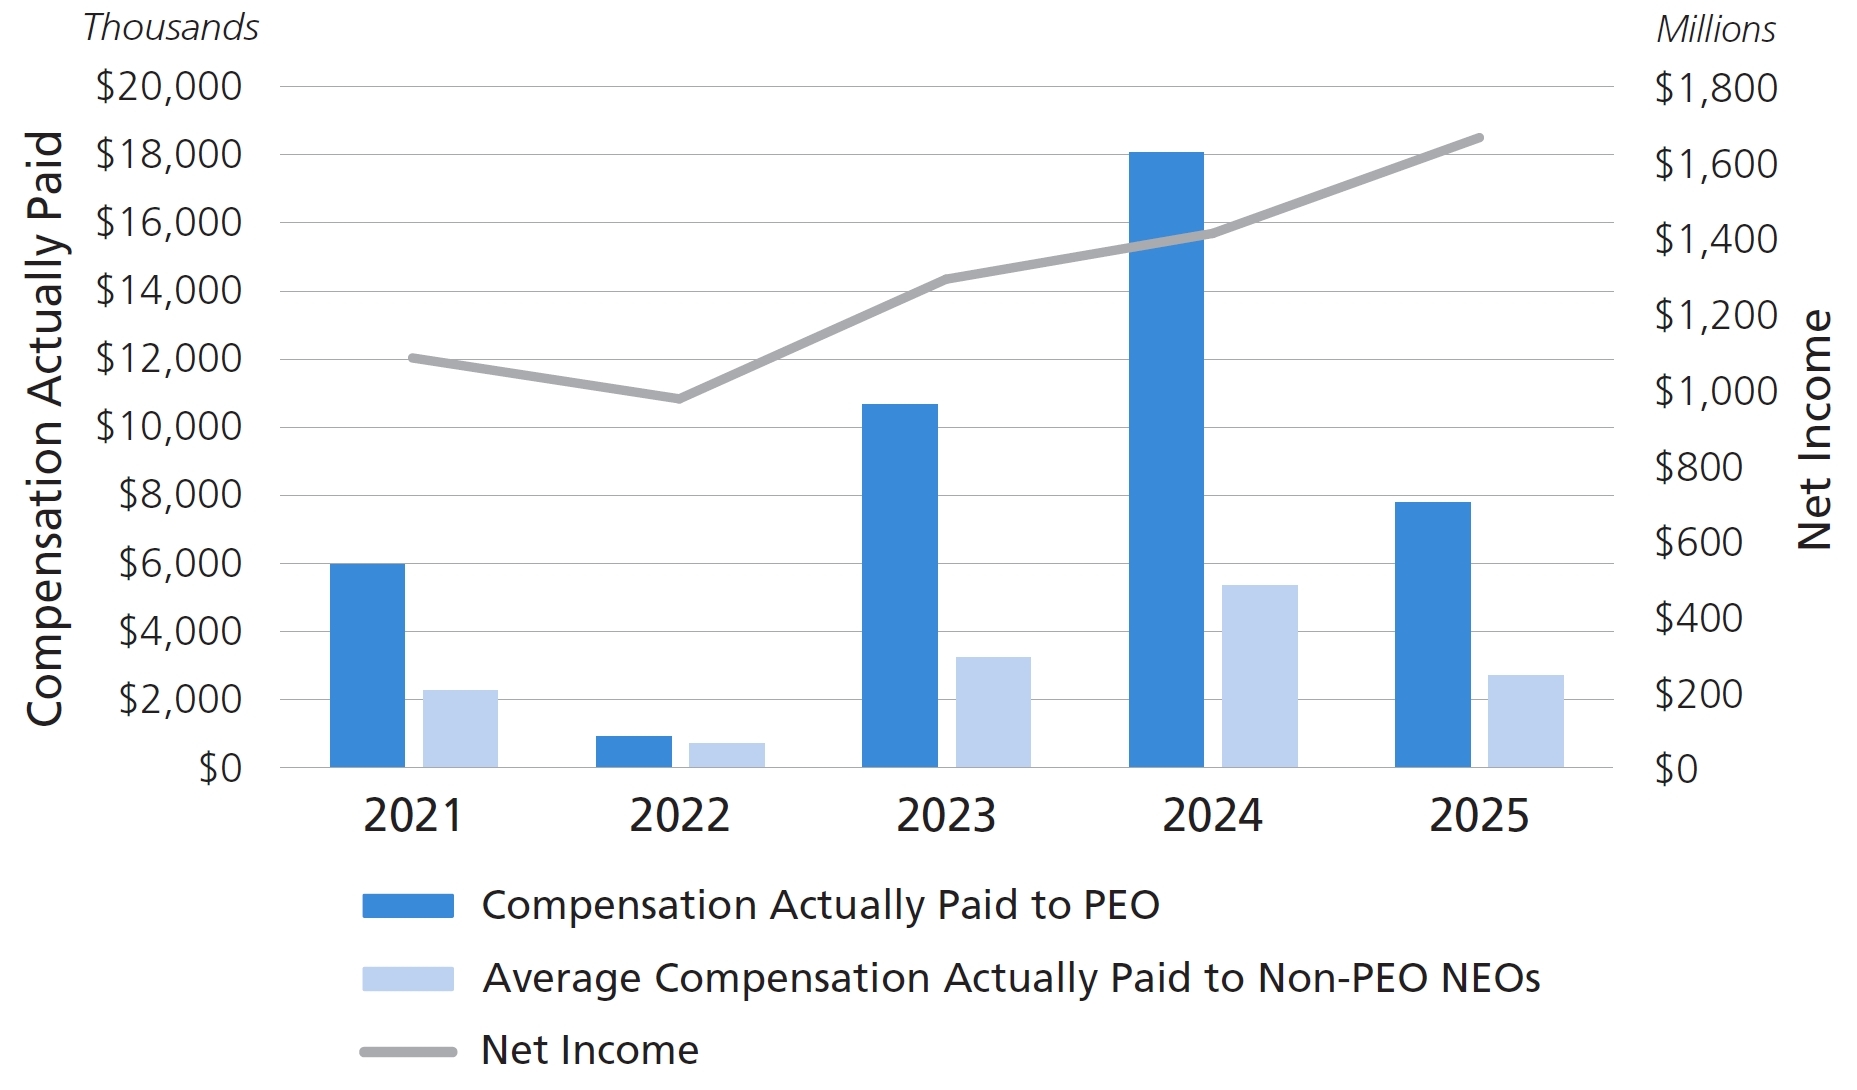
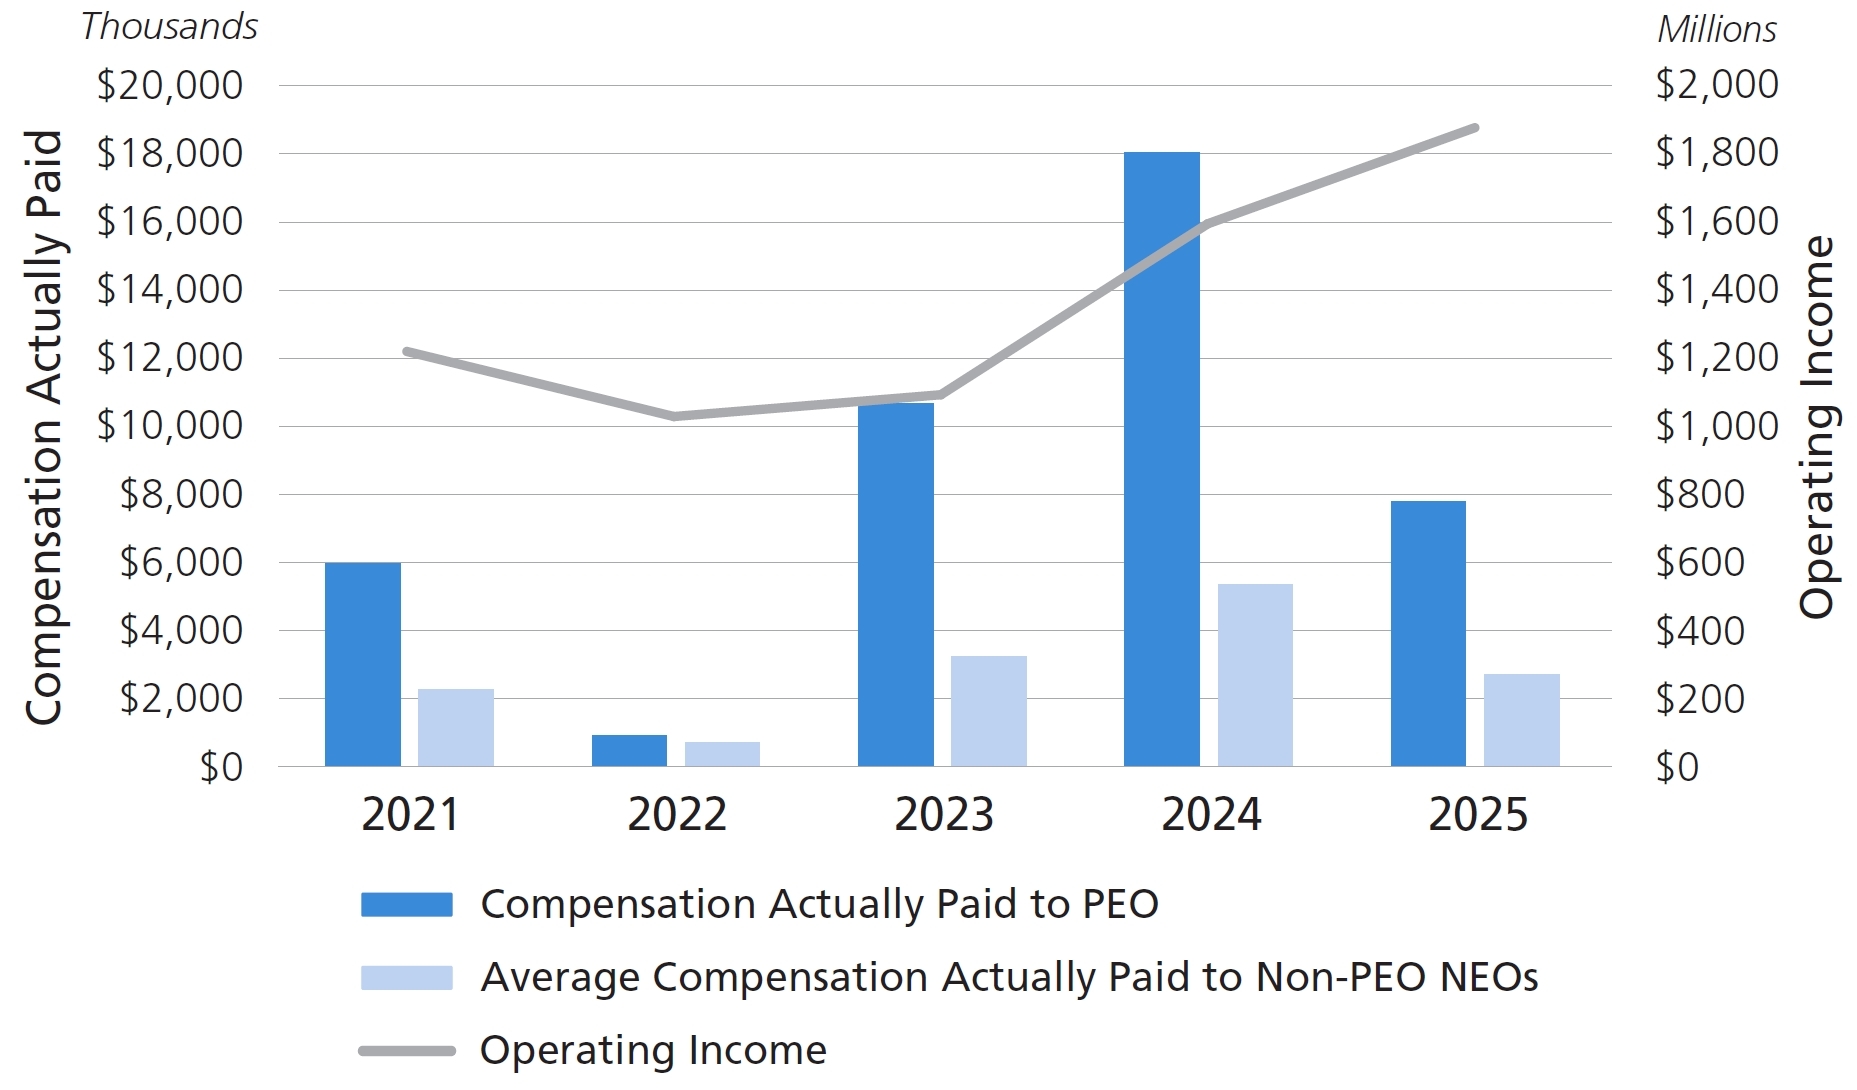
| 2025 | $ | 7,744,354 | $ | 7,788,412 | $ | 2,685,506 | $ | 2,701,048 | $ | 190.56 | $ | 153.99 | $ | 1,663,887,000 | $ | 1,876,076,000 | ||||||||||||||||
| 2024 | $ | 7,240,905 | $ | 18,055,818 | $ | 2,416,106 | $ | 5,343,825 | $ | 191.05 | $ | 145.21 | $ | 1,411,436,000 | $ | 1,593,994,000 | ||||||||||||||||
| 2023 | $ | 6,540,666 | $ | 10,679,153 | $ | 2,113,742 | $ | 3,241,006 | $ | 115.27 | $ | 111.58 | $ | 1,289,636,000 | $ | 1,092,160,000 | ||||||||||||||||
| 2022 | $ | 4,585,595 | $ | 900,886 | $ | 1,888,561 | $ | 698,576 | $ | 80.56 | $ | 78.35 | $ | 973,585,000 | $ | 1,027,845,000 | ||||||||||||||||
| 2021 | $ | 4,238,341 | $ | 5,967,081 | $ | 1,694,354 | $ | 2,271,591 | $ | 113.95 | $ | 124.43 | $ | 1,082,200,000 | $ | 1,218,620,000 | ||||||||||||||||
The PEO for each year was Clifton A. Pemble. For 2025 and 2024, the Non-PEO NEOs were Douglas G. Boessen, Bradley C. Trenkle, Philip I. Straub and Patrick G. Desbois. For 2023 and 2022, the Non-PEO NEOs were Douglas G. Boessen, Andrew R. Etkind, Philip I. Straub and Patrick G. Desbois. For 2021, the Non-PEO NEOs were Min H. Kao, Douglas G. Boessen, Andrew R. Etkind, Philip I. Straub and Patrick G. Desbois.
The peer group for purposes of the table above is the S&P 500 Consumer Discretionary Index.
Operating income, for compensation purposes, is presented from the Company’s audited financial statements without adjustment.
To calculate CAP for our PEO, the following amounts were deducted from and added to Summary Compensation Table (“SCT”) total compensation, as required under Item 402(v) of Regulation S-K:
| Year | SCT Total | Deduction of Reported Value of Equity Awards | Equity Award Adjustments | CAP | |||||||||||
| (i) | (ii) | ||||||||||||||
| 2025 | $ | 7,744,354 | $ | (6,300,085 | ) | $ | 6,344,143 | $ | 7,788,412 | ||||||
| 2024 | $ | 7,240,905 | $ | (5,800,074 | ) | $ | 16,614,987 | $ | 18,055,818 | ||||||
| 2023 | $ | 6,540,666 | $ | (5,150,023 | ) | $ | 9,288,510 | $ | 10,679,153 | ||||||
| 2022 | $ | 4,585,595 | $ | (3,323,452 | ) | $ | (361,257 | ) | $ | 900,886 | |||||
| 2021 | $ | 4,238,341 | $ | (3,003,686 | ) | $ | 4,732,426 | $ | 5,967,081 | ||||||
| (i) | Represents the grant date fair value of equity based awards granted for each year shown, as reported in the SCT. As required under Item 402(v) of Regulation S-K, this value is deducted from SCT total compensation to calculate CAP for each year shown. |
| (ii) | Represents the value of equity award adjustments for each year shown, as calculated in accordance with the methodology required under Item 402(v) of Regulation S-K. The amounts deducted or added in calculating the equity award adjustments are provided in the supplemental table below: |
| Equity Award Adjustments for PEO | 2025 | 2024 | 2023 | 2022 | 2021 | |||||||||||||||
| RSUs: | ||||||||||||||||||||
| Year-End Fair Value of Awards Granted During Year that Remain Unvested as of Year-End | $ | 3,075,252 | $ | 2,893,565 | $ | 2,875,568 | $ | 1,850,599 | $ | 1,663,383 | ||||||||||
| Change in Fair Value (From Prior Year-End to Current Year-End) of Awards Granted Prior to Current Year that Remain Unvested as of Year-End | $ | (64,183 | ) | $ | 1,745,550 | $ | 634,049 | $ | (513,916 | ) | $ | 173,666 | ||||||||
| Change in Fair Value (From Prior Year-End to Vesting Date) of Awards Granted Prior to Current Year that Vested During Year | $ | (39,933 | ) | $ | 1,586,411 | $ | 498,869 | $ | (516,070 | ) | $ | 208,362 | ||||||||
| PC-RSUs: | ||||||||||||||||||||
| Year-End Fair Value of Awards Granted During Year that Remain Unvested as of Year-End | $ | 3,090,048 | $ | 8,166,610 | $ | 4,990,626 | $ | - | $ | 2,352,257 | ||||||||||
| Change in Fair Value (From Prior Year-End to Current Year-End) of Awards Granted Prior to Current Year that Remain Unvested as of Year-End | $ | (149,945 | ) | $ | 2,091,916 | $ | 211,356 | $ | (793,151 | ) | $ | 263,567 | ||||||||
| Change in Fair Value (From Prior Year-End to Vesting Date) of Awards Granted Prior to Current Year that Vested During Year | $ | 432,904 | $ | 130,935 | $ | 78,042 | $ | (388,719 | ) | $ | 71,191 | |||||||||
| TOTAL EQUITY AWARD ADJUSTMENTS FOR PEO | $ | 6,344,143 | $ | 16,614,987 | $ | 9,288,510 | $ | (361,257 | ) | $ | 4,732,426 | |||||||||
To calculate CAP for our Non-PEO NEOs (averaged), the following amounts were deducted from and added to Summary Compensation Table (“SCT”) total compensation, as required under Item 402(v) of Regulation S-K:
| Year | SCT Total | Deduction of Reported Value of Equity Awards | Equity Award Adjustments | CAP | |||||||||||
| (i) | (ii) | ||||||||||||||
| 2025 | $ | 2,685,506 | $ | (1,856,339 | ) | $ | 1,871,882 | $ | 2,701,048 | ||||||
| 2024 | $ | 2,416,106 | $ | (1,618,791 | ) | $ | 4,546,510 | $ | 5,343,825 | ||||||
| 2023 | $ | 2,113,742 | $ | (1,199,958 | ) | $ | 2,327,222 | $ | 3,241,006 | ||||||
| 2022 | $ | 1,888,561 | $ | (1,034,936 | ) | $ | (155,049 | ) | $ | 698,576 | |||||
| 2021 | $ | 1,694,354 | $ | (892,596 | ) | $ | 1,469,833 | $ | 2,271,591 | ||||||
| (i) | Represents the grant date fair value of equity based awards granted for each year shown, as reported in the SCT. As required under Item 402(v) of Regulation S-K, this value is deducted from SCT total compensation to calculate CAP for each year shown. |
| (ii) | Represents the value of equity award adjustments for each year shown, as calculated in accordance with the methodology required under Item 402(v) of Regulation S-K. The amounts deducted or added in calculating the equity award adjustments are provided in the supplemental table below: |
| Equity Award Adjustments for Non-PEO NEOs | 2025 | 2024 | 2023 | 2022 | 2021 | |||||||||||||||
| RSUs: | ||||||||||||||||||||
| Year-End Fair Value of Awards Granted During Year that Remain Unvested as of Year-End | $ | 993,076 | $ | 841,941 | $ | 592,409 | $ | 548,618 | $ | 438,136 | ||||||||||
| Change in Fair Value (From Prior Year-End to Current Year-End) of Awards Granted Prior to Current Year that Remain Unvested as of Year-End | $ | (17,632 | ) | $ | 474,777 | $ | 183,026 | $ | (139,301 | ) | $ | 50,459 | ||||||||
| Change in Fair Value (From Prior Year-End to Vesting Date) of Awards Granted Prior to Current Year that Vested During Year | $ | (11,324 | ) | $ | 438,317 | $ | 142,035 | $ | (145,836 | ) | $ | 63,083 | ||||||||
| PC-RSUs: | ||||||||||||||||||||
| Year-End Fair Value of Awards Granted During Year that Remain Unvested as of Year-End | $ | 831,082 | $ | 2,182,342 | $ | 1,311,231 | $ | - | $ | 790,793 | ||||||||||
| Change in Fair Value (From Prior Year-End to Current Year-End) of Awards Granted Prior to Current Year that Remain Unvested as of Year-End | $ | (40,354 | ) | $ | 570,982 | $ | 71,055 | $ | (275,337 | ) | $ | 99,430 | ||||||||
| Change in Fair Value (From Prior Year-End to Vesting Date) of Awards Granted Prior to Current Year that Vested During Year | $ | 117,034 | $ | 38,151 | $ | 27,466 | $ | (143,193 | ) | $ | 27,932 | |||||||||
| TOTAL EQUITY AWARD ADJUSTMENTS FOR NON-PEO NEOs | $ | 1,871,882 | $ | 4,546,510 | $ | 2,327,222 | $ | (155,049 | ) | $ | 1,469,833 | |||||||||
The PEO for each year was Clifton A. Pemble. For 2025 and 2024, the Non-PEO NEOs were Douglas G. Boessen, Bradley C. Trenkle, Philip I. Straub and Patrick G. Desbois. For 2023 and 2022, the Non-PEO NEOs were Douglas G. Boessen, Andrew R. Etkind, Philip I. Straub and Patrick G. Desbois. For 2021, the Non-PEO NEOs were Min H. Kao, Douglas G. Boessen, Andrew R. Etkind, Philip I. Straub and Patrick G. Desbois.
The peer group for purposes of the table above is the S&P 500 Consumer Discretionary Index.
| Year | SCT Total | Deduction of Reported Value of Equity Awards | Equity Award Adjustments | CAP | |||||||||||
| (i) | (ii) | ||||||||||||||
| 2025 | $ | 7,744,354 | $ | (6,300,085 | ) | $ | 6,344,143 | $ | 7,788,412 | ||||||
| 2024 | $ | 7,240,905 | $ | (5,800,074 | ) | $ | 16,614,987 | $ | 18,055,818 | ||||||
| 2023 | $ | 6,540,666 | $ | (5,150,023 | ) | $ | 9,288,510 | $ | 10,679,153 | ||||||
| 2022 | $ | 4,585,595 | $ | (3,323,452 | ) | $ | (361,257 | ) | $ | 900,886 | |||||
| 2021 | $ | 4,238,341 | $ | (3,003,686 | ) | $ | 4,732,426 | $ | 5,967,081 | ||||||
| (i) | Represents the grant date fair value of equity based awards granted for each year shown, as reported in the SCT. As required under Item 402(v) of Regulation S-K, this value is deducted from SCT total compensation to calculate CAP for each year shown. |
| (ii) | Represents the value of equity award adjustments for each year shown, as calculated in accordance with the methodology required under Item 402(v) of Regulation S-K. The amounts deducted or added in calculating the equity award adjustments are provided in the supplemental table below: |
| Equity Award Adjustments for PEO | 2025 | 2024 | 2023 | 2022 | 2021 | |||||||||||||||
| RSUs: | ||||||||||||||||||||
| Year-End Fair Value of Awards Granted During Year that Remain Unvested as of Year-End | $ | 3,075,252 | $ | 2,893,565 | $ | 2,875,568 | $ | 1,850,599 | $ | 1,663,383 | ||||||||||
| Change in Fair Value (From Prior Year-End to Current Year-End) of Awards Granted Prior to Current Year that Remain Unvested as of Year-End | $ | (64,183 | ) | $ | 1,745,550 | $ | 634,049 | $ | (513,916 | ) | $ | 173,666 | ||||||||
| Change in Fair Value (From Prior Year-End to Vesting Date) of Awards Granted Prior to Current Year that Vested During Year | $ | (39,933 | ) | $ | 1,586,411 | $ | 498,869 | $ | (516,070 | ) | $ | 208,362 | ||||||||
| PC-RSUs: | ||||||||||||||||||||
| Year-End Fair Value of Awards Granted During Year that Remain Unvested as of Year-End | $ | 3,090,048 | $ | 8,166,610 | $ | 4,990,626 | $ | - | $ | 2,352,257 | ||||||||||
| Change in Fair Value (From Prior Year-End to Current Year-End) of Awards Granted Prior to Current Year that Remain Unvested as of Year-End | $ | (149,945 | ) | $ | 2,091,916 | $ | 211,356 | $ | (793,151 | ) | $ | 263,567 | ||||||||
| Change in Fair Value (From Prior Year-End to Vesting Date) of Awards Granted Prior to Current Year that Vested During Year | $ | 432,904 | $ | 130,935 | $ | 78,042 | $ | (388,719 | ) | $ | 71,191 | |||||||||
| TOTAL EQUITY AWARD ADJUSTMENTS FOR PEO | $ | 6,344,143 | $ | 16,614,987 | $ | 9,288,510 | $ | (361,257 | ) | $ | 4,732,426 | |||||||||
| Year | SCT Total | Deduction of Reported Value of Equity Awards | Equity Award Adjustments | CAP | |||||||||||
| (i) | (ii) | ||||||||||||||
| 2025 | $ | 2,685,506 | $ | (1,856,339 | ) | $ | 1,871,882 | $ | 2,701,048 | ||||||
| 2024 | $ | 2,416,106 | $ | (1,618,791 | ) | $ | 4,546,510 | $ | 5,343,825 | ||||||
| 2023 | $ | 2,113,742 | $ | (1,199,958 | ) | $ | 2,327,222 | $ | 3,241,006 | ||||||
| 2022 | $ | 1,888,561 | $ | (1,034,936 | ) | $ | (155,049 | ) | $ | 698,576 | |||||
| 2021 | $ | 1,694,354 | $ | (892,596 | ) | $ | 1,469,833 | $ | 2,271,591 | ||||||
| (i) | Represents the grant date fair value of equity based awards granted for each year shown, as reported in the SCT. As required under Item 402(v) of Regulation S-K, this value is deducted from SCT total compensation to calculate CAP for each year shown. |
| (ii) | Represents the value of equity award adjustments for each year shown, as calculated in accordance with the methodology required under Item 402(v) of Regulation S-K. The amounts deducted or added in calculating the equity award adjustments are provided in the supplemental table below: |
| Equity Award Adjustments for Non-PEO NEOs | 2025 | 2024 | 2023 | 2022 | 2021 | |||||||||||||||
| RSUs: | ||||||||||||||||||||
| Year-End Fair Value of Awards Granted During Year that Remain Unvested as of Year-End | $ | 993,076 | $ | 841,941 | $ | 592,409 | $ | 548,618 | $ | 438,136 | ||||||||||
| Change in Fair Value (From Prior Year-End to Current Year-End) of Awards Granted Prior to Current Year that Remain Unvested as of Year-End | $ | (17,632 | ) | $ | 474,777 | $ | 183,026 | $ | (139,301 | ) | $ | 50,459 | ||||||||
| Change in Fair Value (From Prior Year-End to Vesting Date) of Awards Granted Prior to Current Year that Vested During Year | $ | (11,324 | ) | $ | 438,317 | $ | 142,035 | $ | (145,836 | ) | $ | 63,083 | ||||||||
| PC-RSUs: | ||||||||||||||||||||
| Year-End Fair Value of Awards Granted During Year that Remain Unvested as of Year-End | $ | 831,082 | $ | 2,182,342 | $ | 1,311,231 | $ | - | $ | 790,793 | ||||||||||
| Change in Fair Value (From Prior Year-End to Current Year-End) of Awards Granted Prior to Current Year that Remain Unvested as of Year-End | $ | (40,354 | ) | $ | 570,982 | $ | 71,055 | $ | (275,337 | ) | $ | 99,430 | ||||||||
| Change in Fair Value (From Prior Year-End to Vesting Date) of Awards Granted Prior to Current Year that Vested During Year | $ | 117,034 | $ | 38,151 | $ | 27,466 | $ | (143,193 | ) | $ | 27,932 | |||||||||
| TOTAL EQUITY AWARD ADJUSTMENTS FOR NON-PEO NEOs | $ | 1,871,882 | $ | 4,546,510 | $ | 2,327,222 | $ | (155,049 | ) | $ | 1,469,833 | |||||||||
CAP VS TSR
CAP VS NET INCOME
CAP VS OPERATING INCOME
CAP VS TSR
As required under Item 402(v) of Regulations S-K, in the table below we list the financial performance measures used by the Compensation Committee to link compensation actually paid to the NEOs for 2025 to Garmin’s performance.
| Revenue |
| Operating Income |
| [1] | Represents the grant date fair value of equity based awards granted for each year shown, as reported in the SCT. As required under Item 402(v) of Regulation S-K, this value is deducted from SCT total compensation to calculate CAP for each year shown. |
| [2] | Represents the value of equity award adjustments for each year shown, as calculated in accordance with the methodology required under Item 402(v) of Regulation S-K. The amounts deducted or added in calculating the equity award adjustments are provided in the supplemental table below: |
| [3] | Represents the grant date fair value of equity based awards granted for each year shown, as reported in the SCT. As required under Item 402(v) of Regulation S-K, this value is deducted from SCT total compensation to calculate CAP for each year shown. |
| [4] | Represents the value of equity award adjustments for each year shown, as calculated in accordance with the methodology required under Item 402(v) of Regulation S-K. The amounts deducted or added in calculating the equity award adjustments are provided in the supplemental table below: |