Pay vs Performance Disclosure
Apr. 02, 2023
Dec. 31, 2023
Dec. 31, 2025
USD ($)
Dec. 31, 2024
USD ($)
Dec. 31, 2023
USD ($)
Dec. 31, 2022
USD ($)
Dec. 31, 2021
USD ($)
Pay Versus Performance
As required by SEC rules, we are providing the following information regarding executive pay and performance. Both Summary Compensation Table Total compensation and Compensation Actually Paid are calculated in accordance with SEC rules and may differ substantially from the manner in which the T&C Committee makes decisions regarding executive pay. For a discussion of the T&C Committee’s decisions regarding the pay of our named executive officers, see “Compensation Discussion and Analysis.”
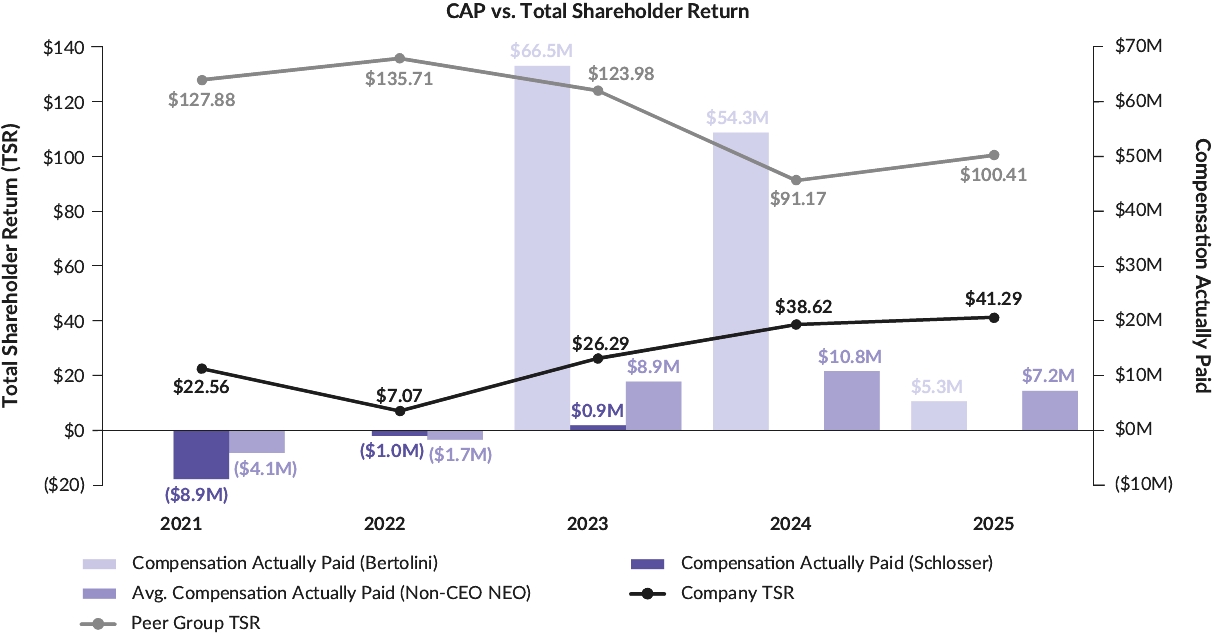
Value of Initial Fixed $100 Investment Based On: | ||||||||||||||||||||||||||||||||
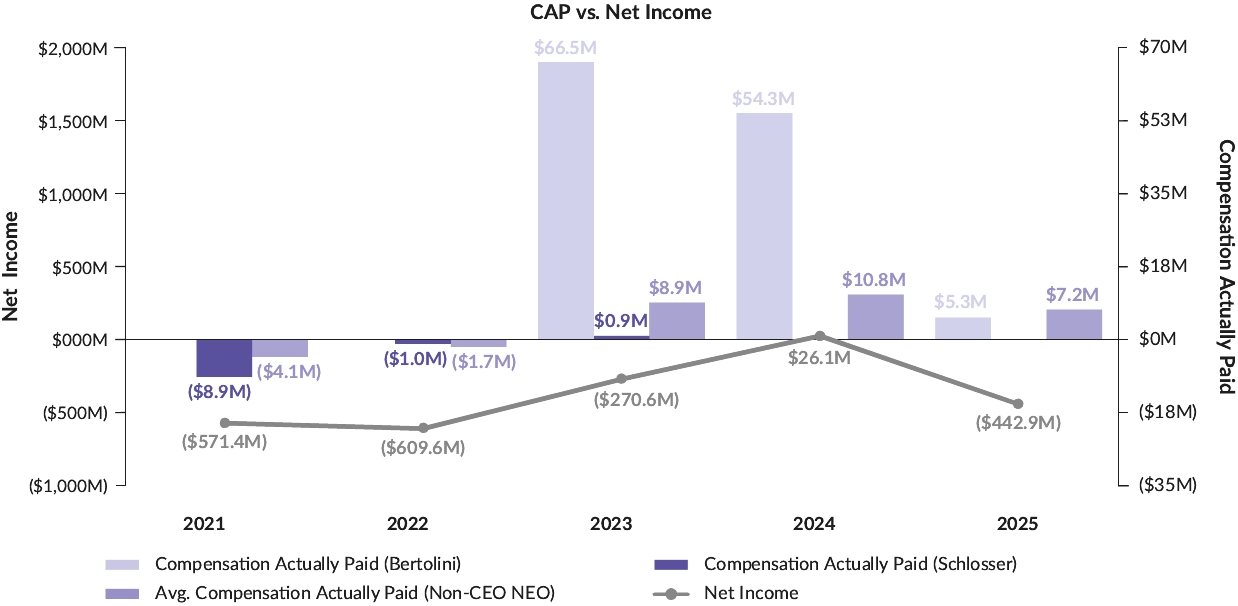
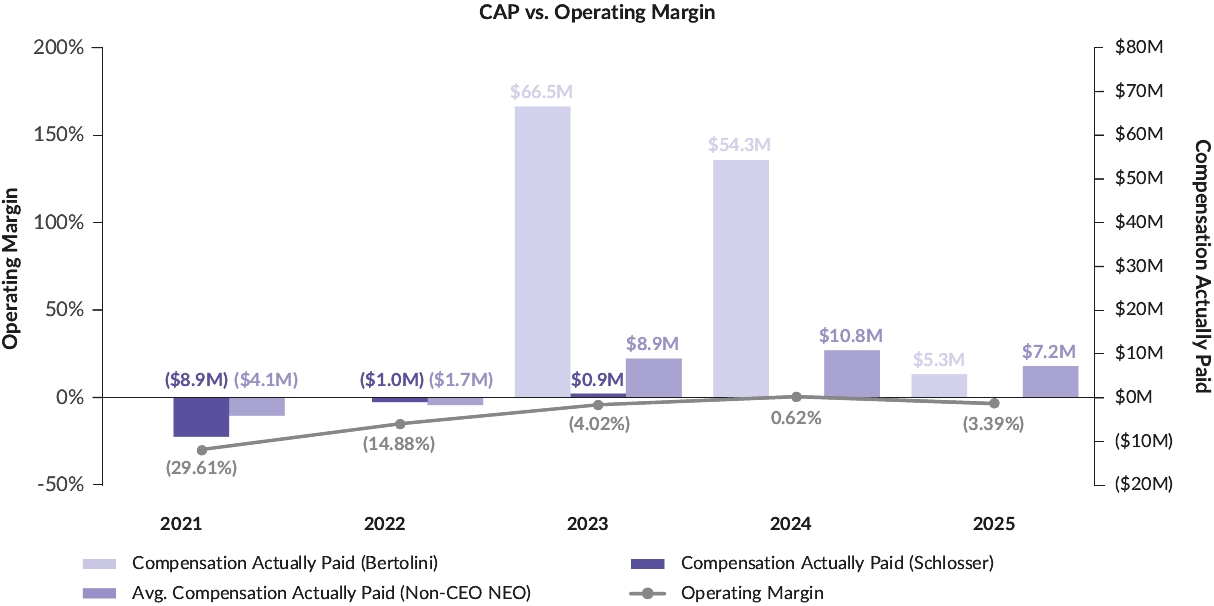
Year | Summary Compensation Table Total for Current CEO(1)(2) | Compensation Actually Paid to Current CEO(1)(3) | Summary Compensation Table Total for Former CEO(1)(2) | Compensation Actually Paid to Former CEO(1) | Average Summary Compensation Table Total for Non-CEO NEOs(1)(2) | Average Compensation Actually Paid to Non-CEO NEOs(1)(3) | TSR(4) | Peer Group TSR(4) | Net Income (Loss) (thousands)(5) | Operating Margin(6) | ||||||||||||||||||||||
2025 | $1,149,308 | $5,330,820 | $— | $— | $7,399,288 | $7,194,235 | $41.29 | $100.41 | $(442,903) | (3.4)% | ||||||||||||||||||||||
2024 | $915,000 | $54,326,168 | $— | $— | $6,228,008 | $10,817,690 | $38.62 | $91.17 | $26,121 | 0.6% | ||||||||||||||||||||||
2023 | $44,538,114 | $66,452,986 | $854,000 | $860,490 | $3,784,404 | $8,899,974 | $26.29 | $123.98 | $(270,594) | (4.0)% | ||||||||||||||||||||||
2022 | $— | $— | $652,405 | $(1,019,097) | $1,090,898 | $(1,696,174) | $7.07 | $135.71 | $(609,552) | (14.9)% | ||||||||||||||||||||||
2021 | $— | $— | $60,814,546 | $(8,865,630) | $10,885,903 | $(4,147,460) | $22.56 | $127.88 | $(571,426) | (29.6)% | ||||||||||||||||||||||
(1) | For 2025, 2024, and 2023 Mr. Bertolini served as current CEO. For 2023, Mr. Schlosser served as former CEO and for 2022 and 2021, Mr. Schlosser served as current CEO. The Non-CEO NEOs were Mr. Schlosser (2025, 2024), Mr. Blackley (2025, 2024, 2023, 2022, 2021), Ms. Liang (2025), Mr. McAnaney (2025), Ranmali Bopitiya (2024, 2023, 2022), Alessandrea Quane (2024, 2023, 2022, 2021), Mr. Sankaran (2023, 2022, 2021), Dennis Weaver (2022), Meghan Joyce (2021) and Mr. Kushner (2021). |
(2) | Amounts reflect Summary Compensation Table Total compensation for our CEO and Non-CEO NEOs for each corresponding year. In 2021, these amounts include the grant date fair value of the Founders Awards granted to Mr. Schlosser and Mr. Kushner in connection with our initial public offering. As previously disclosed, these awards were voluntarily canceled and terminated on March 28, 2023. |
(3) | See table immediately following for adjustments to the Summary Compensation Table Total compensation for our CEO, as well as the average for our Non-CEO NEOs, to determine Compensation Actually Paid (“CAP”). |
(4) | The amounts reflect the cumulative TSR of our common stock and of the 2025 rTSR Peer Group. The cumulative TSR against the 2024 rTSR peer group would be $104.25 (2025), $100.48 (2024), $129.93 (2023), $141.76 (2022) and $131.10 (2021). For more information on the companies in these peer groups, see “rTSR Modifier” above. The TSR value listed in each year reflects what the cumulative value of $100 would be if invested on March 3, 2021 (the date of our initial public offering). TSR is calculated on a cumulative basis by dividing the sum of the cumulative amount of dividends for the measurement period, assuming dividend reinvestment (if any), and the difference between the Company’s share price at the end and the beginning of the measurement period by the Company’s share price at the beginning of the measurement period. |
(5) | The dollar amounts reported represent the net income reflected in the Company’s audited financial statements for the applicable year. |
(6) | While we use numerous financial and non-financial performance measures to evaluate performance under our compensation programs, Operating Margin is the financial performance measure that, in our assessment, represents the most important performance measure (that is not otherwise required to be disclosed in the table) used to link compensation actually paid to NEOs to Company performance, for the most recently completed fiscal year. The amount shown in the table is equal to our Operating Margin as reported in our Annual Report on Form 10-K for the applicable year, which is defined as Earnings (loss) from operations divided by Total revenue. |
The following table details the adjustment to the Summary Compensation Table Total compensation for our CEO, as well as the average for our Non-CEO NEOs, to determine CAP, as computed in accordance with SEC rules. Amounts do not reflect actual compensation earned by or paid to our NEOs during the applicable year.
Year and Individuals | Total Compensation as reported in the Summary Compensation Table (“SCT”) | Less: Grant Date Fair Value of Equity Awards as reported in SCT(1) | Add: Year- End Fair Value of Equity Awards Granted in the Year(2) | Add: Change in Fair Value of Outstanding and Unvested Equity Awards(2) | Add: Fair Value as of Vesting Date of Equity Awards Granted and Vested in the Year(2) | Add: Change in Fair Value as of the Vesting Date of Equity Awards Granted in Prior Fiscal Years that Vested in the Fiscal Year(2) | Add: Fair Value at the End of the Prior Year of Equity Awards that Failed to Meet Vesting Conditions in the Year | Add: Value of Dividends or Other Earnings Paid on Equity Awards Not Otherwise Reflected in Total Compensation | Compensation Actually Paid | ||||||||||||||||||||
CEO | $1,149,308 | $0 | $0 | $4,019,067 | $0 | $162,445 | $0 | $0 | $5,330,820 | ||||||||||||||||||||
Non-CEO NEOs | $7,399,288 | $5,560,344 | $4,440,090 | $176,541 | $565,979 | $172,681 | $0 | $0 | $7,194,235 | ||||||||||||||||||||
(1) | The amounts reflect the aggregate grant date fair value reported in the “Stock Awards” and “Option Awards” columns in the Summary Compensation Table for the applicable year. |
(2) | The fair values of unvested and outstanding equity awards to our NEOs were re-measured as of the end of each fiscal year, and as of each vesting date, during the years displayed in the table above. Fair values as of each measurement date were determined using valuation assumptions and methodologies (including volatility, dividend yield, and risk-free interest rates) that are generally consistent with those used to estimate fair value at grant in accordance with ASC Topic 718. For stock options, the grant date fair values were estimated using Black-Scholes. Subsequent valuations at the end of each fiscal year and as of each vest date are performed using a lattice model, as the latter provides a better estimate of options that are no longer at-the-money. For market-based performance restricted stock units, fair values were estimated using a Monte Carlo simulation model, using inputs that are consistent with those used at grant. For other performance-based awards, the fair values reflect the probable outcome of the performance vesting conditions as of each measurement date. See Note 10 to the consolidated financial statements included in the Company’s Annual Report on Form 10-K for the fiscal year ended December 31, 2025, where we explain assumptions made in valuing equity awards at grant. |
(1) | For 2025, 2024, and 2023 Mr. Bertolini served as current CEO. For 2023, Mr. Schlosser served as former CEO and for 2022 and 2021, Mr. Schlosser served as current CEO. The Non-CEO NEOs were Mr. Schlosser (2025, 2024), Mr. Blackley (2025, 2024, 2023, 2022, 2021), Ms. Liang (2025), Mr. McAnaney (2025), Ranmali Bopitiya (2024, 2023, 2022), Alessandrea Quane (2024, 2023, 2022, 2021), Mr. Sankaran (2023, 2022, 2021), Dennis Weaver (2022), Meghan Joyce (2021) and Mr. Kushner (2021). |
(4) | The amounts reflect the cumulative TSR of our common stock and of the 2025 rTSR Peer Group. The cumulative TSR against the 2024 rTSR peer group would be $104.25 (2025), $100.48 (2024), $129.93 (2023), $141.76 (2022) and $131.10 (2021). For more information on the companies in these peer groups, see “rTSR Modifier” above. The TSR value listed in each year reflects what the cumulative value of $100 would be if invested on March 3, 2021 (the date of our initial public offering). TSR is calculated on a cumulative basis by dividing the sum of the cumulative amount of dividends for the measurement period, assuming dividend reinvestment (if any), and the difference between the Company’s share price at the end and the beginning of the measurement period by the Company’s share price at the beginning of the measurement period. |
(3) | See table immediately following for adjustments to the Summary Compensation Table Total compensation for our CEO, as well as the average for our Non-CEO NEOs, to determine Compensation Actually Paid (“CAP”). |
The following table details the adjustment to the Summary Compensation Table Total compensation for our CEO, as well as the average for our Non-CEO NEOs, to determine CAP, as computed in accordance with SEC rules. Amounts do not reflect actual compensation earned by or paid to our NEOs during the applicable year.
Year and Individuals | Total Compensation as reported in the Summary Compensation Table (“SCT”) | Less: Grant Date Fair Value of Equity Awards as reported in SCT(1) | Add: Year- End Fair Value of Equity Awards Granted in the Year(2) | Add: Change in Fair Value of Outstanding and Unvested Equity Awards(2) | Add: Fair Value as of Vesting Date of Equity Awards Granted and Vested in the Year(2) | Add: Change in Fair Value as of the Vesting Date of Equity Awards Granted in Prior Fiscal Years that Vested in the Fiscal Year(2) | Add: Fair Value at the End of the Prior Year of Equity Awards that Failed to Meet Vesting Conditions in the Year | Add: Value of Dividends or Other Earnings Paid on Equity Awards Not Otherwise Reflected in Total Compensation | Compensation Actually Paid | ||||||||||||||||||||
CEO | $1,149,308 | $0 | $0 | $4,019,067 | $0 | $162,445 | $0 | $0 | $5,330,820 | ||||||||||||||||||||
Non-CEO NEOs | $7,399,288 | $5,560,344 | $4,440,090 | $176,541 | $565,979 | $172,681 | $0 | $0 | $7,194,235 | ||||||||||||||||||||
(1) | The amounts reflect the aggregate grant date fair value reported in the “Stock Awards” and “Option Awards” columns in the Summary Compensation Table for the applicable year. |
(2) | The fair values of unvested and outstanding equity awards to our NEOs were re-measured as of the end of each fiscal year, and as of each vesting date, during the years displayed in the table above. Fair values as of each measurement date were determined using valuation assumptions and methodologies (including volatility, dividend yield, and risk-free interest rates) that are generally consistent with those used to estimate fair value at grant in accordance with ASC Topic 718. For stock options, the grant date fair values were estimated using Black-Scholes. Subsequent valuations at the end of each fiscal year and as of each vest date are performed using a lattice model, as the latter provides a better estimate of options that are no longer at-the-money. For market-based performance restricted stock units, fair values were estimated using a Monte Carlo simulation model, using inputs that are consistent with those used at grant. For other performance-based awards, the fair values reflect the probable outcome of the performance vesting conditions as of each measurement date. See Note 10 to the consolidated financial statements included in the Company’s Annual Report on Form 10-K for the fiscal year ended December 31, 2025, where we explain assumptions made in valuing equity awards at grant. |
(2) | The fair values of unvested and outstanding equity awards to our NEOs were re-measured as of the end of each fiscal year, and as of each vesting date, during the years displayed in the table above. Fair values as of each measurement date were determined using valuation assumptions and methodologies (including volatility, dividend yield, and risk-free interest rates) that are generally consistent with those used to estimate fair value at grant in accordance with ASC Topic 718. For stock options, the grant date fair values were estimated using Black-Scholes. Subsequent valuations at the end of each fiscal year and as of each vest date are performed using a lattice model, as the latter provides a better estimate of options that are no longer at-the-money. For market-based performance restricted stock units, fair values were estimated using a Monte Carlo simulation model, using inputs that are consistent with those used at grant. For other performance-based awards, the fair values reflect the probable outcome of the performance vesting conditions as of each measurement date. See Note 10 to the consolidated financial statements included in the Company’s Annual Report on Form 10-K for the fiscal year ended December 31, 2025, where we explain assumptions made in valuing equity awards at grant. |
Tabular List of Financial Performance Metrics
We believe the following performance measures represent the most important financial performance measures used by us to link compensation actually paid to our NEOs for the fiscal year ended December 31, 2025:
• | Operating Margin |
• | Adjusted EBIT(1) |
• | Direct & Assumed Premiums(1) |
• | Relative TSR |
• | Direct SG&A Ratio(1) |
• | Stock Price Performance |
(1) | Direct & Assumed Premiums, Direct SG&A Ratio and Adjusted EBIT are financial measures that are not prepared in accordance with GAAP. Appendix A to this Proxy Statement defines these and other non-GAAP financial measures and reconciles them to the most directly comparable historical GAAP financial measures, where applicable. |
For additional details regarding our most important financial performance measures, please see “Compensation Discussion and Analysis” in this Proxy Statement.
(1) | Direct & Assumed Premiums, Direct SG&A Ratio and Adjusted EBIT are financial measures that are not prepared in accordance with GAAP. Appendix A to this Proxy Statement defines these and other non-GAAP financial measures and reconciles them to the most directly comparable historical GAAP financial measures, where applicable. |
(1) | Direct & Assumed Premiums, Direct SG&A Ratio and Adjusted EBIT are financial measures that are not prepared in accordance with GAAP. Appendix A to this Proxy Statement defines these and other non-GAAP financial measures and reconciles them to the most directly comparable historical GAAP financial measures, where applicable. |
(1) | Direct & Assumed Premiums, Direct SG&A Ratio and Adjusted EBIT are financial measures that are not prepared in accordance with GAAP. Appendix A to this Proxy Statement defines these and other non-GAAP financial measures and reconciles them to the most directly comparable historical GAAP financial measures, where applicable. |