Pay vs Performance Disclosure - USD ($)
Dec. 31, 2022
Dec. 31, 2025
Jun. 16, 2025
Aug. 31, 2022
Dec. 31, 2025
Dec. 31, 2024
Dec. 31, 2023
Dec. 31, 2022
Dec. 31, 2021
Pay vs. Performance
As required by Item 402(v) of Regulation S-K, we are providing the following information about the relationship between executive compensation actually paid and certain financial performance measures of the Company. In accordance with applicable SEC rules, the adjustments described and quantified below were made to the values reported in the Summary Compensation table for each applicable year to determine the “actual” compensation paid to our Principal Executive Officers (“PEOs”) and the average “actual” compensation paid to our other Named Executive Officers (or “NEOs”). For further information concerning the Company’s variable pay-for-performance philosophy and how the Company aligns executive compensation with the Company’s performance, refer to “Executive Compensation – Compensation Discussion and Analysis.”
The following table summarizes compensation values reported in the Summary Compensation Table for our PEO and the average for our other NEOs, as compared to “compensation actually paid” or “CAP” and the Company’s financial performance for the years ended December 31, 2025, 2024, 2023, 2022, and 2021:
Year | Summary Compensation Table Total for Joshua Bixby(1) | Compensation Actually Paid to Joshua Bixby(1)(2) | Summary Compensation Table Total for PEO (Todd Nightingale)(1) | Compensation Actually Paid to Todd Nightingale(1)(2) | Summary Compensation Table Total for PEO (Charles Compton)(1) | Compensation Actually Paid to Charles Compton(1)(2) | Average Summary Compensation Table Total for Non-PEO NEOs(3) | Average Compensation Actually Paid to Non-PEO NEOs(3)(4) | Value of Initial Fixed $100 Investment Based On: | Net Loss (millions) | Revenue (millions)(6) | |||||||||||||||||||||||||||
Total Stockholder Return | Peer Group Total Stockholder Return(5) | |||||||||||||||||||||||||||||||||||||
(a) | (b) | (c) | (b) | (c) | (b) | (c) | (d) | (e) | (f) | (g) | (h) | (i) | ||||||||||||||||||||||||||
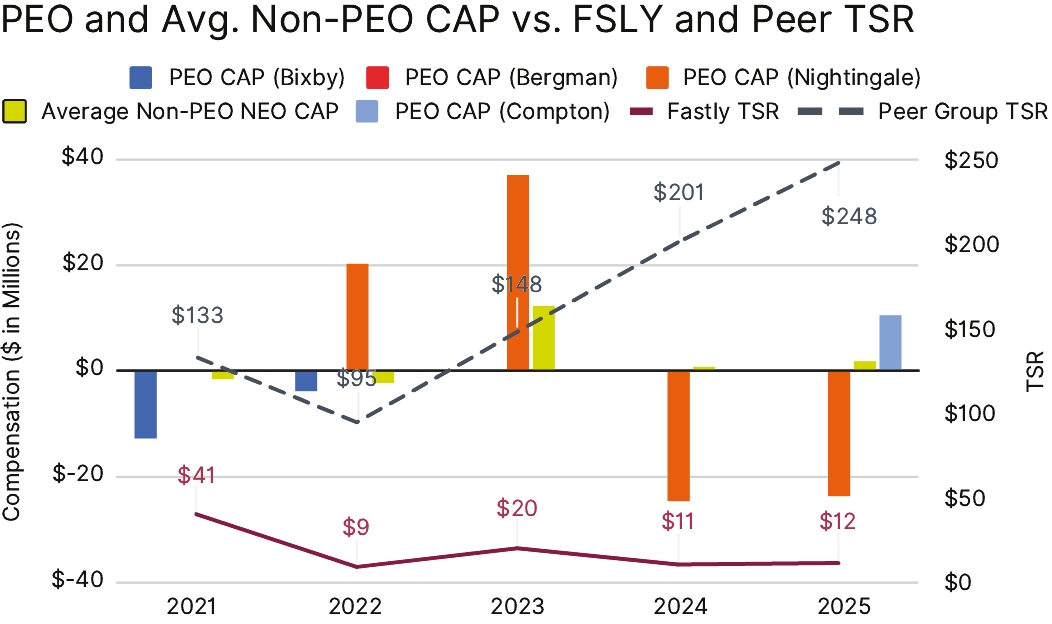
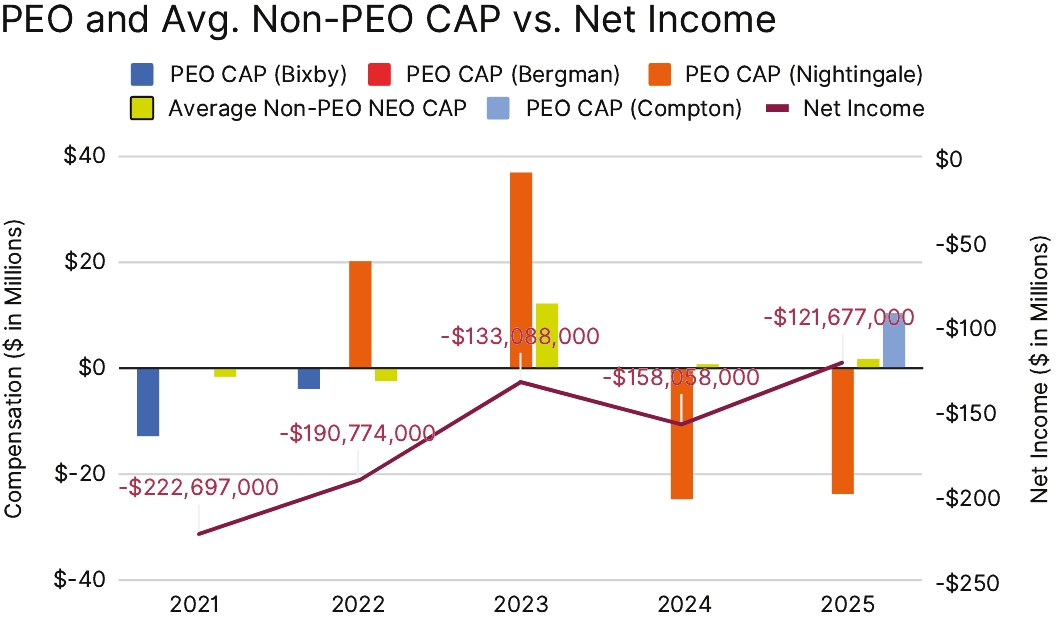
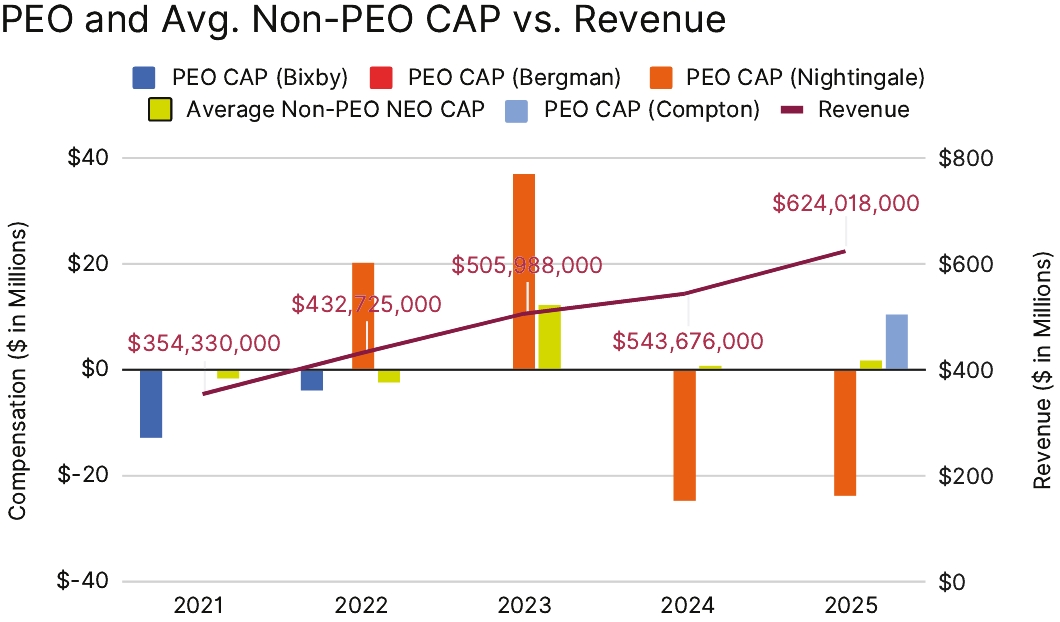
2025 | — | — | $6,372,684 | $(23,137,805) | $6,798,332 | $10,457,248 | $5,790,848 | $1,793,705 | $11.65 | $248.07 | $(121.7) | $624.0 | ||||||||||||||||||||||||||
2024 | — | — | $7,464,594 | $(24,691,973) | — | — | $5,678,680 | $726,959 | $10.80 | $201.18 | $(158.1) | $543.7 | ||||||||||||||||||||||||||
2023 | — | — | $10,165,468 | $36,942,933 | — | — | $6,867,702 | $12,229,373 | $20.37 | $148.26 | $(133.1) | $506.0 | ||||||||||||||||||||||||||
2022 | $9,199,127 | $(3,892,017) | $21,857,756 | $20,179,714 | — | — | $4,066,505 | $(2,381,573) | $9.37 | $94.80 | $(190.8) | $432.7 | ||||||||||||||||||||||||||
2021 | $10,151,111 | $(12,802,716) | — | — | — | — | $7,088,904 | $(1,602,130) | $40.57 | $133.35 | $(222.7) | $354.3 | ||||||||||||||||||||||||||
(1) | The dollar amounts reported in columns (b) are the amounts reported for Messrs. Bergman, Bixby, Nightingale, and Compton, respectively, for each corresponding year in the “Total” column of the Summary Compensation Table. Mr. Bixby served as our Chief Executive Officer effective February 19, 2020 through August 31, 2022. Mr. Nightingale served as our Chief Executive Officer effective September 1, 2022 through June 16, 2025. Mr. Compton has served as our Chief Executive Officer since June 16, 2025. The following individuals served as our PEOs for the following years: |
2025: Todd Nightingale, Charles Compton
2024: Todd Nightingale
2023: Todd Nightingale
2022: Joshua Bixby, Todd Nightingale
2021: Joshua Bixby
(2) | The dollar amounts reported in column (c) for fiscal year 2025 represent the amount of CAP for Messrs. Nightingale and Compton, respectively as computed in accordance with Item 402(v) of Regulation S-K. The dollar amounts do not reflect the actual amount of compensation earned by or paid during the applicable year. The Company deducted from and added to the Summary Compensation Table total compensation the following amounts to calculate compensation actually paid in accordance with Item 402(v) of Regulation S-K as disclosed in columns (c) and (e) for our PEO and Non-PEO NEOs in fiscal year 2025. As the Company’s NEOs do not participate in any defined benefit plans, no adjustments were required to amounts reported in the Summary Compensation Table totals related to the value of benefits under such plans. There are no material differences between the assumptions used to compute the valuation of the equity awards for calculating the compensation actually paid from the assumptions used to compute the valuation of such equity awards as of the grant date. |
2025 | |||||||||||
Todd Nightingale | Charles Compton | Average Non-PEO NEOs | |||||||||
Total Compensation from Summary Compensation Table | $6,372,684 | $6,798,332 | $5,790,848 | ||||||||
Adjustments for Equity Awards | |||||||||||
Grant date values in the Summary Compensation Table | -$6,070,684 | -$6,313,831 | -$5,109,690 | ||||||||
Year-end fair value of unvested awards granted in the current year | $0 | $9,288,674 | $7,044,387 | ||||||||
Year-over-year difference of year-end fair values for unvested awards granted in prior years | $0 | $82,491 | $79,100 | ||||||||
Fair values at vest date for awards granted and vested in current year | $387,094 | $773,249 | $516,583 | ||||||||
2025 | |||||||||||
Todd Nightingale | Charles Compton | Average Non-PEO NEOs | |||||||||
Difference in fair values between prior year-end fair values and vest date fair values for awards granted in prior years | -$437,562 | -$171,667 | -$376,022 | ||||||||
Forfeitures during current year equal to prior year-end fair value | -$23,389,338 | $0 | -$6,151,501 | ||||||||
Dividends or dividend equivalents not otherwise included in the total compensation | $0 | $0 | $0 | ||||||||
Total Adjustments for Equity Awards | -$23,439,805 | $9,972,747 | $1,112,547 | ||||||||
Compensation Actually Paid (as calculated) | -$23,137,805 | $10,457,248 | $1,793,705 | ||||||||
(3) | The dollar amounts reported in column (d) represent the average of the amounts reported for the Company’s NEOs as a group (excluding our PEOs) in the “Total” column of the Summary Compensation Table Total in each applicable year. The following individuals were our Non-PEO NEOs in the respective years: |
2025: Artur Bergman, Ronald Kisling, Scott Lovett, Richard Wong
2024: Artur Bergman, Ronald Kisling, and Scott Lovett
2023: Artur Bergman, Ronald Kisling, and Brett Shirk
2022: Artur Bergman, Ronald Kisling, Paul Luongo, and Brett Shirk
2021: Artur Bergman, Adriel Lares, Ronald Kisling, Paul Luongo, and Brett Shirk
(4) | The dollar amounts reported in column (e) represent the average amount of CAP to the non-PEO NEOs as a group, as computed in accordance with Item 402(v) of Regulation S-K. The dollar amounts do not reflect the actual average amount of compensation earned by or paid to the Non-PEO NEOs as a group during the applicable year. In accordance with the requirements of Item 402(v) of Regulation S-K, adjustments were made to average total reported compensation for the Non-PEO NEOs as a group for each year to determine the CAP, using the methodology described above in Note 2. |
(5) | The peer group is the following published industry index: S&P 500 Information Technology Index. |
(6) | While the Company uses numerous financial and non-financial performance measures for the purpose of evaluating performance for the Company’s compensation programs, the Company has determined that Revenue is the financial performance measure that, in the Company’s assessment, represents the most important performance measure (that is not otherwise required to be disclosed in the table) used by the Company to link compensation actually paid to the Company’s NEOs, for the most recently completed fiscal year, to Company performance. |
(1) | The dollar amounts reported in columns (b) are the amounts reported for Messrs. Bergman, Bixby, Nightingale, and Compton, respectively, for each corresponding year in the “Total” column of the Summary Compensation Table. Mr. Bixby served as our Chief Executive Officer effective February 19, 2020 through August 31, 2022. Mr. Nightingale served as our Chief Executive Officer effective September 1, 2022 through June 16, 2025. Mr. Compton has served as our Chief Executive Officer since June 16, 2025. The following individuals served as our PEOs for the following years: |
2025: Todd Nightingale, Charles Compton
2024: Todd Nightingale
2023: Todd Nightingale
2022: Joshua Bixby, Todd Nightingale
2021: Joshua Bixby
(3) | The dollar amounts reported in column (d) represent the average of the amounts reported for the Company’s NEOs as a group (excluding our PEOs) in the “Total” column of the Summary Compensation Table Total in each applicable year. The following individuals were our Non-PEO NEOs in the respective years: |
2025: Artur Bergman, Ronald Kisling, Scott Lovett, Richard Wong
2024: Artur Bergman, Ronald Kisling, and Scott Lovett
2023: Artur Bergman, Ronald Kisling, and Brett Shirk
2022: Artur Bergman, Ronald Kisling, Paul Luongo, and Brett Shirk
2021: Artur Bergman, Adriel Lares, Ronald Kisling, Paul Luongo, and Brett Shirk
(5) | The peer group is the following published industry index: S&P 500 Information Technology Index. |
(2) | The dollar amounts reported in column (c) for fiscal year 2025 represent the amount of CAP for Messrs. Nightingale and Compton, respectively as computed in accordance with Item 402(v) of Regulation S-K. The dollar amounts do not reflect the actual amount of compensation earned by or paid during the applicable year. The Company deducted from and added to the Summary Compensation Table total compensation the following amounts to calculate compensation actually paid in accordance with Item 402(v) of Regulation S-K as disclosed in columns (c) and (e) for our PEO and Non-PEO NEOs in fiscal year 2025. As the Company’s NEOs do not participate in any defined benefit plans, no adjustments were required to amounts reported in the Summary Compensation Table totals related to the value of benefits under such plans. There are no material differences between the assumptions used to compute the valuation of the equity awards for calculating the compensation actually paid from the assumptions used to compute the valuation of such equity awards as of the grant date. |
2025 | |||||||||||
Todd Nightingale | Charles Compton | Average Non-PEO NEOs | |||||||||
Total Compensation from Summary Compensation Table | $6,372,684 | $6,798,332 | $5,790,848 | ||||||||
Adjustments for Equity Awards | |||||||||||
Grant date values in the Summary Compensation Table | -$6,070,684 | -$6,313,831 | -$5,109,690 | ||||||||
Year-end fair value of unvested awards granted in the current year | $0 | $9,288,674 | $7,044,387 | ||||||||
Year-over-year difference of year-end fair values for unvested awards granted in prior years | $0 | $82,491 | $79,100 | ||||||||
Fair values at vest date for awards granted and vested in current year | $387,094 | $773,249 | $516,583 | ||||||||
2025 | |||||||||||
Todd Nightingale | Charles Compton | Average Non-PEO NEOs | |||||||||
Difference in fair values between prior year-end fair values and vest date fair values for awards granted in prior years | -$437,562 | -$171,667 | -$376,022 | ||||||||
Forfeitures during current year equal to prior year-end fair value | -$23,389,338 | $0 | -$6,151,501 | ||||||||
Dividends or dividend equivalents not otherwise included in the total compensation | $0 | $0 | $0 | ||||||||
Total Adjustments for Equity Awards | -$23,439,805 | $9,972,747 | $1,112,547 | ||||||||
Compensation Actually Paid (as calculated) | -$23,137,805 | $10,457,248 | $1,793,705 | ||||||||
CAP and Cumulative TSR / Cumulative TSR of the Peer Group
CAP and Net Income
CAP and Revenue
CAP and Cumulative TSR / Cumulative TSR of the Peer Group
Tabular List for 2025 Fiscal Year
As described in greater detail in “Executive Compensation – Compensation Discussion and Analysis,” the Company’s executive compensation program reflects a variable pay-for-performance philosophy. The metrics that the Company uses for both our long-term and short-term incentive awards are selected based on an objective of incentivizing our NEOs to increase the value of our enterprise for our stockholders. The two financial performance measures used by the Company to link executive compensation actually paid to the Company’s NEOs, for the most recently completed fiscal year, to the Company’s performance are as follows:
• | Revenue |
• | Non-GAAP Operating Loss(1) |
(1) | Please refer to Appendix A of this Proxy Statement for a reconciliation of non-GAAP financial measures to their corresponding U.S. GAAP measures. |
(1) | Please refer to Appendix A of this Proxy Statement for a reconciliation of non-GAAP financial measures to their corresponding U.S. GAAP measures. |