Pay Versus Performance
The below table and related disclosure is provided in compliance with Item 402(v) of Regulation S-K (the “PvP disclosure rules”), which presents for the previous five fiscal years: (i) the total and average total compensation set forth in the Summary Compensation Table (“SCT”) for the Chief Executive Officer and the named executive officers as a group (excluding the Chief Executive Officer), respectively; (ii) the total and average total “compensation actually paid” (as determined in accordance with the PvP disclosure rules) for the Chief Executive Officer (“Compensation Actually Paid to PEO”) and the named executive officers as a group (excluding the Chief Executive Officer) (“Average Summary Compensation Actually Paid to Non-PEO NEOs”), respectively; (iii) the Company’s cumulative Total Shareholder Return (“Cumulative TSR”) and the cumulative TSR (“Peer Group Cumulative TSR”) of our Item 402(v) peer group (“PvP Peer Group”); (iv) Net Income; and (v) Adjusted EBITDA.
|
Value of Initial Fixed $100 Investment Based on: |
||||||||||||||||||||||||||||||||||||||||
|
Year |
Summary Compensation on Table Total for Mr Woroch(1) |
Summary Compensation on Table Total for Mr Noss(1) |
Compensation Actually Paid to Mr Woroch(1)(2) |
Compensation Actually Paid to Mr Noss(1)(2) |
Average Summary Compensation on Table Total for Non- PEO NEOs(3) |
Average Summary Compensation Actually Paid to Non- PEO NEOs(2) |
Total Shareholder Return |
Peer Group Total Shareholder Return(4) |
Net Income (In Thousands) |
Total Adjusted EBITDA (In Thousands)(5) |
||||||||||||||||||||||||||||||
|
(a) |
(b) |
(c) |
(c) |
(d) |
(e) |
(f) |
(g) |
(h) |
(i) |
|||||||||||||||||||||||||||||||
|
2025 |
$ | 785,251 | $ | 3,141,452 | $ | 886,830 | $ | 3,082,161 | $ | 647,128 | $ | 606,040 | $ | 30 | $ | 138 | $ | (75,819 | ) | $ | 50,598 | |||||||||||||||||||
|
2024 |
- | 975,733 | 506,637 | 670,289 | 561,620 | 28 | 158 | (109,860 | ) | 34,917 | ||||||||||||||||||||||||||||||
|
2023 |
- | 1,138,720 | 2,054,067 | 640,572 | 999,061 | 44 | 119 | (96,197 | ) | 15,451 | ||||||||||||||||||||||||||||||
|
2022 |
- | 1,306,202 | 967,399 | 1,273,460 | 1,150,132 | 55 | 82 | (27,571 | ) | 37,590 | ||||||||||||||||||||||||||||||
|
2021 |
- | 781,236 | 852,582 | 518,215 | 558,488 | 136 | 134 | 3,364 | 48,821 | |||||||||||||||||||||||||||||||
|
(1) |
The Principal Executive Officer (“PEO”) was Mr. Noss from August 2021 until November 2025. Following Mr. Noss’ departure, Mr. Woroch was appointed PEO. The non-PEO NEOs in fiscal year 2025 consisted of Messrs. Reilly, Fausett and Ivanov. Messrs Reilly and Fausett served as Non-PEO NEOs for all five years. Mr. Ivanov has served as a NEO since August 5, 2024. Mr. Singh served as a NEO for the four years 2021, 2022, 2023 and up to August 2, 2024. Mr. Woroch served as a NEO for four years 2021, 2022, 2023, 2024 and up to October 2025 |
|
(2) |
Represents Compensation Actually Paid (“CAP”) for our PEO and average CAP for our Non-PEO NEOs as a group, as computed in accordance with the PvP disclosure rules (determined as set forth below). The dollar amounts do not reflect the amounts of compensation ultimately earned or realized by our NEOs during the covered years. |
Adjustment to Determine CAP for PEO Mr. Woroch
|
Summary Compensation Table(a) |
2025* |
|||
|
SCT Total for PEO (b) |
$ | 785,251 | ||
|
Subtract Grant Date Fair Value of Option Awards and Stock Awards Granted in Fiscal Year(c) |
(232,598 | ) | ||
|
Add Fair Value at Fiscal Year-End of Outstanding and Unvested Option Awards and Stock Awards Granted in Fiscal Year(d) |
266,064 | |||
|
Adjust for Change in Fair Value of Outstanding and Unvested Option Awards and Stock Awards Granted in Prior Fiscal Years(d) |
55,177 | |||
|
Adjust for Fair Value at Vesting of Option Awards and Stock Awards Granted in Fiscal Year That Vested During Fiscal Year(d) |
- | |||
|
Adjust for Change in Fair Value as of Vesting Date of Option Awards and Stock Awards Granted in Prior Fiscal Years For Which Applicable Vesting Conditions Were Satisfied During Fiscal Year(d) |
12,937 | |||
|
Subtract Fair Value as of Prior Fiscal Year-End of Option Awards and Stock Awards Granted in Prior Fiscal Years That Failed to Meet Applicable Vesting Conditions During Fiscal Year(d) |
- | |||
|
Add Value of Dividends or other Earnings Paid on Stock or Option Awards not Otherwise Reflected in Fair Value or Total Compensation |
- | |||
|
TOTAL ADJUSTMENTS |
101,580 | |||
|
COMPENSATION ACTUALLY PAID |
$ | 886,830 | ||
*Mr Woroch was appointed as NEO on November 2025
|
Adjustment to Determine CAP for PEO Mr Noss |
||||||||||||||||||||
|
Summary Compensation Table(a) |
2025 |
2024 |
2023 |
2022 |
2021 |
|||||||||||||||
|
SCT Total for PEO (b) |
$ | 3,141,452 | $ | 975,733 | $ | 1,138,720 | $ | 1,306,202 | $ | 781,236 | ||||||||||
|
Subtract Grant Date Fair Value of Option Awards and Stock Awards Granted in Fiscal Year(c) |
(42,300 | ) | (141,089 | ) | (273,800 | ) | (561,542 | ) | (125,719 | ) | ||||||||||
|
Add Fair Value at Fiscal Year-End of Outstanding and Unvested Option Awards and Stock Awards Granted in Fiscal Year(d) |
- | 104,431 | 522,180 | 525,790 | 142,214 | |||||||||||||||
|
Adjust for Change in Fair Value of Outstanding and Unvested Option Awards and Stock Awards Granted in Prior Fiscal Years(d) |
- | (253,890 | ) | 273,810 | (197,560 | ) | 41,789 | |||||||||||||
|
Adjust for Fair Value at Vesting of Option Awards and Stock Awards Granted in Fiscal Year That Vested During Fiscal Year(d) |
39,162 | - | 281,696 | - | - | |||||||||||||||
|
Adjust for Change in Fair Value as of Vesting Date of Option Awards and Stock Awards Granted in Prior Fiscal Years For Which Applicable Vesting Conditions Were Satisfied During Fiscal Year(d) |
(56,153 | ) | (178,548 | ) | 111,462 | (105,491 | ) | 13,062 | ||||||||||||
|
Subtract Fair Value as of Prior Fiscal Year-End of Option Awards and Stock Awards Granted in Prior Fiscal Years That Failed to Meet Applicable Vesting Conditions During Fiscal Year(d) |
- | - | - | - | - | |||||||||||||||
|
Add Value of Dividends or other Earnings Paid on Stock or Option Awards not Otherwise Reflected in Fair Value or Total Compensation |
- | - | - | - | - | |||||||||||||||
|
TOTAL ADJUSTMENTS |
(59,291 | ) | (469,096 | ) | 915,347 | (338,803 | ) | 71,346 | ||||||||||||
|
COMPENSATION ACTUALLY PAID |
$ | 3,082,161 | $ | 506,637 | $ | 2,054,067 | $ | 967,399 | $ | 852,582 | ||||||||||
|
(a) (b) |
We have not reported any amounts in our Summary Compensation Table with respect to “Change in Pension and Nonqualified Deferred Compensation” and, accordingly, the adjustments with respect to such items prescribed by the pay-versus-performance rules are not relevant to our analysis and no adjustments have been made. Due to administrative error, the information in this row has been updated to reflect gross salary for year 2021, 2022 & 2023. |
|
|
(c) |
The amounts reflect the aggregate grant-date fair value reported in the “Stock Awards” and “Option Awards” columns in the Summary Compensation Table for the applicable year, as well as the "Subsidiary Stock Options" column of the Other Compensation table breakdown. |
|
|
(d) |
In accordance with the requirements of Item 402(v) of Regulation S-K, the fair values of unvested and outstanding equity awards to our named executive officers were re-measured as of the end of each fiscal year, and as of each vesting date, during the years displayed in the table above. We approached the determination of fair value in the same way as we historically have determined fair value and fair values as of each measurement date were determined using valuation assumptions and methodologies (including expected term, volatility, and risk-free interest rates) that are generally consistent with those used to estimate fair value at the grant date under U.S. GAAP. See “Stock-based Compensation Expense” in the Notes to Consolidated Financial Statements contained in our 2025 Annual Report for additional details. |
Adjustment to Determine CAP for Non-PEO Named Executive Officers as a Group
|
Summary Compensation Table(a) |
2025 |
2024 |
2023 |
2022 |
2021 |
|||||||||||||||
|
Average SCT Total for Non-PEO Named Executive Officers(b) |
$ | 647,128 | $ | 670,289 | $ | 640,572 | $ | 1,273,460 | $ | 518,215 | ||||||||||
|
Subtract Grant Date Fair Value of Option Awards and Stock Awards Granted in Fiscal Year(c) |
(59,939 | ) | (142,847 | ) | (30,608 | ) | (677,539 | ) | (113,147 | ) | ||||||||||
|
Add Fair Value at Fiscal Year-End of Outstanding and Unvested Option Awards and Stock Awards Granted in Fiscal Year(d) |
57,759 | 107,927 | 39,929 | 646,564 | 27,992 | |||||||||||||||
|
Adjust for Change in Fair Value of Outstanding and Unvested Option Awards and Stock Awards Granted in Prior Fiscal Years(d) |
27 | 16,842 | 133,551 | (94,589 | ) | 20,622 | ||||||||||||||
|
Adjust for Fair Value at Vesting of Option Awards and Stock Awards Granted in Fiscal Year That Vested During Fiscal Year(d) |
- | - | 3,801 | - | - | |||||||||||||||
|
Adjust for Change in Fair Value as of Vesting Date of Option Awards and Stock Awards Granted in Prior Fiscal Years For Which Applicable Vesting Conditions Were Satisfied During Fiscal Year(d) |
(38,934 | ) | (59,738 | ) | 211,817 | 2,236 | 4,805 | |||||||||||||
|
Subtract Fair Value as of Prior Fiscal Year-End of Option Awards and Stock Awards Granted in Prior Fiscal Years That Failed to Meet Applicable Vesting Conditions During Fiscal Year(d) |
- | (30,853 | ) | - | - | - | ||||||||||||||
|
Add Value of Dividends or other Earnings Paid on Stock or Option Awards not Otherwise Reflected in Fair Value or Total Compensation |
- | - | - | - | - | |||||||||||||||
|
TOTAL ADJUSTMENTS |
(41,088 | ) | (108,669 | ) | 358,489 | (123,328 | ) | 40,273 | ||||||||||||
|
COMPENSATION ACTUALLY PAID |
$ | 606,040 | $ | 561,620 | $ | 999,061 | $ | 1,150,132 | $ | 558,488 | ||||||||||
|
(a) |
We have not reported any amounts in our Summary Compensation Table with respect to “Change in Pension and Nonqualified Deferred Compensation” and, accordingly, the adjustments with respect to such items prescribed by the pay-versus-performance rules are not relevant to our analysis and no adjustments have been made. |
| (b) |
Due to administrative error, the information in this row has been updated to reflect gross salary. |
|
(c) |
The amounts reflect the aggregate grant-date fair value reported in the “Stock Awards” and “Option Awards” columns in the Summary Compensation Table for the applicable year, as well as the "Subsidiary Stock Options" column of the Other Compensation table breakdown. |
|
(d) |
In accordance with the requirements of Item 402(v) of Regulation S-K, the fair values of unvested and outstanding equity awards to our named executive officers were re-measured as of the end of each fiscal year, and as of each vesting date, during the years displayed in the table above. We approached the determination of fair value in the same way as we historically have determined fair value and fair values as of each measurement date were determined using valuation assumptions and methodologies (including expected term, volatility, and risk-free interest rates) that are generally consistent with those used to estimate fair value at the grant date under U.S. GAAP. See “Stock-based Compensation Expense” in the Notes to Consolidated Financial Statements contained in our 2025 Annual Report for additional details. |
| (3) |
Amounts reflected in this column represents the average “Total Compensation” from the SCT and CAP for our Non-PEO NEOs as a group for the covered years. |
| (4) |
The dollar amounts reported in column (g) represent the cumulative peer group TSR, weighted according to the respective companies’ stock market capitalization at the beginning of each period for which a return is indicated. The peer group used for this purpose is the following published industry index: RDG Internet Composite Index. |
| (5) |
We identified Adjusted EBITDA as a Company-Selected Measure that represents, in our view, the most important measure used to link CAP to performance. Adjusted EBITDA is a non-GAAP measure. |
Narrative to the Pay versus Performance Table
Adjusted EBITDA was the only performance measure used directly in the calculation of compensation paid for Fiscal 2020, Fiscal 2021 and Fiscal 2022. Beginning in Fiscal 2023, the Company replaced Adjusted EBITDA incentive bonus targets with segment targets that are more individually aligned to each NEO's ability to impact Company performance and drive long-term EBITDA growth.
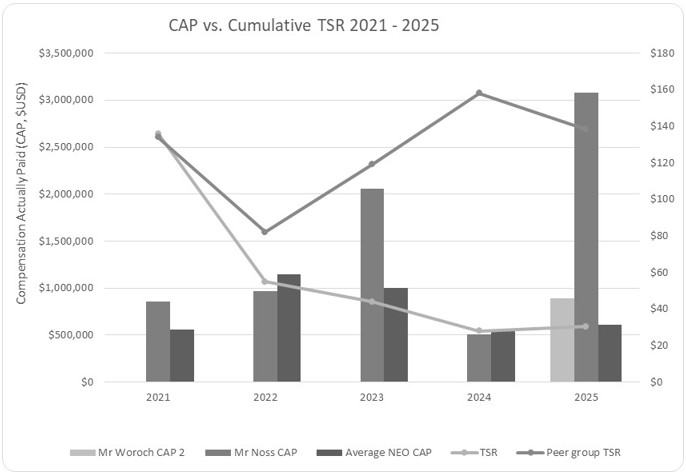
The following graphic depicts the relationship of the CAP received by our PEO and other NEOs in Fiscal 2021, Fiscal 2022, Fiscal 2023, Fiscal 2024 and Fiscal 2025 to the Company’s Cumulative TSR. It also compares the Company’s Cumulative TSR with its Peer Group’s Cumulative TSR.
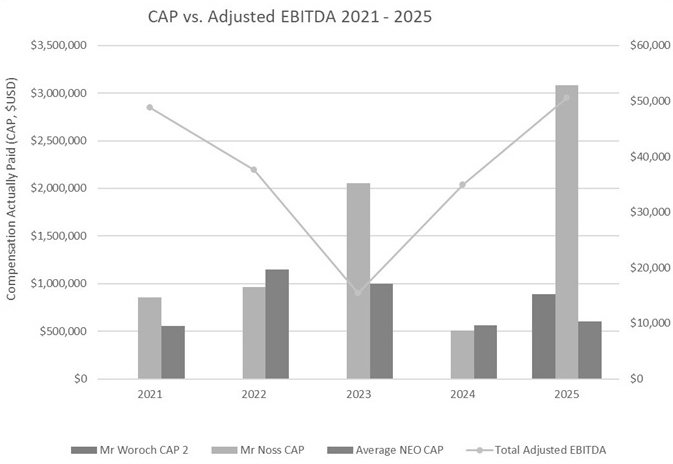
Relationship between CAP, the Company’s Adjusted EBITDA for FY 2021-2025
The following graph demonstrates the relationship of the amount of compensation actually paid to our PEO and the average amount of compensation actually paid to the Company’s NEOs as a group (excluding Mr. Noss) with the Company’s Adjusted EBITDA over the five fiscal years presented in the table. It should be noted that Adjusted EBITDA targets used to determine CAP in Fiscal 2023 were lowered to reflect the expected impact of accelerated build of our Ting Fiber Network and scaling up of operations on consolidated Adjusted EBITDA.
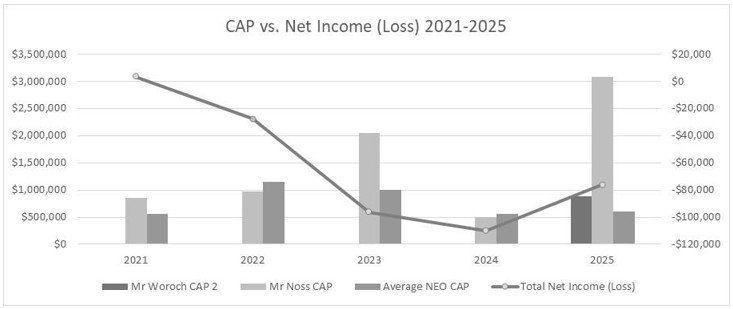
Relationship between CAP, the Company’s Net Income (Loss) for FY 2021-2025
The following graph demonstrates the relationship of the amount of compensation actually paid to our PEO and the average amount of compensation actually paid to the Company's NEOs as a group (excluding Mr. Noss) with the Company's Net Income (Loss) over the five fiscal years presented in the table. As illustrated, Net Income (Loss) declined from 2021 through 2024, reflecting the expected impact of accelerated investment in the build-out of our Ting Fiber Network and the scaling up of operations, before showing improvement in fiscal 2025.
Relationship between CAP, the Company’s Adjusted EBITDA for FY 2021-2025
The following graph demonstrates the relationship of the amount of compensation actually paid to our PEO and the average amount of compensation actually paid to the Company’s NEOs as a group (excluding Mr. Noss) with the Company’s Adjusted EBITDA over the five fiscal years presented in the table. It should be noted that Adjusted EBITDA targets used to determine CAP in Fiscal 2023 were lowered to reflect the expected impact of accelerated build of our Ting Fiber Network and scaling up of operations on consolidated Adjusted EBITDA.
Relationship between CAP, the Company’s Net Income (Loss) for FY 2021-2025
The following graph demonstrates the relationship of the amount of compensation actually paid to our PEO and the average amount of compensation actually paid to the Company's NEOs as a group (excluding Mr. Noss) with the Company's Net Income (Loss) over the five fiscal years presented in the table. As illustrated, Net Income (Loss) declined from 2021 through 2024, reflecting the expected impact of accelerated investment in the build-out of our Ting Fiber Network and the scaling up of operations, before showing improvement in fiscal 2025.
Financial Performance Measures for Fiscal Year 2025
In 2025, the Company's annual incentive bonuses were structured around balanced scorecards tailored to each business segment, incorporating both financial and non-financial measures aligned with each NEO’s ability to drive long-term profitability and cash generation.
Each business segment is evaluated on key performance indicators tied to driving new growth, alongside specific financial metrics that reflect the economic realities of the business. For Tucows Domains, adjusted free cash flow emphasizes disciplined cost management and the consistent generation of cash from a mature, cash-generative business. At Ting, free cash flow is a critical measure to reinforce accountability for capital efficiency and the transition to sustainable cash generation. For Wavelo, Adjusted EBITDA focuses on operational performance and margin progression as the business scales, providing a clear view of underlying profitability independent of non-cash or non-recurring items. At the consolidated level, bonuses are determined based on a weighted average of business segment performance, reinforcing alignment across the organization and ensuring that management decisions support enterprise-wide value creation.