Pay vs Performance Disclosure - USD ($)
Mar. 19, 2021
Dec. 31, 2021
Dec. 31, 2025
Dec. 31, 2024
Dec. 31, 2023
Dec. 31, 2022
Dec. 31, 2021
Pay Versus Performance
As required by Section 953(a) of the Dodd-Frank Wall Street Reform and Consumer Protection Act and Item 402(v) of Regulation S-K, we are providing the following information about the relationship between executive compensation and certain financial performance measures of the Company. For further information concerning the Company’s pay-for-performance philosophy and how executive compensation aligns with the Company’s performance, please see the “Executive Compensation — Compensation Discussion and Analysis” section of this proxy statement.
Pay Versus Performance Table
Year | Summary Compensation Table Total for First PEO(1),(2) | Compensation Actually Paid to First PEO(1),(3) | Summary Compensation Table Total for Second PEO(1),(2) | Compensation Actually Paid to Second PEO(1),(3) | Average Summary Compensation Table Total for Non-PEO Named Executive Officers(4) | Average Compensation Actually Paid to Non-PEO Named Executive Officers(5) | Value of Initial Fixed $100 Investment Based On: | |||||||||||||||||||||||||
Total Shareholder Return(6) | Peer Group Total Shareholder Return(7) | Net Income(8) (in millions) | Revenues(9) (in millions) | |||||||||||||||||||||||||||||
(a) | (b) | (c) | (d) | (e) | (f) | (g) | (h) | (i) | (j) | (k) | ||||||||||||||||||||||
2025 | $— | $— | $15,947,158 | $23,511,311 | $5,544,470 | $7,060,857 | $109.05 | $258.44 | $198.3 | $669.1 | ||||||||||||||||||||||
2024 | $— | $— | $15,650,272 | $7,830,649 | $5,514,326 | $2,529,577 | $115.06 | $200.98 | $173.7 | $607.6 | ||||||||||||||||||||||
2023 | $— | $— | $7,783,232 | $23,974,241 | $2,503,572 | $4,719,665 | $161.06 | $147.39 | $151.6 | $554.5 | ||||||||||||||||||||||
2022 | $— | $— | $11,392,553 | $5,138,863 | $4,444,562 | $2,529,882 | $92.09 | $88.54 | $108.0 | $489.7 | ||||||||||||||||||||||
2021 | $20,875,111 | $16,450,909 | $9,396,664 | $12,827,121 | $4,140,001 | $5,326,529 | $112.60 | $137.86 | $71.0 | $411.2 | ||||||||||||||||||||||
(1) | The first PEO is Philippe F. Courtot, who served as PEO in 2021 through March 19, 2021. The second PEO is Sumedh S. Thakar, who served as PEO beginning on April 27, 2021 and in 2022, 2023, 2024 and 2025. |
(2) | Represents the total compensation paid to each of our PEO in each listed year, as shown in our Summary Compensation Table for such listed year. |
(3) | Compensation actually paid does not mean that our PEOs were actually paid those amounts in the listed year, but this is a dollar amount derived by adjusting the Summary Compensation Table total compensation under the methodology prescribed in the relevant rules under Item 402(v) of Regulation S-K, as shown in the following tables: |
First PEO
2021 | 2022 | 2023 | 2024 | 2025 | |||||||||||||
Summary Compensation Table Total | 20,875,111 | — | — | — | — | ||||||||||||
Subtract Grant Date Fair Value of Option Awards and Stock Awards Granted in Fiscal Year | — | — | — | — | — | ||||||||||||
Add Fair Value at Fiscal Year-End of Outstanding and Unvested Option Awards and Stock Awards Granted in Fiscal Year | — | — | — | — | — | ||||||||||||
Adjust for Change in Fair Value of Outstanding and Unvested Option Awards and Stock Awards Granted in Prior Fiscal Years | — | — | — | — | — | ||||||||||||
Adjust for Fair Value at Vesting of Option Awards and Stock Awards Granted in Fiscal Year That Vested During Fiscal Year | — | — | — | — | — | ||||||||||||
Adjust for Change in Fair Value as of Vesting Date of Option Awards and Stock Awards Granted in Prior Fiscal Years For Which Applicable Vesting Conditions Were Satisfied During Fiscal Year | 343,840 | — | — | — | — | ||||||||||||
Subtract Fair Value as of Prior Fiscal Year-End of Option Awards and Stock Awards Granted in Prior Fiscal Years That Failed to Meet Applicable Vesting Conditions During Fiscal Year | (4,768,042) | — | — | — | — | ||||||||||||
Add Value of Dividends or other Earnings Paid on Stock or Option Awards not Otherwise Reflected in Fair Value or Total Compensation | — | — | — | — | — | ||||||||||||
Compensation Actually Paid | 16,450,909 | — | — | — | — |
Second PEO
2021 | 2022 | 2023 | 2024 | 2025 | |||||||||||||
Summary Compensation Table Total | 9,396,664 | 11,392,553 | 7,783,232 | 15,650,272 | 15,947,158 | ||||||||||||
Subtract Grant Date Fair Value of Option Awards and Stock Awards Granted in Fiscal Year | (8,364,620) | (10,361,307) | (6,931,496) | (14,549,332) | (14,597,565) | ||||||||||||
Add Fair Value at Fiscal Year-End of Outstanding and Unvested Option Awards and Stock Awards Granted in Fiscal Year | 10,149,237 | 7,236,431 | 8,940,750 | 14,661,086 | 17,123,551 | ||||||||||||
Adjust for Change in Fair Value of Outstanding and Unvested Option Awards and Stock Awards Granted in Prior Fiscal Years | 1,821,938 | (2,774,012) | 12,892,872 | (4,405,419) | (585,066) | ||||||||||||
Adjust for Fair Value at Vesting of Option Awards and Stock Awards Granted in Fiscal Year That Vested During Fiscal Year | 136,595 | — | — | — | — | ||||||||||||
Adjust for Change in Fair Value as of Vesting Date of Option Awards and Stock Awards Granted in Prior Fiscal Years For Which Applicable Vesting Conditions Were Satisfied During Fiscal Year | (312,693) | (354,802) | 1,288,883 | (3,525,958) | 5,623,233 | ||||||||||||
Subtract Fair Value as of Prior Fiscal Year-End of Option Awards and Stock Awards Granted in Prior Fiscal Years That Failed to Meet Applicable Vesting Conditions During Fiscal Year | — | — | — | — | — | ||||||||||||
Add Value of Dividends or other Earnings Paid on Stock or Option Awards not Otherwise Reflected in Fair Value or Total Compensation | — | — | — | — | — | ||||||||||||
Compensation Actually Paid | 12,827,121 | 5,138,863 | 23,974,241 | 7,830,649 | 23,511,311 |
(4) | This figure is the average of the total compensation paid to our NEOs other than our PEO in each listed year, as shown in our Summary Compensation Table for such listed year. The names of the non-PEO NEOs in each year are listed in the table below. |
2021 | 2022 | 2023 | 2024 | 2025 | ||||||||
Kim, Joo Mi | Kim, Joo Mi | Kim, Joo Mi | Kim, Joo Mi | Kim, Joo Mi | ||||||||
Posey, Bruce K. | Posey, Bruce K. | Posey, Bruce K. | Posey, Bruce K. | Posey, Bruce K. | ||||||||
Peters, Allan | Peters, Allan | Peters, Allan* | ||||||||||
* | In connection with the termination of his employment on February 7, 2023 with transition services provided through March 31, 2023, all of his unvested awards were forfeited. |
(5) | This figure is the average of the “compensation actually paid” for our NEOs other than our PEO in each listed year. “Compensation actually paid” does not mean that these NEOs were actually paid those amounts in the listed year, but this is a dollar amount derived by adjusting the average of the Summary Compensation Table total compensation figure for all NEOs other than our PEO for the listed year under the methodology prescribed under Item 402(v) of Regulation S-K, as shown in the following table: |
Non-PEO NEOs
2021 | 2022 | 2023 | 2024 | 2025 | |||||||||||||
Summary Compensation Table Total | 4,140,001 | 4,444,562 | 2,503,572 | 5,514,326 | 5,544,470 | ||||||||||||
Subtract Grant Date Fair Value of Option Awards and Stock Awards Granted in Fiscal Year | (3,625,418) | (3,952,633) | (2,073,012) | (4,889,855) | (4,750,605) | ||||||||||||
Add Fair Value at Fiscal Year-End of Outstanding and Unvested Option Awards and Stock Awards Granted in Fiscal Year | 4,474,781 | 2,907,240 | 2,673,923 | 5,172,311 | 5,383,596 | ||||||||||||
Adjust for Change in Fair Value of Outstanding and Unvested Option Awards and Stock Awards Granted in Prior Fiscal Years | 415,872 | (782,777) | 2,872,428 | (2,016,591) | (262,448) | ||||||||||||
Adjust for Fair Value at Vesting of Option Awards and Stock Awards Granted in Fiscal Year That Vested During Fiscal Year | — | — | — | — | — | ||||||||||||
Adjust for Change in Fair Value as of Vesting Date of Option Awards and Stock Awards Granted in Prior Fiscal Years For Which Applicable Vesting Conditions Were Satisfied During Fiscal Year | (78,707) | (86,511) | 364,682 | (1,250,614) | 1,145,844 | ||||||||||||
Subtract Fair Value as of Prior Fiscal Year-End of Option Awards and Stock Awards Granted in Prior Fiscal Years That Failed to Meet Applicable Vesting Conditions During Fiscal Year | — | — | (1,621,928) | — | — | ||||||||||||
Add Value of Dividends or other Earnings Paid on Stock or Option Awards not Otherwise Reflected in Fair Value or Total Compensation | — | — | — | — | — | ||||||||||||
Compensation Actually Paid | 5,326,529 | 2,529,882 | 4,719,665 | 2,529,577 | 7,060,857 |
(6) | Total shareholder return is calculated by assuming that a $100 investment was made on the day prior to the first fiscal year reported and reinvesting all dividends until the last day of each reported fiscal year. |
(7) | The peer group used is the NASDAQ Computer Index, as used in the Company’s performance graph included in our Annual Report on Form 10-K. Total shareholder return is calculated by assuming that a $100 investment was made on the day prior to the first fiscal year reported below and reinvesting all dividends until the last day of each reported fiscal year. |
(8) | The dollar amounts reported are the Company’s net income reflected in the Company’s audited financial statements for each reported fiscal year. |
(9) | In the Company’s assessment, revenues is the financial performance measure that is the most important financial performance measure used by the Company in 2025 to link compensation actually paid to Company performance. |
(1) | The first PEO is Philippe F. Courtot, who served as PEO in 2021 through March 19, 2021. The second PEO is Sumedh S. Thakar, who served as PEO beginning on April 27, 2021 and in 2022, 2023, 2024 and 2025. |
(4) | This figure is the average of the total compensation paid to our NEOs other than our PEO in each listed year, as shown in our Summary Compensation Table for such listed year. The names of the non-PEO NEOs in each year are listed in the table below. |
2021 | 2022 | 2023 | 2024 | 2025 | ||||||||
Kim, Joo Mi | Kim, Joo Mi | Kim, Joo Mi | Kim, Joo Mi | Kim, Joo Mi | ||||||||
Posey, Bruce K. | Posey, Bruce K. | Posey, Bruce K. | Posey, Bruce K. | Posey, Bruce K. | ||||||||
Peters, Allan | Peters, Allan | Peters, Allan* | ||||||||||
* | In connection with the termination of his employment on February 7, 2023 with transition services provided through March 31, 2023, all of his unvested awards were forfeited. |
(7) | The peer group used is the NASDAQ Computer Index, as used in the Company’s performance graph included in our Annual Report on Form 10-K. Total shareholder return is calculated by assuming that a $100 investment was made on the day prior to the first fiscal year reported below and reinvesting all dividends until the last day of each reported fiscal year. |
(3) | Compensation actually paid does not mean that our PEOs were actually paid those amounts in the listed year, but this is a dollar amount derived by adjusting the Summary Compensation Table total compensation under the methodology prescribed in the relevant rules under Item 402(v) of Regulation S-K, as shown in the following tables: |
First PEO
2021 | 2022 | 2023 | 2024 | 2025 | |||||||||||||
Summary Compensation Table Total | 20,875,111 | — | — | — | — | ||||||||||||
Subtract Grant Date Fair Value of Option Awards and Stock Awards Granted in Fiscal Year | — | — | — | — | — | ||||||||||||
Add Fair Value at Fiscal Year-End of Outstanding and Unvested Option Awards and Stock Awards Granted in Fiscal Year | — | — | — | — | — | ||||||||||||
Adjust for Change in Fair Value of Outstanding and Unvested Option Awards and Stock Awards Granted in Prior Fiscal Years | — | — | — | — | — | ||||||||||||
Adjust for Fair Value at Vesting of Option Awards and Stock Awards Granted in Fiscal Year That Vested During Fiscal Year | — | — | — | — | — | ||||||||||||
Adjust for Change in Fair Value as of Vesting Date of Option Awards and Stock Awards Granted in Prior Fiscal Years For Which Applicable Vesting Conditions Were Satisfied During Fiscal Year | 343,840 | — | — | — | — | ||||||||||||
Subtract Fair Value as of Prior Fiscal Year-End of Option Awards and Stock Awards Granted in Prior Fiscal Years That Failed to Meet Applicable Vesting Conditions During Fiscal Year | (4,768,042) | — | — | — | — | ||||||||||||
Add Value of Dividends or other Earnings Paid on Stock or Option Awards not Otherwise Reflected in Fair Value or Total Compensation | — | — | — | — | — | ||||||||||||
Compensation Actually Paid | 16,450,909 | — | — | — | — |
Second PEO
2021 | 2022 | 2023 | 2024 | 2025 | |||||||||||||
Summary Compensation Table Total | 9,396,664 | 11,392,553 | 7,783,232 | 15,650,272 | 15,947,158 | ||||||||||||
Subtract Grant Date Fair Value of Option Awards and Stock Awards Granted in Fiscal Year | (8,364,620) | (10,361,307) | (6,931,496) | (14,549,332) | (14,597,565) | ||||||||||||
Add Fair Value at Fiscal Year-End of Outstanding and Unvested Option Awards and Stock Awards Granted in Fiscal Year | 10,149,237 | 7,236,431 | 8,940,750 | 14,661,086 | 17,123,551 | ||||||||||||
Adjust for Change in Fair Value of Outstanding and Unvested Option Awards and Stock Awards Granted in Prior Fiscal Years | 1,821,938 | (2,774,012) | 12,892,872 | (4,405,419) | (585,066) | ||||||||||||
Adjust for Fair Value at Vesting of Option Awards and Stock Awards Granted in Fiscal Year That Vested During Fiscal Year | 136,595 | — | — | — | — | ||||||||||||
Adjust for Change in Fair Value as of Vesting Date of Option Awards and Stock Awards Granted in Prior Fiscal Years For Which Applicable Vesting Conditions Were Satisfied During Fiscal Year | (312,693) | (354,802) | 1,288,883 | (3,525,958) | 5,623,233 | ||||||||||||
Subtract Fair Value as of Prior Fiscal Year-End of Option Awards and Stock Awards Granted in Prior Fiscal Years That Failed to Meet Applicable Vesting Conditions During Fiscal Year | — | — | — | — | — | ||||||||||||
Add Value of Dividends or other Earnings Paid on Stock or Option Awards not Otherwise Reflected in Fair Value or Total Compensation | — | — | — | — | — | ||||||||||||
Compensation Actually Paid | 12,827,121 | 5,138,863 | 23,974,241 | 7,830,649 | 23,511,311 |
(5) | This figure is the average of the “compensation actually paid” for our NEOs other than our PEO in each listed year. “Compensation actually paid” does not mean that these NEOs were actually paid those amounts in the listed year, but this is a dollar amount derived by adjusting the average of the Summary Compensation Table total compensation figure for all NEOs other than our PEO for the listed year under the methodology prescribed under Item 402(v) of Regulation S-K, as shown in the following table: |
Non-PEO NEOs
2021 | 2022 | 2023 | 2024 | 2025 | |||||||||||||
Summary Compensation Table Total | 4,140,001 | 4,444,562 | 2,503,572 | 5,514,326 | 5,544,470 | ||||||||||||
Subtract Grant Date Fair Value of Option Awards and Stock Awards Granted in Fiscal Year | (3,625,418) | (3,952,633) | (2,073,012) | (4,889,855) | (4,750,605) | ||||||||||||
Add Fair Value at Fiscal Year-End of Outstanding and Unvested Option Awards and Stock Awards Granted in Fiscal Year | 4,474,781 | 2,907,240 | 2,673,923 | 5,172,311 | 5,383,596 | ||||||||||||
Adjust for Change in Fair Value of Outstanding and Unvested Option Awards and Stock Awards Granted in Prior Fiscal Years | 415,872 | (782,777) | 2,872,428 | (2,016,591) | (262,448) | ||||||||||||
Adjust for Fair Value at Vesting of Option Awards and Stock Awards Granted in Fiscal Year That Vested During Fiscal Year | — | — | — | — | — | ||||||||||||
Adjust for Change in Fair Value as of Vesting Date of Option Awards and Stock Awards Granted in Prior Fiscal Years For Which Applicable Vesting Conditions Were Satisfied During Fiscal Year | (78,707) | (86,511) | 364,682 | (1,250,614) | 1,145,844 | ||||||||||||
Subtract Fair Value as of Prior Fiscal Year-End of Option Awards and Stock Awards Granted in Prior Fiscal Years That Failed to Meet Applicable Vesting Conditions During Fiscal Year | — | — | (1,621,928) | — | — | ||||||||||||
Add Value of Dividends or other Earnings Paid on Stock or Option Awards not Otherwise Reflected in Fair Value or Total Compensation | — | — | — | — | — | ||||||||||||
Compensation Actually Paid | 5,326,529 | 2,529,882 | 4,719,665 | 2,529,577 | 7,060,857 |
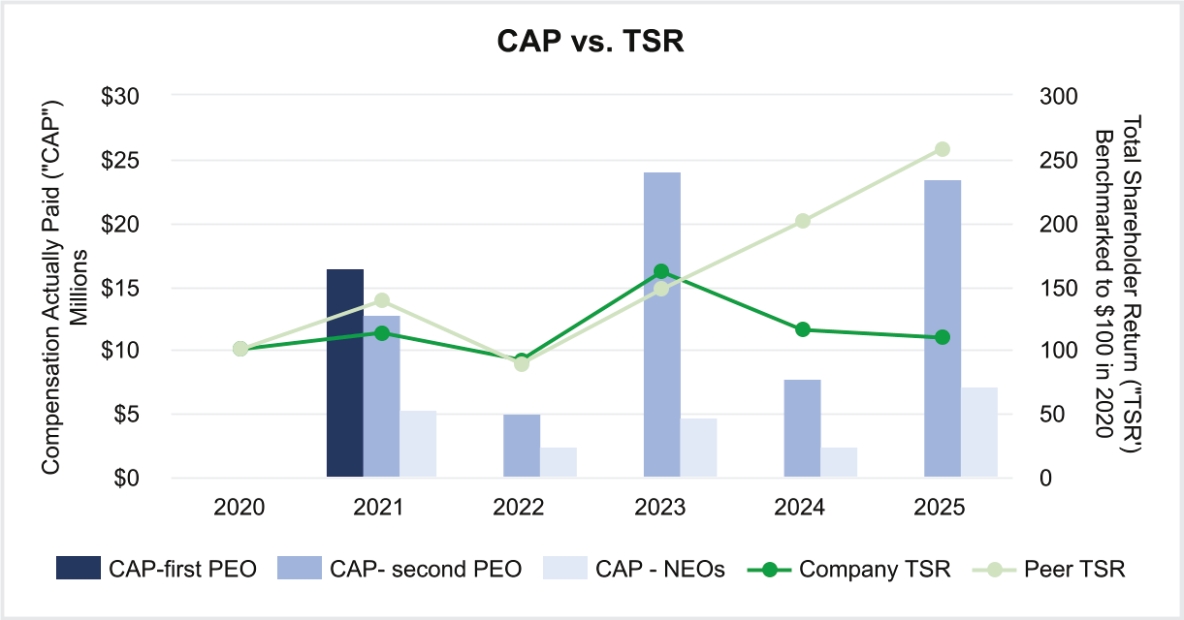
Compensation Actually Paid and TSR
The following chart reflects the amount of compensation actually paid to Mr. Thakar (for 2025, 2024, 2023, 2022 and 2021), Mr. Courtot (for 2021), and the average amount of compensation actually paid to our NEOs as a group (excluding the PEOs in each given year) in relation to our Company’s cumulative TSR over the five years presented in the table. The chart also reflects the relationship between our Company’s cumulative TSR and our peer group’s cumulative TSR:
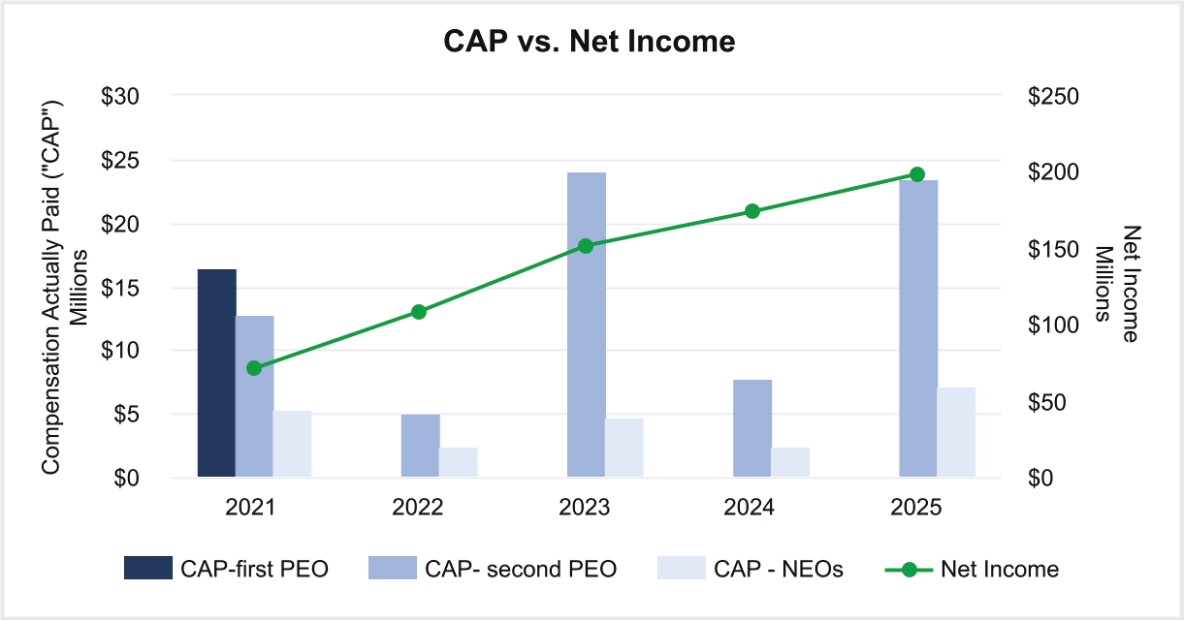
Compensation Actually Paid and Net Income
The following chart reflects the amount of compensation actually paid to Mr. Thakar (for 2025, 2024, 2023, 2022 and 2021), Mr. Courtot (for 2021), and the average amount of compensation actually paid to our NEOs as a group (excluding the PEOs in each given year) in relation to the Company’s net income over the five years presented in the table:
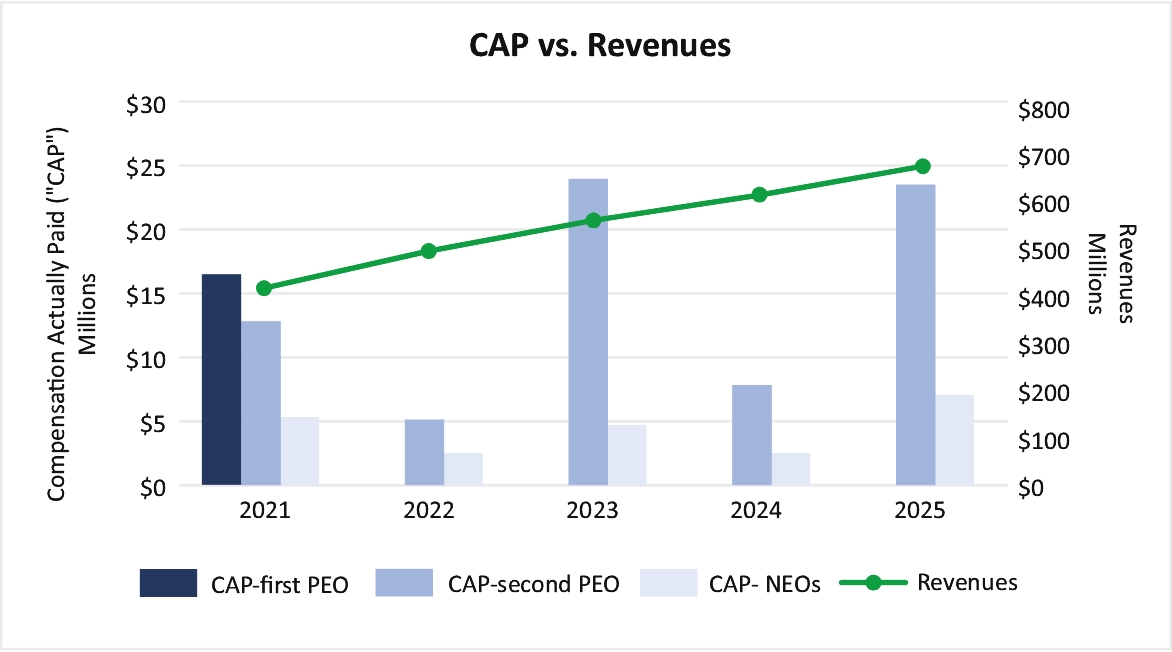
Compensation Actually Paid and Revenues
The following chart reflects the amount of compensation actually paid to Mr. Thakar (for 2025, 2024, 2023, 2022 and 2021), Mr. Courtot (for 2021), and the average amount of compensation actually paid to our NEOs as a group (excluding the PEOs in each given year) in relation to the Company’s revenues over the five years presented in the table. While we utilize a number of performance measures to evaluate company performance, we have determined that revenues is the most important financial performance measure (not otherwise required to be disclosed in the table) to link compensation actually paid to the our NEOs to Company performance. We use revenue growth when setting goals for our corporate bonus plan and PRSUs granted to our NEOs.
Compensation Actually Paid and TSR
The following chart reflects the amount of compensation actually paid to Mr. Thakar (for 2025, 2024, 2023, 2022 and 2021), Mr. Courtot (for 2021), and the average amount of compensation actually paid to our NEOs as a group (excluding the PEOs in each given year) in relation to our Company’s cumulative TSR over the five years presented in the table. The chart also reflects the relationship between our Company’s cumulative TSR and our peer group’s cumulative TSR:
Required Tabular Disclosure of Most Important Performance Measures
The list below includes the four financial performance measures that, in our assessment and in no particular order, represent the most important measures used to link compensation actually paid to our NEOs to Company performance.
Most Important Performance Measures | ||
Bookings | ||
Revenues | ||
Adjusted EBITDA Margin | ||
Non-GAAP Earnings per Diluted Share |