Pay vs Performance Disclosure
Dec. 31, 2025
USD ($)
Dec. 31, 2024
USD ($)
Dec. 31, 2023
USD ($)
Dec. 31, 2022
USD ($)
Dec. 31, 2021
USD ($)
| Year | Summary compensation table total for PEO(1) | Compensation actually paid to PEO(1)(3) | Average summary compensation table total for non-PEO named executive officers(2) | Average compensation actually paid to non-PEO named executive officers(2)(3) | Value of initial fixed $100 investment based on: | Net income (loss) ($M)(6) | Rule of 40(7)(8) | |||||||||||||||||||||||||
Total shareholder return(4) | Peer group total shareholder return(4)(5) | |||||||||||||||||||||||||||||||
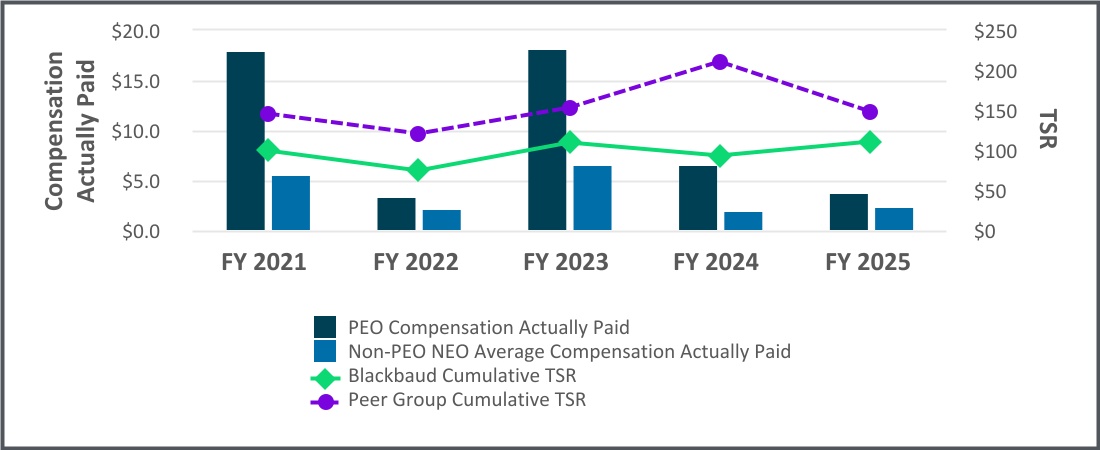
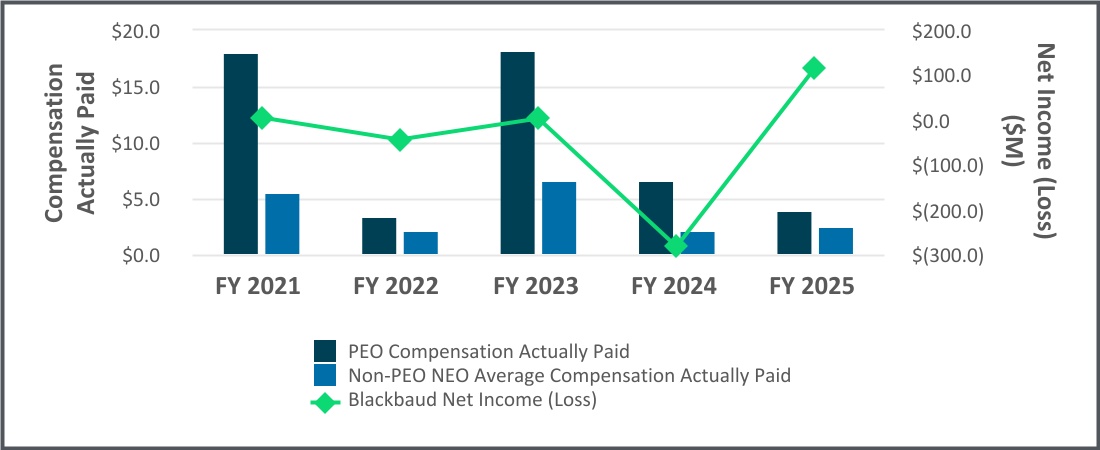
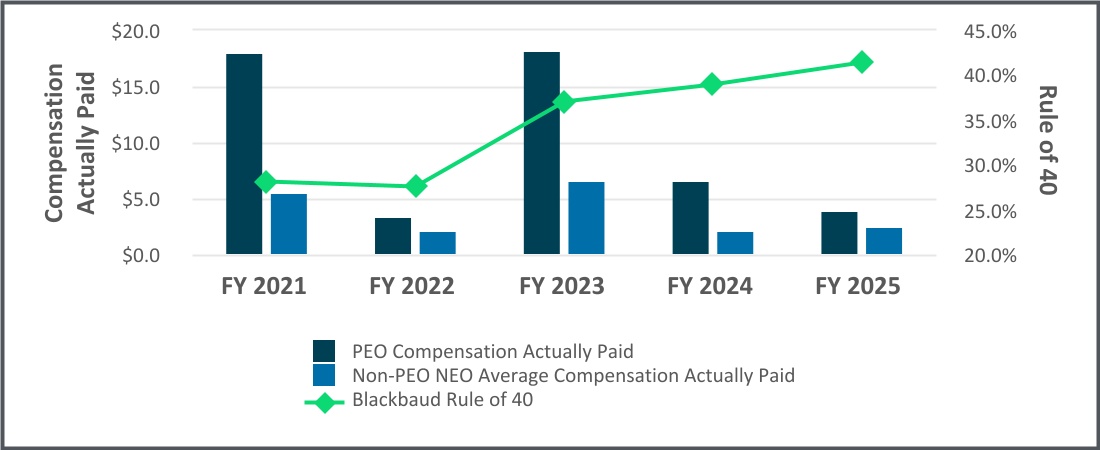
2025 | $ | 6,022,250 | $ | 3,844,890 | $ | 3,150,303 | $ | 2,449,737 | $110.01 | $148.53 | $ | 115.0 | 41.4 | % | ||||||||||||||||||
2024 | 10,225,840 | 6,547,279 | 3,354,884 | 2,062,531 | 93.03 | 211.18 | (283.2) | 38.9 | % | |||||||||||||||||||||||
2023 | 9,596,722 | 18,169,412 | 3,627,392 | 6,678,600 | 109.11 | 153.64 | 1.8 | 37.0 | % | |||||||||||||||||||||||
2022 | 8,819,151 | 3,450,876 | 3,654,102 | 2,110,183 | 74.07 | 120.32 | (45.4) | 27.5 | % | |||||||||||||||||||||||
2021 | 11,810,500 | 18,011,733 | 3,734,533 | 5,582,811 | 99.39 | 145.22 | 5.7 | 28.1 | % | |||||||||||||||||||||||
(2)During 2025, our non-PEO NEOs were: Messrs. Anderson, Boor, Benjamin, Gregoire and McDearis. During 2024, 2023 and 2022, our non-PEO NEOs were: Messrs. Boor, Benjamin, Gregoire and McDearis. During 2021, our non-PEO NEOs were: Messrs. Boor, Gregoire, McDearis and Kevin M. Mooney.
a.2025 — ACI Worldwide, Inc., BILL Holdings, Inc., Box, Inc., Commvault Systems, Inc., E2open Parent Holdings, Inc., Elastic N.V., Five9, Inc., Guidewire Software, Inc., Informatica, Inc., Pegasystems, Inc., Rapid7, Inc., SolarWinds Corporation, Tenable Holdings, Inc., Tyler Technologies, Inc. and Verint Systems, Inc. For more information, including an explanation of the changes, not due to acquisition, made to our prior year compensation peer group, see page 41. We cannot provide a comparable cumulative TSR versus our 2024 peer group as two companies were removed due to acquisitions and were not public during all of 2025. These companies were: Envestnet, Inc. and PowerSchool Holdings, Inc.
b.2024 — ACI Worldwide, Inc., Box, Inc., Commvault Systems, Inc., E2open Parent Holdings, Inc., Elastic N.V., Envestnet, Inc., Fair Isaac Corporation, Guidewire Software, Inc., Informatica, Inc., Manhattan Associates, Inc., Pegasystems, Inc., PowerSchool Holdings, Inc., SolarWinds Corporation, Tyler Technologies, Inc. and Verint Systems, Inc. For an explanation of the changes, not due to acquisition, made to our prior year compensation peer group, please refer to Blackbaud’s Proxy Statement for the 2025 Meeting of Stockholders filed on April 23, 2024. We cannot provide a comparable cumulative TSR versus our 2023 peer group as two companies were removed due to acquisitions and were not public during all of 2024. These companies were: Cvent Holding Corporation and New Relic, Inc.
c.2023 — ACI Worldwide, Inc., Box, Inc., Commvault Systems, Inc., Cvent Holding Corporation, E2open Parent Holdings, Inc., Envestnet, Inc., Fair Isaac Corporation, Guidewire Software, Inc., Manhattan Associates, Inc., New Relic, Inc., Pegasystems, Inc., PowerSchool Holdings, Inc., SolarWinds Corporation, Tyler Technologies, Inc. and Verint Systems, Inc. For an explanation of the changes, not due to acquisition, made to our prior year compensation peer group, please refer to Blackbaud’s Proxy Statement for the 2024 Meeting of Stockholders filed on April 23, 2024. We cannot provide a comparable cumulative TSR versus our 2022 peer group as two companies were removed due to acquisitions and were not public during all of 2023. These companies were: Bottomline Technologies, Inc. and Mandiant, Inc.
d.2022 — 8x8, Inc., ACI Worldwide, Inc., Aspen Technology, Inc., Bottomline Technologies, Inc., Box, Inc., Commvault Systems, Inc., Envestnet, Inc., Fair Isaac Corporation, Mandiant, Inc., Manhattan Associates, Inc., New Relic, Inc., Progress Software Corporation, SolarWinds Corporation, Tyler Technologies, Inc., Verint Systems, Inc. and Ziff Davis, Inc. For an explanation of the changes, not due to acquisition, made to our prior year compensation peer group, please refer to Blackbaud’s Proxy Statement for the 2023 Meeting of Stockholders filed on April 25, 2023. We cannot provide a comparable cumulative TSR versus our 2021 peer group as four companies were removed due to acquisitions and were not public during all of 2022. These companies were: Cloudera, Inc., Cornerstone OnDemand, Inc., Proofpoint, Inc. and RealPage, Inc.
e.2021 — 8x8, Inc., ACI Worldwide, Inc., Aspen Technology, Inc., Cloudera, Inc., Commvault Systems, Inc., Cornerstone OnDemand, Inc., Envestnet, Inc., Fair Isaac Corporation, Mandiant, Inc., Manhattan Associates, Inc., New Relic, Inc., Paylocity Holding Corporation, Proofpoint, Inc., RealPage, Inc., Tyler Technologies, Inc., Verint Systems, Inc. and Ziff Davis, Inc.
| 2025 | ||||||||
| CEO | Average of Other NEOs | |||||||
| Summary Compensation Table Total | $ | 6,022,250 | $ | 3,150,303 | ||||
| Adjustments | ||||||||
| Deduction for amounts reported under the “Stock Awards” and “Option Awards” columns in the Summary Compensation Table | (5,206,285) | (2,663,478) | ||||||
| Increase based on ASC 718 fair value of awards granted during fiscal year that remain unvested as of fiscal year end, determined as of fiscal year end | 4,821,438 | 2,482,701 | ||||||
| Increase based on ASC 718 fair value of awards granted during fiscal year that vested during fiscal year, determined as of vesting date | — | — | ||||||
Deduction for awards granted prior to fiscal year that were outstanding and unvested as of fiscal year end, determined based on change in ASC 718 fair value from prior fiscal year end to fiscal year end | (1,408,517) | (373,911) | ||||||
Deduction for awards granted prior to fiscal year that vested during fiscal year, determined based on change in ASC 718 fair value from prior fiscal year end to vesting date | (383,995) | (145,879) | ||||||
| Deduction of ASC 718 fair value of awards granted prior to fiscal year that were forfeited during fiscal year, determined as of prior fiscal year end | — | — | ||||||
| Compensation Actually Paid | $ | 3,844,890 | $ | 2,449,737 | ||||
The following table sets forth the Company's most important financial performance measures used to link NEO compensation actually paid during 2025 to Company performance.
Company Performance Measures(1)(2) | ||
Non-GAAP Adjusted Recurring Revenue | ||
Non-GAAP Adjusted Income from Operations | ||
Non-GAAP Adjusted Total Revenue | ||
Gross Dollar Retention | ||
Rule of 40 | ||
(1)This list is unranked.