Pay vs Performance Disclosure - USD ($)
|
12 Months Ended |
Dec. 31, 2025 |
Dec. 31, 2024 |
Dec. 31, 2023 |
Dec. 31, 2022 |
Dec. 31, 2021 |
| Pay vs Performance Disclosure |
|
|
|
|
|
| Pay vs Performance Disclosure, Table |
| | | | | | | | | | | | | | | | | | | | | | | | | | | | | | | | | | | | | | | | | | | | | | | | | | | | Year | | Summary Comp. Table Total for CEO | | Compensation Actually Paid to CEO | | Average Summary Comp. Table Total for Non-CEO NEOs(1) | | Average Compensation Actually Paid to Non-CEO NEOs | | Value of Initial Fixed $100 Investment Based On: | | Net Income | | Company Selected Measure | | | | | | TSR | | Peer Group TSR(2) | | | | 2025 | | 3,706,622 | | | 3,702,215 | | | 5,378,614 | | | 7,262,285 | | | 131.61 | | | 68.24 | | | (929,842) | | | n/a | | 2024 | | 3,706,090 | | | 3,691,037 | | | 3,043,807 | | | 2,941,380 | | | 81.06 | | | 60.24 | | | (608,034) | | | n/a | | 2023 | | 4,095,534 | | | 4,955,399 | | | 2,214,064 | | | 3,924,250 | | | 66.30 | | | 53.69 | | | (513,050) | | | n/a | | 2022 | | 8,612,643 | | | 5,403,553 | | | 2,407,897 | | | (437,128) | | | 33.40 | | | 31.78 | | | (258,043) | | | n/a | | 2021 | | 404,000 | | | 404,000 | | | 8,212,877 | | | 7,177,713 | | | 72.78 | | 69.08 | | (180,324) | | | n/a |
|
|
|
|
|
| Named Executive Officers, Footnote |
Amounts represent compensation actually paid to our Principal Executive Officer (PEO) and the average compensation actually paid to our remaining NEOs for the relevant fiscal year, as determined under SEC rules (and described below), which includes the individuals indicated in the table below for each fiscal year: | | | | | | | | | | | | | | | | Year | | PEO | | Non-PEO NEOs | 2025 | | JoeBen Bevirt | | Rodrigo Brumana, Didier Papadopoulos, Kate DeHoff, Bonny Simi and Nick Kalayjian | 2024 | | JoeBen Bevirt | | Matthew Field, Didier Papadopoulos, Kate DeHoff, Bonny Simi and Eric Allison | 2023 | | JoeBen Bevirt | | Matthew Field, Didier Papadopoulos, Kate DeHoff and Bonny Simi | | 2022 | | JoeBen Bevirt | | Matthew Field, Didier Papadopoulos, Kate DeHoff and Bonny Simi | | 2021 | | JoeBen Bevirt | | Matthew Field and Eric Allison |
|
|
|
|
|
| Peer Group Issuers, Footnote |
For the relevant fiscal year, represents the cumulative TSR (the “Peer Group TSR”) of a peer group consisting of Archer Aviation Inc., Eve Holding, Inc., Joby Aviation, Inc., Lilium N.V., Vertical Aerospace Ltd. (“Peer Group”), as used in the Stock Performance Graph disclosed under Item 5 of our Annual Report on Form 10-K for the year ended December 31, 2025. The amount reflected shows the annual change in value of $100 invested in the Peer Group on August 10, 2021, the date of our Merger with RTP, and assumes reinvestment of dividends, if any. Each of the companies in our Peer Group went public via merger with a special purpose acquisition company (“SPAC”). For Peer Group companies that completed their SPAC merger after August 10, 2021, the cumulative return for the Peer Group was weighted based on the market capitalization of each company based on the date of its SPAC merger. Shares of Lilium N.V. were suspended from trading on November 6, 2024, and subsequently delisted from the Nasdaq Global Select Market. The Peer Group TSR assumes a share prices of $0.00 for shares of Lilium common stock after delisting.
|
|
|
|
|
| PEO Total Compensation Amount |
$ 3,706,622
|
$ 3,706,090
|
$ 4,095,534
|
$ 8,612,643
|
$ 404,000
|
| PEO Actually Paid Compensation Amount |
$ 3,702,215
|
3,691,037
|
4,955,399
|
5,403,553
|
404,000
|
| Adjustment To PEO Compensation, Footnote |
Compensation actually paid to our NEOs represents the “Total” compensation reported in the Summary Compensation Table for the applicable fiscal year, as adjusted as follows: | | | | | | | | | | | | | | | | | 2025 | | Adjustments | | PEO | | Average Non-PEO NEOs | | Deduction for Amounts Reported under the “Stock Awards” and “Option Awards” Columns in the Summary Compensation Table for Applicable FY | | (3,045,189) | | (4,810,707) | | Increase based on ASC 718 Fair Value of Awards Granted during Applicable FY that Remain Unvested as of Applicable FY End, determined as of Applicable FY End | | 5,094,250 | | 6,474,442 | | Increase/deduction for Awards Granted during Prior FY that were Outstanding and Unvested as of Applicable FY End, determined based on change in ASC 718 Fair Value from Prior FY End to Applicable FY End | | (1,324,665) | | 495,727 | | Increase based on ASC 718 Fair Value of Awards Granted during Applicable FY that Vested during Applicable FY, determined as of Vesting Date | | — | | — | | Increase/deduction for Awards Granted during Prior FY that Vested During Applicable FY, determined based on change in ASC 718 Fair Value from Prior FY End to Vesting Date | | 430,194 | | 275,452 | Deduction for Awards Granted during Prior FY that failed to meet the applicable vesting conditions during the Applicable FY.
| | (1,158,997) | | (551,243) | | TOTAL ADJUSTMENTS | | (4,407) | | 1,883,671 |
|
|
|
|
|
| Non-PEO NEO Average Total Compensation Amount |
$ 5,378,614
|
3,043,807
|
2,214,064
|
2,407,897
|
8,212,877
|
| Non-PEO NEO Average Compensation Actually Paid Amount |
$ 7,262,285
|
2,941,380
|
3,924,250
|
(437,128)
|
7,177,713
|
| Adjustment to Non-PEO NEO Compensation Footnote |
Compensation actually paid to our NEOs represents the “Total” compensation reported in the Summary Compensation Table for the applicable fiscal year, as adjusted as follows: | | | | | | | | | | | | | | | | | 2025 | | Adjustments | | PEO | | Average Non-PEO NEOs | | Deduction for Amounts Reported under the “Stock Awards” and “Option Awards” Columns in the Summary Compensation Table for Applicable FY | | (3,045,189) | | (4,810,707) | | Increase based on ASC 718 Fair Value of Awards Granted during Applicable FY that Remain Unvested as of Applicable FY End, determined as of Applicable FY End | | 5,094,250 | | 6,474,442 | | Increase/deduction for Awards Granted during Prior FY that were Outstanding and Unvested as of Applicable FY End, determined based on change in ASC 718 Fair Value from Prior FY End to Applicable FY End | | (1,324,665) | | 495,727 | | Increase based on ASC 718 Fair Value of Awards Granted during Applicable FY that Vested during Applicable FY, determined as of Vesting Date | | — | | — | | Increase/deduction for Awards Granted during Prior FY that Vested During Applicable FY, determined based on change in ASC 718 Fair Value from Prior FY End to Vesting Date | | 430,194 | | 275,452 | Deduction for Awards Granted during Prior FY that failed to meet the applicable vesting conditions during the Applicable FY.
| | (1,158,997) | | (551,243) | | TOTAL ADJUSTMENTS | | (4,407) | | 1,883,671 |
|
|
|
|
|
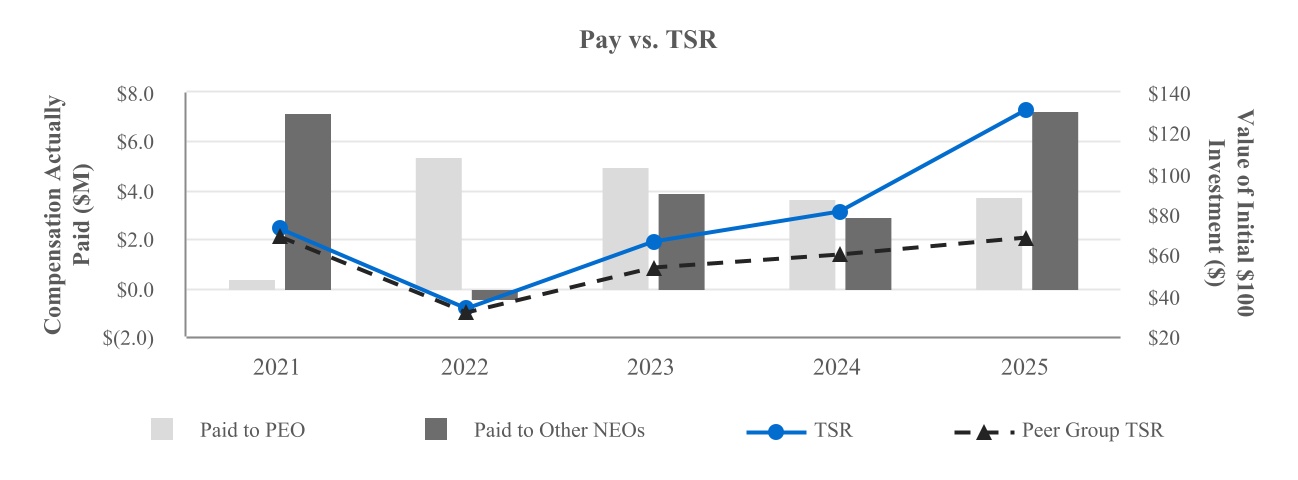
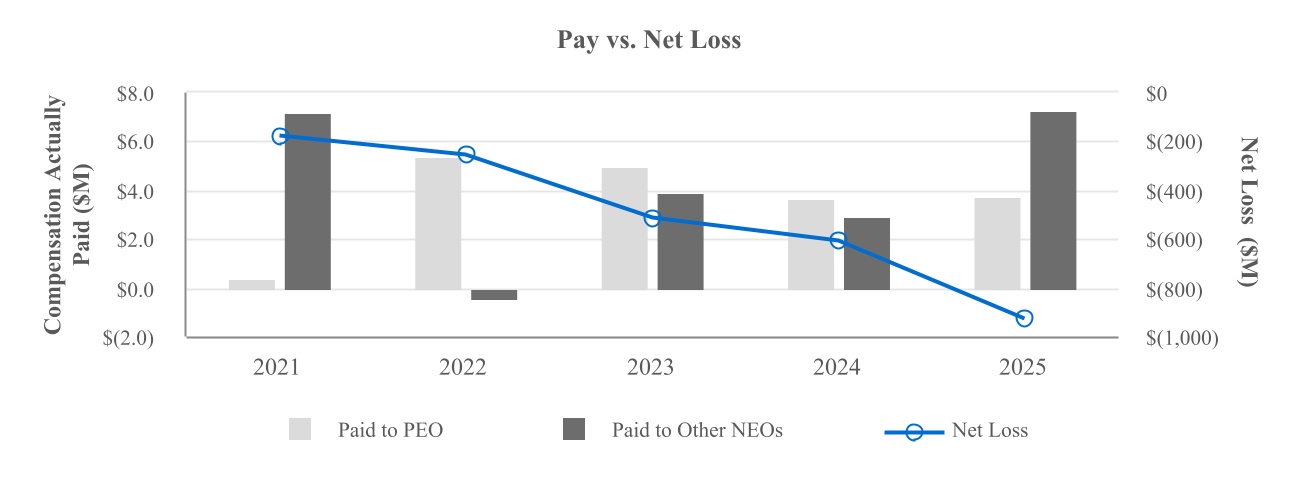
| Compensation Actually Paid vs. Total Shareholder Return |
The charts below are based on the information provided in the above table to illustrate the relationships between the Company’s compensation actually paid to the PEO and the average compensation actually paid to the Company’s non-PEO NEOs, with (i) the Company’s cumulative TSR and peer group TSR, and (ii) the Company’s net income (loss).
|
|
|
|
|
| Compensation Actually Paid vs. Net Income |
|
|
|
|
|
| Total Shareholder Return Vs Peer Group |
The charts below are based on the information provided in the above table to illustrate the relationships between the Company’s compensation actually paid to the PEO and the average compensation actually paid to the Company’s non-PEO NEOs, with (i) the Company’s cumulative TSR and peer group TSR, and (ii) the Company’s net income (loss).
|
|
|
|
|
| Total Shareholder Return Amount |
$ 131.61
|
81.06
|
66.30
|
33.40
|
72.78
|
| Peer Group Total Shareholder Return Amount |
68.24
|
60.24
|
53.69
|
31.78
|
69.08
|
| Net Income (Loss) |
$ (929,842,000)
|
$ (608,034,000)
|
$ (513,050,000)
|
$ (258,043,000)
|
$ (180,324,000)
|
| PEO Name |
JoeBen Bevirt
|
JoeBen Bevirt
|
JoeBen Bevirt
|
JoeBen Bevirt
|
JoeBen Bevirt
|
| Additional 402(v) Disclosure |
Fair value or change in fair value, as applicable, of equity awards in the “Compensation Actually Paid” columns was determined by reference to (i) for solely service-vesting RSU awards, the closing price per share on the applicable year-end date(s) or, in the case of vesting dates, the closing price per share on the applicable vesting date(s); (ii) for performance-based RSU awards, the same valuation methodology as RSU awards above except that the year-end values are multiplied by the probability of achievement of the applicable performance objective as of the applicable date; and (iii) for stock options, a Black Scholes value as of the applicable year-end or vesting date(s), determined based on the same methodology as used to determine grant date fair value but using the closing stock price on the applicable revaluation date as the current market price and with an expected life set equal to the remaining life of the award in the case of underwater stock options and, in the case of in the money options, an expected life equal to the original ratio of expected life relative to the ten year contractual life multiplied times the remaining life as of the applicable revaluation date, and in all cases based on volatility and risk free rates determined as of the revaluation date based on the expected life period and based on an expected dividend rate of 0%. For additional information on the assumptions used to calculate the valuation of the awards, see the Notes to Consolidated Financial Statements in our Annual Report on Form 10-K for the fiscal year ended December 31, 2025
|
|
|
|
|
| PEO |
|
|
|
|
|
| Pay vs Performance Disclosure |
|
|
|
|
|
| Adjustment to Compensation, Amount |
$ (4,407)
|
|
|
|
|
| PEO | Aggregate Grant Date Fair Value of Equity Award Amounts Reported in Summary Compensation Table |
|
|
|
|
|
| Pay vs Performance Disclosure |
|
|
|
|
|
| Adjustment to Compensation, Amount |
(3,045,189)
|
|
|
|
|
| PEO | Year-end Fair Value of Equity Awards Granted in Covered Year that are Outstanding and Unvested |
|
|
|
|
|
| Pay vs Performance Disclosure |
|
|
|
|
|
| Adjustment to Compensation, Amount |
5,094,250
|
|
|
|
|
| PEO | Year-over-Year Change in Fair Value of Equity Awards Granted in Prior Years That are Outstanding and Unvested |
|
|
|
|
|
| Pay vs Performance Disclosure |
|
|
|
|
|
| Adjustment to Compensation, Amount |
(1,324,665)
|
|
|
|
|
| PEO | Vesting Date Fair Value of Equity Awards Granted and Vested in Covered Year |
|
|
|
|
|
| Pay vs Performance Disclosure |
|
|
|
|
|
| Adjustment to Compensation, Amount |
0
|
|
|
|
|
| PEO | Change in Fair Value as of Vesting Date of Prior Year Equity Awards Vested in Covered Year |
|
|
|
|
|
| Pay vs Performance Disclosure |
|
|
|
|
|
| Adjustment to Compensation, Amount |
430,194
|
|
|
|
|
| PEO | Prior Year End Fair Value of Equity Awards Granted in Any Prior Year that Fail to Meet Applicable Vesting Conditions During Covered Year |
|
|
|
|
|
| Pay vs Performance Disclosure |
|
|
|
|
|
| Adjustment to Compensation, Amount |
(1,158,997)
|
|
|
|
|
| Non-PEO NEO |
|
|
|
|
|
| Pay vs Performance Disclosure |
|
|
|
|
|
| Adjustment to Compensation, Amount |
1,883,671
|
|
|
|
|
| Non-PEO NEO | Aggregate Grant Date Fair Value of Equity Award Amounts Reported in Summary Compensation Table |
|
|
|
|
|
| Pay vs Performance Disclosure |
|
|
|
|
|
| Adjustment to Compensation, Amount |
(4,810,707)
|
|
|
|
|
| Non-PEO NEO | Year-end Fair Value of Equity Awards Granted in Covered Year that are Outstanding and Unvested |
|
|
|
|
|
| Pay vs Performance Disclosure |
|
|
|
|
|
| Adjustment to Compensation, Amount |
6,474,442
|
|
|
|
|
| Non-PEO NEO | Year-over-Year Change in Fair Value of Equity Awards Granted in Prior Years That are Outstanding and Unvested |
|
|
|
|
|
| Pay vs Performance Disclosure |
|
|
|
|
|
| Adjustment to Compensation, Amount |
495,727
|
|
|
|
|
| Non-PEO NEO | Vesting Date Fair Value of Equity Awards Granted and Vested in Covered Year |
|
|
|
|
|
| Pay vs Performance Disclosure |
|
|
|
|
|
| Adjustment to Compensation, Amount |
0
|
|
|
|
|
| Non-PEO NEO | Change in Fair Value as of Vesting Date of Prior Year Equity Awards Vested in Covered Year |
|
|
|
|
|
| Pay vs Performance Disclosure |
|
|
|
|
|
| Adjustment to Compensation, Amount |
275,452
|
|
|
|
|
| Non-PEO NEO | Prior Year End Fair Value of Equity Awards Granted in Any Prior Year that Fail to Meet Applicable Vesting Conditions During Covered Year |
|
|
|
|
|
| Pay vs Performance Disclosure |
|
|
|
|
|
| Adjustment to Compensation, Amount |
$ (551,243)
|
|
|
|
|