Shareholder Report
Feb. 28, 2026
USD ($)
Holding
What were the fund costs during the last six months ?
(Based on a hypothetical $10,000 investment)
| Fund (Class) | Costs of a $10,000 investment | Costs paid as a percentage of a $10,000 investment |
| Core Bond Fund (Class NAV/JHCDX) |
$31 | 0.61% |
Fund Statistics
| Fund net assets | $1,700,738,560 |
| Total number of portfolio holdings | 995 |
| Portfolio turnover rate | 122% |
Graphical Representation of Holdings
The tables below show the investment makeup of the fund, representing a percentage of the total investments of the fund.
Portfolio Composition
| U.S. Government Agency | 25.7% |
| Corporate bonds | 24.2% |
| U.S. Government | 23.6% |
| Collateralized mortgage obligations – U.S. Government Agency | 10.9% |
| Asset-backed securities | 5.4% |
| Foreign government obligations | 1.6% |
| Collateralized mortgage obligations – Commercial and residential | 1.4% |
| Municipal bonds | 0.1% |
| Short-term investments | 7.1% |
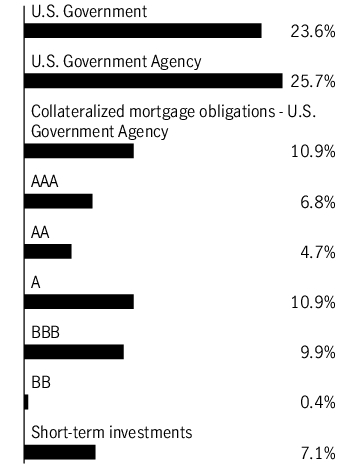
Quality Composition

Ratings are from Moody’s Investors Service, Inc. If not available, we have used S&P Global Ratings. In the absence of ratings from these agencies, we have used Fitch Ratings, Inc. “Not rated” securities are those with no ratings available from these agencies. All ratings are as of 2-28-26 and do not reflect subsequent downgrades or upgrades, if any.
Holdings may not have been held by the fund for the entire period and are subject to change without notice. Portfolio composition is subject to review in accordance with the fund’s investment strategy and may vary in the future. Current and future portfolio holdings are subject to risk and may change at any time.
Ratings are from Moody’s Investors Service, Inc. If not available, we have used S&P Global Ratings. In the absence of ratings from these agencies, we have used Fitch Ratings, Inc. “Not rated” securities are those with no ratings available from these agencies. All ratings are as of 2-28-26 and do not reflect subsequent downgrades or upgrades, if any.
What were the fund costs during the last six months ?
(Based on a hypothetical $10,000 investment)
| Fund (Class) | Costs of a $10,000 investment | Costs paid as a percentage of a $10,000 investment |
| Core Bond Fund (Class 1/JICDX) |
$33 | 0.66% |
Fund Statistics
| Fund net assets | $1,700,738,560 |
| Total number of portfolio holdings | 995 |
| Portfolio turnover rate | 122% |
Graphical Representation of Holdings
The tables below show the investment makeup of the fund, representing a percentage of the total investments of the fund.
Portfolio Composition
| U.S. Government Agency | 25.7% |
| Corporate bonds | 24.2% |
| U.S. Government | 23.6% |
| Collateralized mortgage obligations – U.S. Government Agency | 10.9% |
| Asset-backed securities | 5.4% |
| Foreign government obligations | 1.6% |
| Collateralized mortgage obligations – Commercial and residential | 1.4% |
| Municipal bonds | 0.1% |
| Short-term investments | 7.1% |
Quality Composition
Ratings are from Moody’s Investors Service, Inc. If not available, we have used S&P Global Ratings. In the absence of ratings from these agencies, we have used Fitch Ratings, Inc. “Not rated” securities are those with no ratings available from these agencies. All ratings are as of 2-28-26 and do not reflect subsequent downgrades or upgrades, if any.
Holdings may not have been held by the fund for the entire period and are subject to change without notice. Portfolio composition is subject to review in accordance with the fund’s investment strategy and may vary in the future. Current and future portfolio holdings are subject to risk and may change at any time.
Ratings are from Moody’s Investors Service, Inc. If not available, we have used S&P Global Ratings. In the absence of ratings from these agencies, we have used Fitch Ratings, Inc. “Not rated” securities are those with no ratings available from these agencies. All ratings are as of 2-28-26 and do not reflect subsequent downgrades or upgrades, if any.
What were the fund costs during the last six months ?
(Based on a hypothetical $10,000 investment)
| Fund (Class) | Costs of a $10,000 investment | Costs paid as a percentage of a $10,000 investment |
| Mid Value Fund (Class NAV/JMVNX) |
$45 | 0.85% |
Fund Statistics
| Fund net assets | $1,319,236,024 |
| Total number of portfolio holdings | 129 |
| Portfolio turnover rate | 27% |
Graphical Representation of Holdings
The tables below show the investment makeup of the fund, representing a percentage of the total net assets of the fund.
Top Ten Holdings
| Corning, Inc. | 2.3% |
| The Middleby Corp. | 1.7% |
| The Cooper Companies, Inc. | 1.7% |
| StandardAero, Inc. | 1.6% |
| Corpay, Inc. | 1.5% |
| Esab Corp. | 1.5% |
| Hexcel Corp. | 1.5% |
| Advance Auto Parts, Inc. | 1.4% |
| Lazard, Inc. | 1.4% |
| Lamb Weston Holdings, Inc. | 1.4% |
Sector Composition
| Industrials | 19.4% |
| Financials | 17.4% |
| Information technology | 15.1% |
| Health care | 8.2% |
| Real estate | 7.6% |
| Utilities | 7.3% |
| Energy | 7.2% |
| Consumer discretionary | 6.3% |
| Materials | 5.5% |
| Consumer staples | 3.4% |
| Communication services | 0.5% |
| Short-term investments and other | 2.1% |
Holdings may not have been held by the fund for the entire period and are subject to change without notice. Portfolio composition is subject to review in accordance with the fund’s investment strategy and may vary in the future. Current and future portfolio holdings are subject to risk and may change at any time.
Top Ten Holdings
| Corning, Inc. | 2.3% |
| The Middleby Corp. | 1.7% |
| The Cooper Companies, Inc. | 1.7% |
| StandardAero, Inc. | 1.6% |
| Corpay, Inc. | 1.5% |
| Esab Corp. | 1.5% |
| Hexcel Corp. | 1.5% |
| Advance Auto Parts, Inc. | 1.4% |
| Lazard, Inc. | 1.4% |
| Lamb Weston Holdings, Inc. | 1.4% |
What were the fund costs during the last six months ?
(Based on a hypothetical $10,000 investment)
| Fund (Class) | Costs of a $10,000 investment | Costs paid as a percentage of a $10,000 investment |
| Capital Appreciation Value Fund (Class NAV/JCAVX) |
$42 | 0.83% |
Fund Statistics
| Fund net assets | $1,094,601,432 |
| Total number of portfolio holdings | 230 |
| Portfolio turnover rate | 71% |
Graphical Representation of Holdings
The tables below show the investment makeup of the fund, representing a percentage of the total net assets of the fund.
Top Ten Holdings
| Microsoft Corp. | 4.6% |
| Amazon.com, Inc. | 4.3% |
| Apple, Inc. | 3.8% |
| U.S. Treasury Note, 3.625%, 10/31/2030 | 3.7% |
| NVIDIA Corp. | 3.3% |
| U.S. Treasury Note, 3.500%, 11/30/2030 | 2.9% |
| Alphabet, Inc., Class A | 2.9% |
| Meta Platforms, Inc., Class A | 2.5% |
| CenterPoint Energy, Inc. | 2.4% |
| Revvity, Inc. | 2.2% |
Portfolio Composition
| Common stocks | 61.6% |
| U.S. Government | 15.9% |
| Term loans | 9.9% |
| Corporate bonds | 7.6% |
| Short-term investments and other | 5.0% |
Holdings may not have been held by the fund for the entire period and are subject to change without notice. Portfolio composition is subject to review in accordance with the fund’s investment strategy and may vary in the future. Current and future portfolio holdings are subject to risk and may change at any time.
Top Ten Holdings
| Microsoft Corp. | 4.6% |
| Amazon.com, Inc. | 4.3% |
| Apple, Inc. | 3.8% |
| U.S. Treasury Note, 3.625%, 10/31/2030 | 3.7% |
| NVIDIA Corp. | 3.3% |
| U.S. Treasury Note, 3.500%, 11/30/2030 | 2.9% |
| Alphabet, Inc., Class A | 2.9% |
| Meta Platforms, Inc., Class A | 2.5% |
| CenterPoint Energy, Inc. | 2.4% |
| Revvity, Inc. | 2.2% |
What were the fund costs during the last six months ?
(Based on a hypothetical $10,000 investment)
| Fund (Class) | Costs of a $10,000 investment | Costs paid as a percentage of a $10,000 investment |
| International Strategic Equity Allocation Fund (Class NAV) |
$31 | 0.56% |
Fund Statistics
| Fund net assets | $5,142,410,838 |
| Total number of portfolio holdings | 1,999 |
| Portfolio turnover rate | 15% |
Graphical Representation of Holdings
The tables below show the investment makeup of the fund, representing a percentage of the total net assets of the fund.
Top Ten Holdings
| Taiwan Semiconductor Manufacturing Company, Ltd. | 4.2% |
| Samsung Electronics Company, Ltd. | 1.9% |
| ASML Holding NV | 1.5% |
| Tencent Holdings, Ltd. | 1.1% |
| SK Hynix, Inc. | 1.1% |
| Roche Holding AG | 0.9% |
| AstraZeneca PLC | 0.9% |
| HSBC Holdings PLC | 0.9% |
| Novartis AG | 0.8% |
| Alibaba Group Holding, Ltd. | 0.8% |
Sector Composition
| Financials | 23.4% |
| Information technology | 16.1% |
| Industrials | 14.7% |
| Consumer discretionary | 8.6% |
| Materials | 7.4% |
| Health care | 7.4% |
| Consumer staples | 5.7% |
| Communication services | 4.7% |
| Energy | 4.5% |
| Utilities | 3.1% |
| Real estate | 1.5% |
| Short-term investments and other | 2.9% |
Country Composition
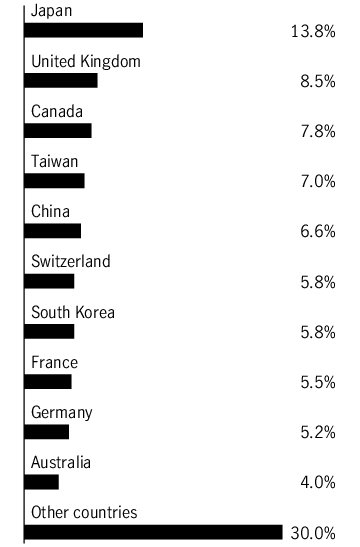
Holdings may not have been held by the fund for the entire period and are subject to change without notice. Portfolio composition is subject to review in accordance with the fund’s investment strategy and may vary in the future. Current and future portfolio holdings are subject to risk and may change at any time.
Top Ten Holdings
| Taiwan Semiconductor Manufacturing Company, Ltd. | 4.2% |
| Samsung Electronics Company, Ltd. | 1.9% |
| ASML Holding NV | 1.5% |
| Tencent Holdings, Ltd. | 1.1% |
| SK Hynix, Inc. | 1.1% |
| Roche Holding AG | 0.9% |
| AstraZeneca PLC | 0.9% |
| HSBC Holdings PLC | 0.9% |
| Novartis AG | 0.8% |
| Alibaba Group Holding, Ltd. | 0.8% |
What were the fund costs during the last six months ?
(Based on a hypothetical $10,000 investment)
| Fund (Class) | Costs of a $10,000 investment | Costs paid as a percentage of a $10,000 investment |
| U.S. Sector Rotation Fund (Class NAV) |
$27 | 0.53% |
Fund Statistics
| Fund net assets | $5,027,374,536 |
| Total number of portfolio holdings | 507 |
| Portfolio turnover rate | 8% |
Graphical Representation of Holdings
The tables below show the investment makeup of the fund, representing a percentage of the total net assets of the fund.
Top Ten Holdings
| NVIDIA Corp. | 7.1% |
| Apple, Inc. | 6.4% |
| Microsoft Corp. | 4.8% |
| Amazon.com, Inc. | 3.2% |
| Alphabet, Inc., Class A | 3.0% |
| Broadcom, Inc. | 2.5% |
| Alphabet, Inc., Class C | 2.4% |
| Meta Platforms, Inc., Class A | 2.3% |
| Tesla, Inc. | 1.8% |
| Berkshire Hathaway, Inc., Class B | 1.5% |
Sector Composition
| Information technology | 31.2% |
| Financials | 11.7% |
| Communication services | 10.2% |
| Health care | 9.5% |
| Consumer discretionary | 9.2% |
| Industrials | 9.0% |
| Consumer staples | 5.4% |
| Energy | 3.7% |
| Utilities | 2.4% |
| Materials | 2.3% |
| Real estate | 1.8% |
| Short-term investments and other | 3.6% |
Holdings may not have been held by the fund for the entire period and are subject to change without notice. Portfolio composition is subject to review in accordance with the fund’s investment strategy and may vary in the future. Current and future portfolio holdings are subject to risk and may change at any time.
Top Ten Holdings
| NVIDIA Corp. | 7.1% |
| Apple, Inc. | 6.4% |
| Microsoft Corp. | 4.8% |
| Amazon.com, Inc. | 3.2% |
| Alphabet, Inc., Class A | 3.0% |
| Broadcom, Inc. | 2.5% |
| Alphabet, Inc., Class C | 2.4% |
| Meta Platforms, Inc., Class A | 2.3% |
| Tesla, Inc. | 1.8% |
| Berkshire Hathaway, Inc., Class B | 1.5% |