Pay vs Performance Disclosure - USD ($)
Dec. 31, 2022
Aug. 31, 2022
Dec. 31, 2025
Dec. 31, 2024
Dec. 31, 2023
Dec. 31, 2022
Dec. 31, 2021
PAY VERSUS PERFORMANCE
As required by Section 953(a) of the Dodd-Frank Wall Street Reform and Consumer Protection Act, and Item 402(v) of Regulation
S-K,
we are providing the following information about the relationship between executive compensation actually paid (as computed in accordance with SEC rules) and certain financial performance of the Company. For further information concerning the Company’s compensation philosophy and how the Company aligns executive compensation with the Company’s performance, refer to “Compensation Discussion and Analysis” above.
Pay Versus Performance Table
Year |
Summary Compensation Table Total for First PEO ($) (1) |
Summary Compensation Table Total for Second PEO ($) (1) |
Compensation Actually Paid to First PEO ($) (1) |
Compensation Actually Paid to Second PEO ($) (1) |
Average Summary Compensation Table Total for Non-PEO NEOs ($) (2) |
Average Compensation Actually Paid to Non-PEO NEOs ($) (2) |
Value of Initial Fixed $100 Investment Based On: |
Net Income ($ millions) |
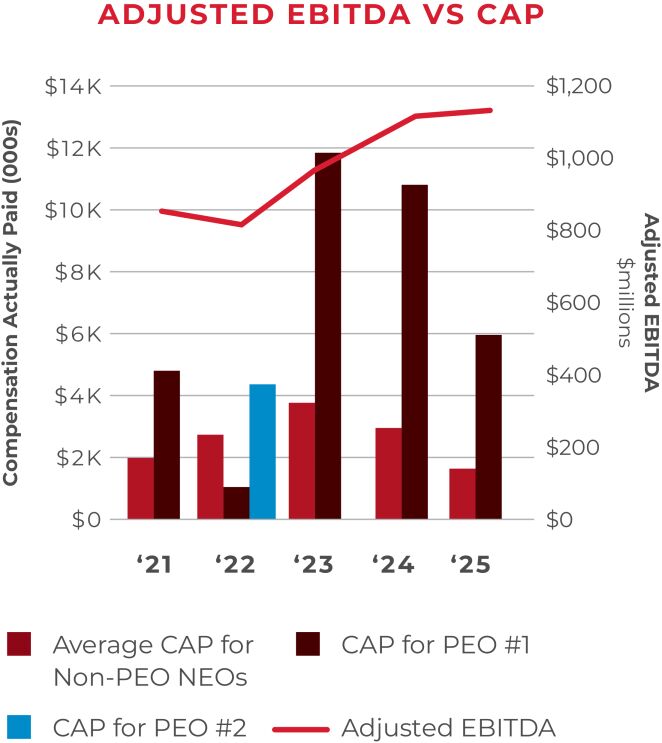
Selected Measure: Adjusted EBITDA ($ millions) (4) |
|||||||||||||||||||||||||||||||
Total Shareholder Return (3) |
Peer Group Total Shareholder Return (3) |
|||||||||||||||||||||||||||||||||||||||
(a) |
(b)(1) |
(b)(2) |
(c)(1) |
(c)(2) |
(d) |
(e) |
(f) |
(g) |
(h) |
(i) |
||||||||||||||||||||||||||||||
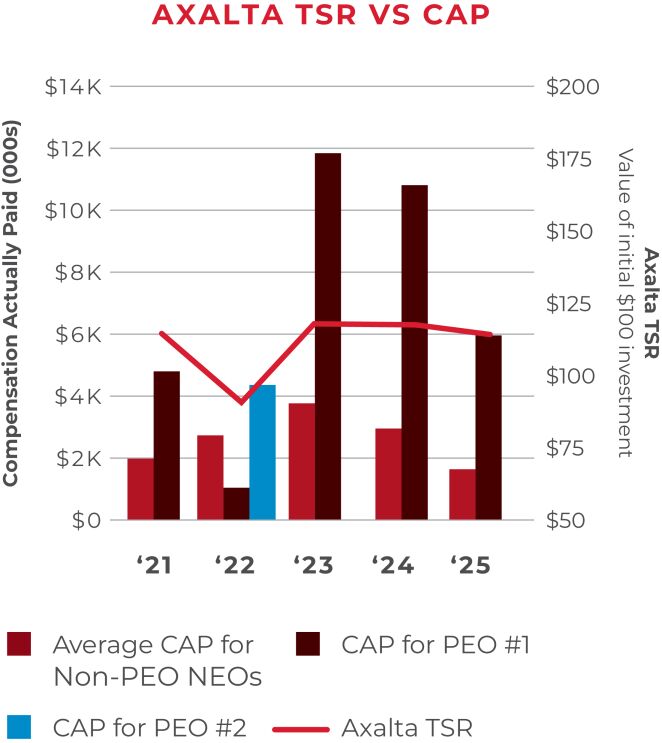
2025 |
9,551,721 |
N/A |
6,050,499 |
N/A |
2,344,546 |
1,579,109 |
$ |
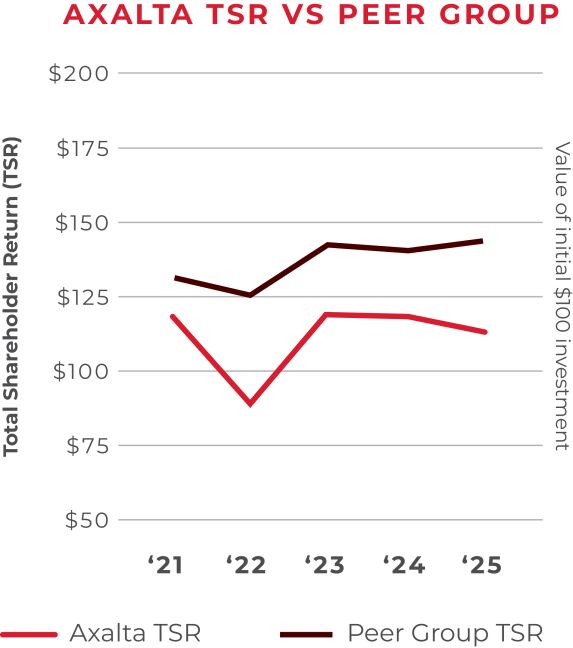
113.17 |
$ |
141.87 |
$ |
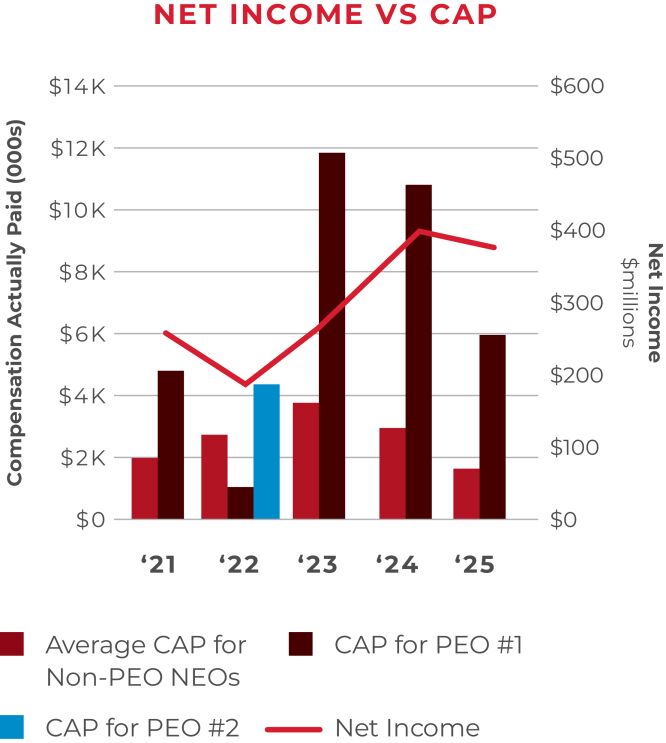
379 |
$ |
1,128 |
||||||||||||||||||||||||||
2024 |
9,823,635 |
N/A |
10,767,575 |
N/A |
2,652,287 |
2,875,437 |
$ |
119.86 |
$ |
137.93 |
$ |
391 |
$ |
1,116 |
||||||||||||||||||||||||||
2023 |
9,694,005 |
N/A |
11,810,556 |
N/A |
3,304,165 |
3,703,188 |
$ |
118.98 |
$ |
143.32 |
$ |
269 |
$ |
951 |
||||||||||||||||||||||||||
2022 |
10,614,474 |
6,602,134 |
1,261,318 |
4,482,433 |
3,972,278 |
2,812,149 |
$ |
89.21 |
$ |
124.82 |
$ |
192 |
$ |
811 |
||||||||||||||||||||||||||
2021 |
6,775,219 |
N/A |
4,817,133 |
N/A |
2,255,922 |
2,040,574 |
$ |
116.01 |
$ |
130.27 |
$ |
264 |
$ |
848 |
||||||||||||||||||||||||||
(1) |
The first principal executive officer (“PEO”) for 2025, 2024 and 2023 was Mr. Villavarayan, our CEO, and the only PEO during 2025, 2024 and 2023. The first PEO for 2022 and 2021 was Robert Bryant who served as our CEO for the full year of 2021 and through August 31, 2022 for 2022. The second PEO for 2022 was our current Board Chair, Mr. Sachdev, who served as our interim CEO from August 31, 2022 through December 31, 2022. The dollar amounts reported in column (b)(1) for the first PEO are the amounts of total compensation reported for Mr. Villavarayan for 2025, 2024 and 2023 and for Mr. Bryant for 2022 and 2021 in the “Total” column of the Summary Compensation Table in the Company’s proxy statement for each such applicable year. The dollar amount reported in column (b)(2) for the second PEO is the amount of total compensation reported for Mr. Sachdev for 2022 in the “Total” column of the Summary Compensation Table in the Company’s proxy statement for such year. Reconciliation of Compensation Actually Paid for all PEOs reported in columns (c)(1) and (c)(2) are set forth below. |
(2) |
The dollar amounts reported in column (d) represent the average of the amounts reported for the Company’s NEOs as a group, excluding Mr. Villavarayan for 2025, 2024 and 2023, Mr. Bryant for 2022 and 2021 and Mr. Sachdev for 2022, in the “Total” column of the Summary Compensation Table in each applicable year. The NEOs (excluding Messrs. Villavarayan, Bryant and Sachdev) for purposes of calculating the average amounts in each applicable year are as follows: (a) for 2025, Messrs. Anderson, Weaver, Awada and Bowes; (b) for 2024, Messrs. Anderson, Weaver and Awada and Shelley Bausch (our former President, Global Industrial Coatings); (c) for 2023, Mr. Anderson, Sean Lannon (our former Senior Vice President, Chief Financial Officer), Brian Berube (our former Senior Vice President, General Counsel and Corporate Secretary), Mr. Weaver and Mr. Awada; (d) for 2022, Messrs. Lannon, Weaver, Berube and Awada; and (e) for 2021, Messrs. Lannon and Berube, Ms. Bausch and Jacqueline Scanlan (our former Senior Vice President and Chief Human Resources Officer). A reconciliation of Average Compensation Actually Paid to Non-PEO NEOs reported in column (e) is set forth below. |
(3) |
For each year, total shareholder return for the Company and the peer group was calculated in accordance with Item 201(e) and Item 402(v) of Regulation S-K. For purposes of this pay versus performance disclosure, our peer group is the same peer group used for purposes of the performance graph included in the Company’s Annual Reports on Form 10-K and reflects the S&P 400 Materials Index for the fiscal years ended December 31, 2025, 2024, 2023, 2022 and 2021. |
(4) |
The Company has determined that Adjusted EBITDA is the financial performance measure that, in the Company’s assessment, represents the most important performance measure (that is not otherwise required to be disclosed in the table) used by the Company to link compensation actually paid to the Company’s NEOs for the most recently completed fiscal year to Company performance. Adjusted EBITDA for compensation purposes is Adjusted EBITDA, as externally reported for the applicable fiscal year. |
A reconciliation of the PEO Summary Compensation Table total compensation to the Compensation Actually Paid (“CAP”) is provided in the following tables for each PEO shown in the table above.
First PEO SCT Total Compensation to CAP Reconciliation
Year |
Summary Compensation Table Total for First PEO ($) |
Minus SCT Equity Awards ($) |
Plus Year End Fair Value of Equity Awards Granted in the Year that are Outstanding and Unvested ($) |
Plus Year over Year Change in Fair Value of Outstanding and Unvested Equity Awards Granted in Prior Years ($) |
Plus Year over Year Change in Fair Value of Equity Awards Granted in Prior Years that Vested in the Year ($) |
Minus Fair Value at the End of the Prior Year of Equity Awards that Failed to Meet Vesting Conditions in the Year ($) |
Compensation Actually Paid for First PEO ($) |
|||||||||||||||||||||
2025 |
9,551,721 |
-7,389,552 |
6,363,782 |
-2,574,774 |
99,323 |
— |
6,050,499 |
|||||||||||||||||||||
2024 |
9,823,635 |
-6,669,447 |
7,338,916 |
312,137 |
-37,666 |
— |
10,767,575 |
|||||||||||||||||||||
2023 |
9,694,005 |
-6,397,949 |
8,514,500 |
— |
— |
— |
11,810,556 |
|||||||||||||||||||||
2022 |
10,614,474 |
-4,877,099 |
— |
— |
-17,101 |
-4,458,956 |
1,261,318 |
|||||||||||||||||||||
2021 |
6,775,219 |
-4,670,206 |
3,738,946 |
-959,254 |
-67,571 |
— |
4,817,133 |
|||||||||||||||||||||
Second PEO SCT Total Compensation to CAP Reconciliation
Year |
Summary Compensation Table Total for Second PEO ($) |
Minus SCT Equity Awards ($) |
Plus Year End Fair Value of Equity Awards Granted in the Year that are outstanding and unvested ($) |
Plus Year over Year Change in Fair Value of Outstanding and Unvested Equity Awards Granted in Prior Years ($) |
Plus Year over Year Change in Fair Value of Equity Awards Granted in Prior Years that Vested in the Year ($) |
Minus Fair Value at the End of the Prior Year of Equity Awards that Failed to Meet Vesting Conditions in the Year ($) |
Compensation Actually Paid for Second PEO ($) |
|||||||||||||||||||||
2025 |
N/A |
N/A |
N/A |
N/A |
N/A |
N/A |
N/A |
|||||||||||||||||||||
2024 |
N/A |
N/A |
N/A |
N/A |
N/A |
N/A |
N/A |
|||||||||||||||||||||
2023 |
N/A |
N/A |
N/A |
N/A |
N/A |
N/A |
N/A |
|||||||||||||||||||||
2022 |
6,602,134 |
-6,199,964 |
4,133,170 |
— |
-52,907 |
— |
4,482,433 |
|||||||||||||||||||||
2021 |
N/A |
N/A |
N/A |
N/A |
N/A |
N/A |
N/A |
|||||||||||||||||||||
A reconciliation of the average
Non-PEO
NEO Summary Compensation Table total compensation to CAP is provided in the following table. Average
Non-PEO
NEOs SCT Total Compensation to CAP Reconciliation Year |
Summary Compensation Table Total for Non-PEO NEOs ($) |
Minus SCT Equity Awards ($) |
Plus Year End Fair Value of Equity Awards Granted in the Year that are Outstanding and Unvested ($) |
Plus Year over Year Change in Fair Value of Outstanding and Unvested Equity Awards Granted in Prior Years ($) |
Plus Year over Year Change in Fair Value of Equity Awards Granted in Prior Years that Vested in the Year ($) |
Minus Fair Value at the End of the Prior Year of Equity Awards that Failed to Meet Vesting Conditions in the Year ($) |
Compensation Actually Paid for Non-PEO NEOs ($) |
|||||||||||||||||||||
2025 |
2,344,546 |
-1,316,959 |
1,134,447 |
-586,219 |
3,295 |
— |
1,579,109 |
|||||||||||||||||||||
2024 |
2,652,287 |
-1,299,130 |
1,429,532 |
101,719 |
-8,971 |
— |
2,875,437 |
|||||||||||||||||||||
2023 |
3,304,165 |
-1,747,784 |
1,942,007 |
185,237 |
176,711 |
-157,148 |
3,703,188 |
|||||||||||||||||||||
2022 |
3,972,278 |
-2,241,421 |
1,689,708 |
-473,166 |
-101,196 |
-34,053 |
2,812,149 |
|||||||||||||||||||||
2021 |
2,255,922 |
-1,328,274 |
1,185,299 |
-88,626 |
16,253 |
— |
2,040,574 |
|||||||||||||||||||||
The five items listed below represent the most important financial performance measures used by the Company to link compensation actually paid to our NEOs for 2025 to the Company’s financial performance.
Non-PEO
NEOs reported in column (e) is set forth below.
S-K.
For purposes of this pay versus performance disclosure, our peer group is the same peer group used for purposes of the performance graph included in the Company’s Annual Reports on Form 10-K
and reflects the S&P 400 Materials Index for the fiscal years ended December 31, 2025, 2024, 2023, 2022 and 2021.
A reconciliation of the PEO Summary Compensation Table total compensation to the Compensation Actually Paid (“CAP”) is provided in the following tables for each PEO shown in the table above.
First PEO SCT Total Compensation to CAP Reconciliation
Year |
Summary Compensation Table Total for First PEO ($) |
Minus SCT Equity Awards ($) |
Plus Year End Fair Value of Equity Awards Granted in the Year that are Outstanding and Unvested ($) |
Plus Year over Year Change in Fair Value of Outstanding and Unvested Equity Awards Granted in Prior Years ($) |
Plus Year over Year Change in Fair Value of Equity Awards Granted in Prior Years that Vested in the Year ($) |
Minus Fair Value at the End of the Prior Year of Equity Awards that Failed to Meet Vesting Conditions in the Year ($) |
Compensation Actually Paid for First PEO ($) |
|||||||||||||||||||||
2025 |
9,551,721 |
-7,389,552 |
6,363,782 |
-2,574,774 |
99,323 |
— |
6,050,499 |
|||||||||||||||||||||
2024 |
9,823,635 |
-6,669,447 |
7,338,916 |
312,137 |
-37,666 |
— |
10,767,575 |
|||||||||||||||||||||
2023 |
9,694,005 |
-6,397,949 |
8,514,500 |
— |
— |
— |
11,810,556 |
|||||||||||||||||||||
2022 |
10,614,474 |
-4,877,099 |
— |
— |
-17,101 |
-4,458,956 |
1,261,318 |
|||||||||||||||||||||
2021 |
6,775,219 |
-4,670,206 |
3,738,946 |
-959,254 |
-67,571 |
— |
4,817,133 |
|||||||||||||||||||||
Second PEO SCT Total Compensation to CAP Reconciliation
Year |
Summary Compensation Table Total for Second PEO ($) |
Minus SCT Equity Awards ($) |
Plus Year End Fair Value of Equity Awards Granted in the Year that are outstanding and unvested ($) |
Plus Year over Year Change in Fair Value of Outstanding and Unvested Equity Awards Granted in Prior Years ($) |
Plus Year over Year Change in Fair Value of Equity Awards Granted in Prior Years that Vested in the Year ($) |
Minus Fair Value at the End of the Prior Year of Equity Awards that Failed to Meet Vesting Conditions in the Year ($) |
Compensation Actually Paid for Second PEO ($) |
|||||||||||||||||||||
2025 |
N/A |
N/A |
N/A |
N/A |
N/A |
N/A |
N/A |
|||||||||||||||||||||
2024 |
N/A |
N/A |
N/A |
N/A |
N/A |
N/A |
N/A |
|||||||||||||||||||||
2023 |
N/A |
N/A |
N/A |
N/A |
N/A |
N/A |
N/A |
|||||||||||||||||||||
2022 |
6,602,134 |
-6,199,964 |
4,133,170 |
— |
-52,907 |
— |
4,482,433 |
|||||||||||||||||||||
2021 |
N/A |
N/A |
N/A |
N/A |
N/A |
N/A |
N/A |
|||||||||||||||||||||
A reconciliation of the average
Non-PEO
NEO Summary Compensation Table total compensation to CAP is provided in the following table. Average
Non-PEO
NEOs SCT Total Compensation to CAP Reconciliation Year |
Summary Compensation Table Total for Non-PEO NEOs ($) |
Minus SCT Equity Awards ($) |
Plus Year End Fair Value of Equity Awards Granted in the Year that are Outstanding and Unvested ($) |
Plus Year over Year Change in Fair Value of Outstanding and Unvested Equity Awards Granted in Prior Years ($) |
Plus Year over Year Change in Fair Value of Equity Awards Granted in Prior Years that Vested in the Year ($) |
Minus Fair Value at the End of the Prior Year of Equity Awards that Failed to Meet Vesting Conditions in the Year ($) |
Compensation Actually Paid for Non-PEO NEOs ($) |
|||||||||||||||||||||
2025 |
2,344,546 |
-1,316,959 |
1,134,447 |
-586,219 |
3,295 |
— |
1,579,109 |
|||||||||||||||||||||
2024 |
2,652,287 |
-1,299,130 |
1,429,532 |
101,719 |
-8,971 |
— |
2,875,437 |
|||||||||||||||||||||
2023 |
3,304,165 |
-1,747,784 |
1,942,007 |
185,237 |
176,711 |
-157,148 |
3,703,188 |
|||||||||||||||||||||
2022 |
3,972,278 |
-2,241,421 |
1,689,708 |
-473,166 |
-101,196 |
-34,053 |
2,812,149 |
|||||||||||||||||||||
2021 |
2,255,922 |
-1,328,274 |
1,185,299 |
-88,626 |
16,253 |
— |
2,040,574 |
|||||||||||||||||||||
The five items listed below represent the most important financial performance measures used by the Company to link compensation actually paid to our NEOs for 2025 to the Company’s financial performance.
Most Important Measures Used by Axalta to Link Executive Compensation Actually Paid to Company Performance
Adjusted EBITDA
Free Cash Flow
Adjusted EBITDA Margin
Relative Total Shareholder Return
Adjusted Diluted EPS
Please see “Annual Performance-Based Compensation” and “Long-Term Equity Incentive Awards” beginning on pages 50 and 54, respectively, for descriptions of how these metrics are used in our executive compensation program.