Year | SCT Total | Compensation | Average | Average | Value | Value | Post-Tax | CROCE9,10 |
| |||||||||||||||
2025 - Gaspar | $ | 12,566 | $ | 13,660 | $ | 4,518 | $ | 4,837 | $ | 292 | $ | 242 | $ | 2.642B |
| 31 | % | |||||||
2025 - Muncrief | $ | 857 | $ | 1,247 |
| |||||||||||||||||||
2024 | $ | 17,040 | $ | 6,709 | $ | 6,194 | $ | 2,599 | $ | 163 | $ | 157 | $ | 2.893B |
| 36 | % | |||||||
2023 | $ | 14,883 | $ | 814 | $ | 5,502 | $ | 1,204 | $ | 226 | $ | 152 | $ | 3.739B |
| 42 | % | |||||||
2022 | $ | 14,525 | $ | 41,216 | $ | 5,374 | $ | 12,292 | $ | 285 | $ | 143 | $ | 6.031B |
| 62 | % | |||||||
2021 - Muncrief | $ | 11,915 | $ | 48,059 | $ | 4,596 | $ | 15,151 | $ | 191 | $ | 121 | $ | 2.808B |
| 39 | % | |||||||
2021 - Hager | $ | 3,391 | $ | 32,289 |
| |||||||||||||||||||
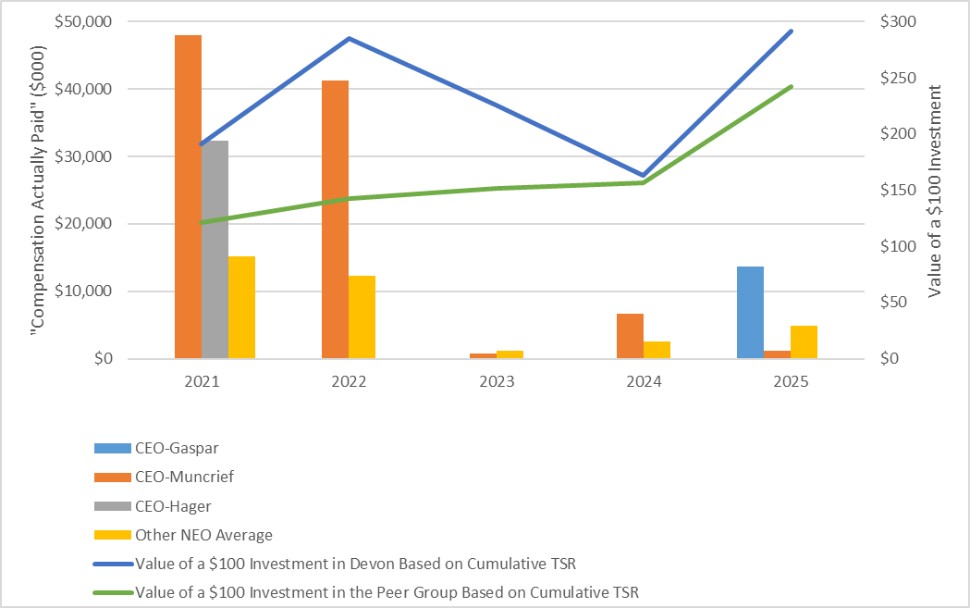
1 Dollar amounts are shown in thousands, except where otherwise indicated. References to Devon’s CEO are also references to its principal executive officer (“PEO”) for purposes of this section. 2 “SCT Total” is the Summary Compensation Table’s total for the applicable year. 3 The calculation for “Compensation Actually Paid” is shown in “PvP Table 3”. 4 The CEO for each year is as follows: 2025: Clay M. Gaspar, from March 1st to the end of the year; Richard E. Muncrief, from January 1st to February 28th. After February 28th, Mr. Muncrief assumed the position of Special Advisor until his retirement in April 2025. 2024, 2023, 2022: Richard E. Muncrief. 2021: Richard E. Muncrief, from January 7th to the end of the year; David A. Hager, from January 1st to 6th. After January 6th, Mr. Hager assumed the position of Executive Chair of the Board of Directors until his retirement in early 2023. 5 The other NEOs for each year are as follows: 2025: Dennis C. Cameron, Tana K. Cashion, David G. Harris, John D. Raines, and Jeffrey L. Ritenour. 2024, 2023, 2022: Dennis C. Cameron, Clay M. Gaspar, David G. Harris, and Jeffrey L. Ritenour. 2021: Tana K. Cashion, Clay M. Gaspar, David G. Harris, Jeffrey L. Ritenour, and Lyndon C. Taylor. 6 “TSR” is Total Shareholder Return including reinvested dividends. It is a measure of finance performance indicating the growth or decline in an investment’s value over a specified period. For 2025, the “Cumulative TSR” is measured from the last trading day of 2020 to the last day of 2025; for 2024, “Cumulative TSR” is measured from the last trading day of 2019 to the last day of 2024; for 2023, “Cumulative TSR” is measured from the last trading day of 2019 to the last trading day of 2023; for 2022, the range is the last trading day of 2019 to the last trading day of 2022; and for 2021, the range is the last trading day of 2019 to the last trading day of 2021. For Devon, Cumulative TSR for 2025, 2024, 2023, 2022, and 2021 was: 192%, 63%, 126%, 185%, and 91%, respectively. For the Peer Group, Cumulative TSR was 142%, 57%, 52%, 43%, and 21% for the same periods. |
7 The peer group for 2025, 2024, 2023 and 2022 was the SPDR S&P Oil & Gas Exploration & Production ETF (Symbol: XOP). The 2021 peer group was comprised of APA Corporation, ConocoPhillips, Continental Resources, Diamondback Energy, Inc., EOG Resources, Inc., Marathon Oil Corporation, Ovintiv, Inc., Pioneer Natural Resources Company, and the S&P Midcap 400 Index. Cimarex Energy Co. is excluded from this Cumulative TSR calculation due to its subsequent acquisition, and the S&P Midcap 400 is excluded due to incomparability on a market capitalized basis. 8 Post-Tax Net Income is disclosed in the Comprehensive Statements of Consolidated Earnings of the Original Filing as “Comprehensive earnings (loss) attributable to Devon.” 9 Cash Return on Capital Employed (CROCE) is an important financial measure used by the Company to link “compensation actually paid” to Company performance because of the importance of capital efficiency to successful operations in the oil and gas exploration and production industry. In Devon’s annual performance scorecard published in the “Annual Cash Incentives” section of this and prior Proxy Statements, CROCE was weighted as the joint-highest measure of performance on preset annual goals. The Company’s other important financial measures used to link “compensation actually paid” to Company performance are used to calculate Devon’s annual cash incentive and can be found on page 21. 10 The PvP Charts below illustrate the relationship between various performance measures and “Compensation Actually Paid.” |
PvP Table 2: Other Measures Important in Linking Performance to “Compensation Actually Paid”
Other Important Measures1 | ||||||||
Free Cash Flow(FCF) | | Health & | | Environmental | | Total Oil & Gas | | Total Capital |
1 These are the measures, in addition to CROCE, used to determine 2025 NEO annual cash incentive payments. For more information on performance, see section “Annual Cash Incentives” in this Amendment and similar disclosures in prior Proxy Statements. |
PvP Table 3: Converting Summary Compensation Table Total to “Compensation Actually Paid”1,2,3
| | | Subtract | | Subtract | | Add | | Add | | Equals | |||||||||
(-) | (-) | (+) | (+) | (=) | ||||||||||||||||
Year | Executive | SCT Total | Fair Value of | Change in | The Change in the | Pension | "Compensation | |||||||||||||
2025 |
| CEO-Gaspar | $ | 12,566 | $ | 9,634 | $ | 0 | $ | 10,728 | $ | 0 | $ | 13,660 | ||||||
| CEO-Muncrief | $ | 857 | $ | 0 | $ | 0 | $ | 390 | $ | 0 | $ | 1,247 | |||||||
| Other NEO Average | $ | 4,518 | $ | 2,312 | $ | 13 | $ | 2,644 | $ | 0 | $ | 4,837 | |||||||
2024 |
| CEO | $ | 17,040 | $ | 12,398 | $ | 0 | $ | 2,067 | $ | 0 | $ | 6,709 | ||||||
| Other NEO Average | $ | 6,194 | $ | 4,324 | $ | 1 | $ | 730 | $ | 0 | $ | 2,599 | |||||||
2023 |
| CEO | $ | 14,883 | $ | 11,422 | $ | 0 | $ | (2,647) | $ | 0 | $ | 814 | ||||||
| Other NEO Average | $ | 5,502 | $ | 4,012 | $ | 6 | $ | (279) | $ | 0 | $ | 1,204 | |||||||
2022 |
| CEO | $ | 14,525 | $ | 10,405 | $ | 0 | $ | 37,096 | $ | 0 | $ | 41,216 | ||||||
| Other NEO Average | $ | 5,374 | $ | 3,717 | $ | 0 | $ | 10,635 | $ | 0 | $ | 12,292 | |||||||
2021 |
| CEO-Muncrief | $ | 11,915 | $ | 8,311 | $ | 0 | $ | 44,455 | $ | 0 | $ | 48,059 | ||||||
| CEO-Hager | $ | 3,391 | $ | 712 | $ | 0 | $ | 29,610 | $ | 0 | $ | 32,289 | |||||||
| Other NEO Average | $ | 4,596 | $ | 1,881 | $ | 0 | $ | 12,436 | $ | 0 | $ | 15,151 | |||||||
1 Dollar amounts are shown in thousands, except where otherwise indicated. Amounts in parentheses are negative. References to Devon’s CEO are also references to its PEO for purposes of this section. 2 The CEO for each year is as follows: 2025: Clay M. Gaspar, from March 1st to the end of the year; Richard E. Muncrief, from January 1st to February 28th. After February 28th, Mr. Muncrief assumed the position of Special Advisor until his retirement in April 2025. 2024, 2023, 2022: Richard E. Muncrief. 2021: Richard E. Muncrief, from January 7th to the end of the year; David A. Hager, from January 1st to 6th. After January 6th, Mr. Hager assumed the position of Executive Chair of the Board of Directors until his retirement in early 2023. 3 The other NEOs for each year are as follows: 2025: Dennis C. Cameron, Tana K. Cashion, David G. Harris, John D. Raines, and Jeffrey L. Ritenour. 2024, 2023, 2022: Dennis C. Cameron, Clay M. Gaspar, David G. Harris, and Jeffrey L. Ritenour. 2022: Dennis C. Cameron, Clay M. Gaspar, David G. Harris, and Jeffrey L. Ritenour. 2021: Tana K. Cashion, Clay M. Gaspar, David G. Harris, Jeffrey L. Ritenour, and Lyndon C. Taylor. |
4 The process for determining the change in fair value under applicable financial accounting standards for stock-based compensation for this exhibit is substantially similar to that used for determining accounting value at the time of grant. For RSAs, the fair value is determined by multiplying the Fair Market Value of the underlying stock by the number of shares granted. For the interim calculations in this table, the product of the shares outstanding multiplied by the stock price at the beginning of the year (or at grant) is subtracted from the same calculation at the end of the year (or at vest). To determine grant value of PSUs, a Monte-Carlo simulation assimilating 10,000 potential outcomes is used. The Monte-Carlo simulation was rerun at the beginning and end of the year covered by this disclosure to create the interim valuations required. The table below reconciles the change in fair value of outstanding stock-based compensation awards for the period covered by this disclosure; amounts are shown in thousands. No awards were forfeited by NEOs during this period. Dividend equivalents earned on grants are included in the fair value of the awards and no other payments were made. |
2025 | 2024 | 2023 | 2022 | 2021 | ||||||||||||||||||||||||||||||||
| CEO– | | CEO– | | Other | | CEO | | Other | | CEO | | Other | | CEO | | Other | | CEO– | | CEO– | | Other | |||||||||||||
Year End Fair Value | $ | 10,490 | $ | 0 | $ | 2,518 | $ | 7,657 | $ | 2,671 | $ | 7,265 | $ | 2,552 | $ | 13,005 | $ | 4,533 | $ | 18,136 | $ | 1,555 | $ | 5,130 | ||||||||||||
Change in Fair Value | $ | 798 | $ | 1,760 | $ | 469 | $ | (4,077) | $ | (1,399) | $ | (7,388) | $ | (2,555) | $ | 15,003 | $ | 4,105 | $ | 24,292 | $ | 17,015 | $ | 5,653 | ||||||||||||
Change in Fair Value | $ | (561) | $ | (1,371) | $ | (343) | $ | (1,513) | $ | (541) | $ | (2,524) | $ | (276) | $ | 9,088 | $ | 1,997 | $ | 2,027 | $ | 11,040 | $ | 1,653 | ||||||||||||
Total Change in Fair Value | $ | 10,728 | $ | 390 | $ | 2,644 | $ | 2,067 | $ | 730 | $ | (2,647) | $ | (279) | $ | 37,096 | $ | 10,635 | $ | 44,455 | $ | 29,610 | $ | 12,436 | ||||||||||||
2025: Clay M. Gaspar, from March 1st to the end of the year; Richard E. Muncrief, from January 1st to February 28th. After February 28th, Mr. Muncrief assumed the position of Special Advisor until his retirement in April 2025.
2024, 2023, 2022: Richard E. Muncrief.
2021: Richard E. Muncrief, from January 7th to the end of the year; David A. Hager, from January 1st to 6th. After January 6th, Mr. Hager assumed the position of Executive Chair of the Board of Directors until his retirement in early 2023.
2025: Dennis C. Cameron, Tana K. Cashion, David G. Harris, John D. Raines, and Jeffrey L. Ritenour.
2024, 2023, 2022: Dennis C. Cameron, Clay M. Gaspar, David G. Harris, and Jeffrey L. Ritenour.
2021: Tana K. Cashion, Clay M. Gaspar, David G. Harris, Jeffrey L. Ritenour, and Lyndon C. Taylor.
| | | Subtract | | Subtract | | Add | | Add | | Equals | |||||||||
(-) | (-) | (+) | (+) | (=) | ||||||||||||||||
Year | Executive | SCT Total | Fair Value of | Change in | The Change in the | Pension | "Compensation | |||||||||||||
2025 |
| CEO-Gaspar | $ | 12,566 | $ | 9,634 | $ | 0 | $ | 10,728 | $ | 0 | $ | 13,660 | ||||||
| CEO-Muncrief | $ | 857 | $ | 0 | $ | 0 | $ | 390 | $ | 0 | $ | 1,247 | |||||||
| Other NEO Average | $ | 4,518 | $ | 2,312 | $ | 13 | $ | 2,644 | $ | 0 | $ | 4,837 | |||||||
2024 |
| CEO | $ | 17,040 | $ | 12,398 | $ | 0 | $ | 2,067 | $ | 0 | $ | 6,709 | ||||||
| Other NEO Average | $ | 6,194 | $ | 4,324 | $ | 1 | $ | 730 | $ | 0 | $ | 2,599 | |||||||
2023 |
| CEO | $ | 14,883 | $ | 11,422 | $ | 0 | $ | (2,647) | $ | 0 | $ | 814 | ||||||
| Other NEO Average | $ | 5,502 | $ | 4,012 | $ | 6 | $ | (279) | $ | 0 | $ | 1,204 | |||||||
2022 |
| CEO | $ | 14,525 | $ | 10,405 | $ | 0 | $ | 37,096 | $ | 0 | $ | 41,216 | ||||||
| Other NEO Average | $ | 5,374 | $ | 3,717 | $ | 0 | $ | 10,635 | $ | 0 | $ | 12,292 | |||||||
2021 |
| CEO-Muncrief | $ | 11,915 | $ | 8,311 | $ | 0 | $ | 44,455 | $ | 0 | $ | 48,059 | ||||||
| CEO-Hager | $ | 3,391 | $ | 712 | $ | 0 | $ | 29,610 | $ | 0 | $ | 32,289 | |||||||
| Other NEO Average | $ | 4,596 | $ | 1,881 | $ | 0 | $ | 12,436 | $ | 0 | $ | 15,151 | |||||||
1 Dollar amounts are shown in thousands, except where otherwise indicated. Amounts in parentheses are negative. References to Devon’s CEO are also references to its PEO for purposes of this section. 2 The CEO for each year is as follows: 2025: Clay M. Gaspar, from March 1st to the end of the year; Richard E. Muncrief, from January 1st to February 28th. After February 28th, Mr. Muncrief assumed the position of Special Advisor until his retirement in April 2025. 2024, 2023, 2022: Richard E. Muncrief. 2021: Richard E. Muncrief, from January 7th to the end of the year; David A. Hager, from January 1st to 6th. After January 6th, Mr. Hager assumed the position of Executive Chair of the Board of Directors until his retirement in early 2023. 3 The other NEOs for each year are as follows: 2025: Dennis C. Cameron, Tana K. Cashion, David G. Harris, John D. Raines, and Jeffrey L. Ritenour. 2024, 2023, 2022: Dennis C. Cameron, Clay M. Gaspar, David G. Harris, and Jeffrey L. Ritenour. 2022: Dennis C. Cameron, Clay M. Gaspar, David G. Harris, and Jeffrey L. Ritenour. 2021: Tana K. Cashion, Clay M. Gaspar, David G. Harris, Jeffrey L. Ritenour, and Lyndon C. Taylor. |
4 The process for determining the change in fair value under applicable financial accounting standards for stock-based compensation for this exhibit is substantially similar to that used for determining accounting value at the time of grant. For RSAs, the fair value is determined by multiplying the Fair Market Value of the underlying stock by the number of shares granted. For the interim calculations in this table, the product of the shares outstanding multiplied by the stock price at the beginning of the year (or at grant) is subtracted from the same calculation at the end of the year (or at vest). To determine grant value of PSUs, a Monte-Carlo simulation assimilating 10,000 potential outcomes is used. The Monte-Carlo simulation was rerun at the beginning and end of the year covered by this disclosure to create the interim valuations required. The table below reconciles the change in fair value of outstanding stock-based compensation awards for the period covered by this disclosure; amounts are shown in thousands. No awards were forfeited by NEOs during this period. Dividend equivalents earned on grants are included in the fair value of the awards and no other payments were made. |
2025 | 2024 | 2023 | 2022 | 2021 | ||||||||||||||||||||||||||||||||
| CEO– | | CEO– | | Other | | CEO | | Other | | CEO | | Other | | CEO | | Other | | CEO– | | CEO– | | Other | |||||||||||||
Year End Fair Value | $ | 10,490 | $ | 0 | $ | 2,518 | $ | 7,657 | $ | 2,671 | $ | 7,265 | $ | 2,552 | $ | 13,005 | $ | 4,533 | $ | 18,136 | $ | 1,555 | $ | 5,130 | ||||||||||||
Change in Fair Value | $ | 798 | $ | 1,760 | $ | 469 | $ | (4,077) | $ | (1,399) | $ | (7,388) | $ | (2,555) | $ | 15,003 | $ | 4,105 | $ | 24,292 | $ | 17,015 | $ | 5,653 | ||||||||||||
Change in Fair Value | $ | (561) | $ | (1,371) | $ | (343) | $ | (1,513) | $ | (541) | $ | (2,524) | $ | (276) | $ | 9,088 | $ | 1,997 | $ | 2,027 | $ | 11,040 | $ | 1,653 | ||||||||||||
Total Change in Fair Value | $ | 10,728 | $ | 390 | $ | 2,644 | $ | 2,067 | $ | 730 | $ | (2,647) | $ | (279) | $ | 37,096 | $ | 10,635 | $ | 44,455 | $ | 29,610 | $ | 12,436 | ||||||||||||
Value of a $100 Investment in Devon and the Peer Group Based on Cumulative TSR and “Compensation Actually Paid”1,2,3,4
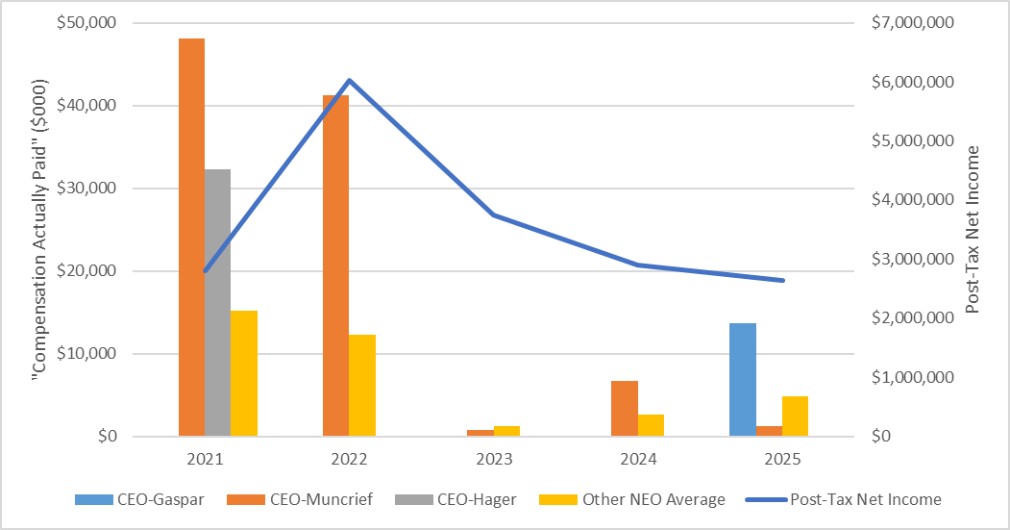
Post-Tax Net Income and “Compensation Actually Paid”1,2,3,6
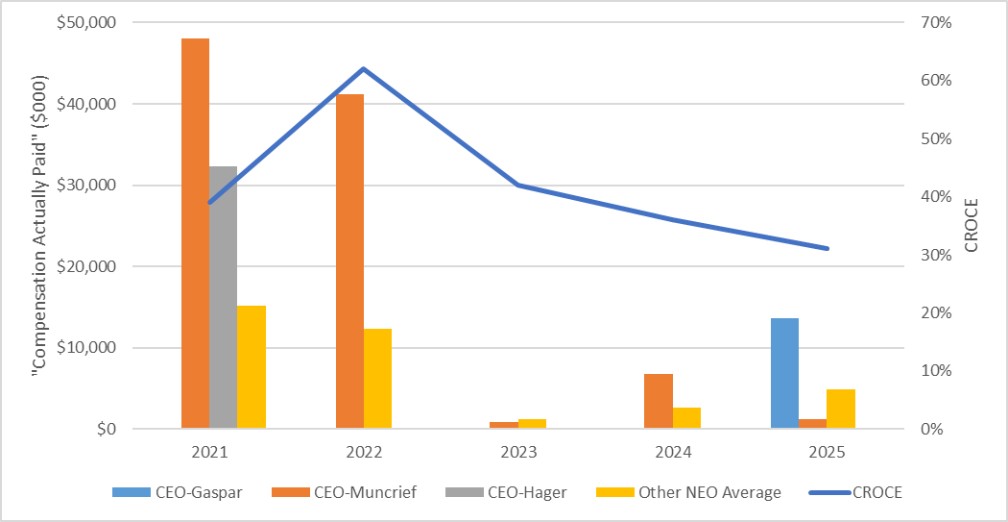
Cash Return on Capital Employed (CROCE) and “Compensation Actually Paid”1,2,3,5
Value of a $100 Investment in Devon and the Peer Group Based on Cumulative TSR and “Compensation Actually Paid”1,2,3,4
PvP Table 2: Other Measures Important in Linking Performance to “Compensation Actually Paid”
Other Important Measures1 | ||||||||
Free Cash Flow(FCF) | | Health & | | Environmental | | Total Oil & Gas | | Total Capital |
1 These are the measures, in addition to CROCE, used to determine 2025 NEO annual cash incentive payments. For more information on performance, see section “Annual Cash Incentives” in this Amendment and similar disclosures in prior Proxy Statements. |
2025 | 2024 | 2023 | 2022 | 2021 | ||||||||||||||||||||||||||||||||
| CEO– | | CEO– | | Other | | CEO | | Other | | CEO | | Other | | CEO | | Other | | CEO– | | CEO– | | Other | |||||||||||||
Year End Fair Value | $ | 10,490 | $ | 0 | $ | 2,518 | $ | 7,657 | $ | 2,671 | $ | 7,265 | $ | 2,552 | $ | 13,005 | $ | 4,533 | $ | 18,136 | $ | 1,555 | $ | 5,130 | ||||||||||||
Change in Fair Value | $ | 798 | $ | 1,760 | $ | 469 | $ | (4,077) | $ | (1,399) | $ | (7,388) | $ | (2,555) | $ | 15,003 | $ | 4,105 | $ | 24,292 | $ | 17,015 | $ | 5,653 | ||||||||||||
Change in Fair Value | $ | (561) | $ | (1,371) | $ | (343) | $ | (1,513) | $ | (541) | $ | (2,524) | $ | (276) | $ | 9,088 | $ | 1,997 | $ | 2,027 | $ | 11,040 | $ | 1,653 | ||||||||||||
Total Change in Fair Value | $ | 10,728 | $ | 390 | $ | 2,644 | $ | 2,067 | $ | 730 | $ | (2,647) | $ | (279) | $ | 37,096 | $ | 10,635 | $ | 44,455 | $ | 29,610 | $ | 12,436 | ||||||||||||