Pay vs Performance Disclosure - USD ($)
Dec. 31, 2025
Dec. 31, 2024
Dec. 31, 2023
Dec. 31, 2022
Dec. 31, 2021
The following table sets forth information regarding the total compensation, for services rendered in all capacities, that was paid to, awarded to or earned by our CEO (referred to below as our “PEO” or principal executive officer) (and on average to our non-CEO NEOs, or our “Other NEOs”), as compared to compensation actually paid (“CAP”) to our CEO (and on average to our Other NEOs) and certain Company and peer performance measures during the years ended December 31, 2025, 2024, 2023, 2022, and 2021, as calculated in accordance with Item 402(v) of Regulation S-K (the “Pay Versus Performance Table”):
| Value of Initial Fixed $100 Investment Based on: | ||||||||||||||||||||||||||||||||||||||||||||
| Year | Summary Compensation Table Total for PEO ($) | Compensation Actually Paid to PEO ($)(1) | Average Summary Compensation Table Total for Other NEOs ($) | Average Compensation Actually Paid to Other NEOs ($)(1) | Total Shareholder Return ($)(2) | Peer Group Total Shareholder Return ($)(3) | Net Income ($) | |||||||||||||||||||||||||||||||||||||
| 2025 | 7,223,065 | 20,353,965 | 2,407,312 | 4,865,316 | 103.23 | 119.92 | (16,141,000) | |||||||||||||||||||||||||||||||||||||
| 2024 | 3,689,490 | 11,213,466 | 2,725,870 | 5,020,816 | 49.52 | 90.58 | (140,039,000) | |||||||||||||||||||||||||||||||||||||
| 2023 | 4,935,266 | (1,156,797) | 1,622,096 | 231,716 | 11.48 | 91.84 | (262,140,000) | |||||||||||||||||||||||||||||||||||||
| 2022 | 4,581,555 | 2,422,054 | 2,310,749 | 1,326,466 | 52.61 | 88.53 | (311,458,000) | |||||||||||||||||||||||||||||||||||||
| 2021 | 4,824,123 | 441,904 | 3,070,296 | 1,021,432 | 73.73 | 99.37 | (206,356,000) | |||||||||||||||||||||||||||||||||||||
| Year | Other NEOs | |||||||
| 2025 | Latha Vairavan, Patrick Burnett, L. Todd Edwards, Masaru Matsuda, and David Topper(a.) | |||||||
| 2024 | David Topper, Patrick Burnett, L. Todd Edwards, Masaru Matsuda, and John Smither | |||||||
| 2023 | Patrick Burnett and L. Todd Edwards | |||||||
| 2022 | Masaru Matsuda, Patrick Burnett, Kenneth Lock, and Scott Burrows | |||||||
| 2021 | Matthew Moore, Scott Burrows, Patrick Burnett, David Osborne, and John Smither | |||||||
a.Mr. Topper retired from the Company in May 2025 and therefore his compensation included in the average NEO’s may not be comparable to the other NEO’s. He received prorated salary and severance payments, did not receive a 2025 bonus payment, and forfeited his outstanding equity awards, which are not representative of other NEO’s compensation. See following “Executive Compensation Table”.
CAP to our NEOs represents the “Total” compensation reported in the Summary Compensation Table for the applicable fiscal year, as adjusted as follows:
| 2025 | ||||||||
Adjustments | PEO | Average Other NEOs | ||||||
Deduction for Amounts Reported under the “Stock Awards” and “Option Awards” Columns in the Summary Compensation Table for Applicable FY | $ | (5,916,148) | $ | (1,641,429) | ||||
Increase based on ASC 718 Fair Value of Awards Granted during Applicable FY that Remain Unvested as of Applicable FY End, determined as of Applicable FY End | $ | 11,348,315 | $ | 2,634,888 | ||||
Increase based on ASC 718 Fair Value of Awards Granted during Applicable FY that Vested during Applicable FY, determined as of Vesting Date | $ | 868,083 | $ | 203,256 | ||||
Increase/deduction for Awards Granted during Prior FY that were Outstanding and Unvested as of Applicable FY End, determined based on change in ASC 718 Fair Value from Prior FY End to Applicable FY End | $ | 6,326,268 | $ | 1,821,731 | ||||
Increase/deduction for Awards Granted during Prior FY that Vested During Applicable FY, determined based on change in ASC 718 Fair Value from Prior FY End to Vesting Date | $ | 504,382 | $ | 191,160 | ||||
Deduction for Awards Granted during Applicable FY that were forfeited during Applicable FY, determined as of prior FY End (b.) | $ | — | $ | (751,602) | ||||
TOTAL ADJUSTMENTS | $ | 13,130,900 | $ | 2,458,004 | ||||
b.Forfeitures as a result of the departure of our prior CFO, David Topper.
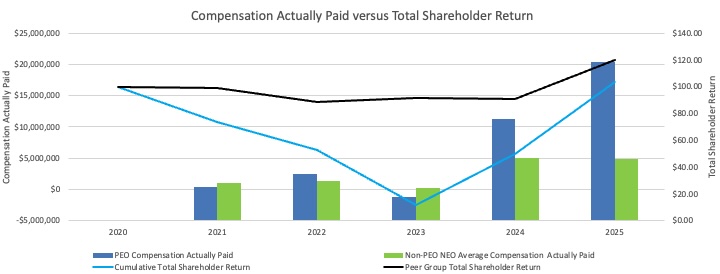
The graphs below compare the CAP to our CEO and the average of the CAP to our Other NEOs, with (i) our cumulative TSR and (ii) our net income, in each case, for the fiscal years ended December 31, 2021, 2022, 2023, 2024 and 2025. CAP is influenced by numerous factors including, but not limited to, the timing of new grant issuances and award vesting, NEO mix, share price volatility during the fiscal year, our mix of performance metrics and other factors.
TSR amounts reported in the graph assume an initial fixed investment of $100 was invested for the period starting December 31, 2020 through the end of the listed year in the Company and our Peer Group.
Although Item 402(v) of Regulation S-K requires the description of the relationship between the compensation actually paid for our NEOs and our net income, we do not currently utilize GAAP or non-GAAP net income as a performance measure in any of our incentive programs. As a result, the impact of year-over-year fluctuations in our net income has less of an impact on compensation actually paid. The key factor that drove the changes in compensation actually paid is the fluctuation of our stock price.
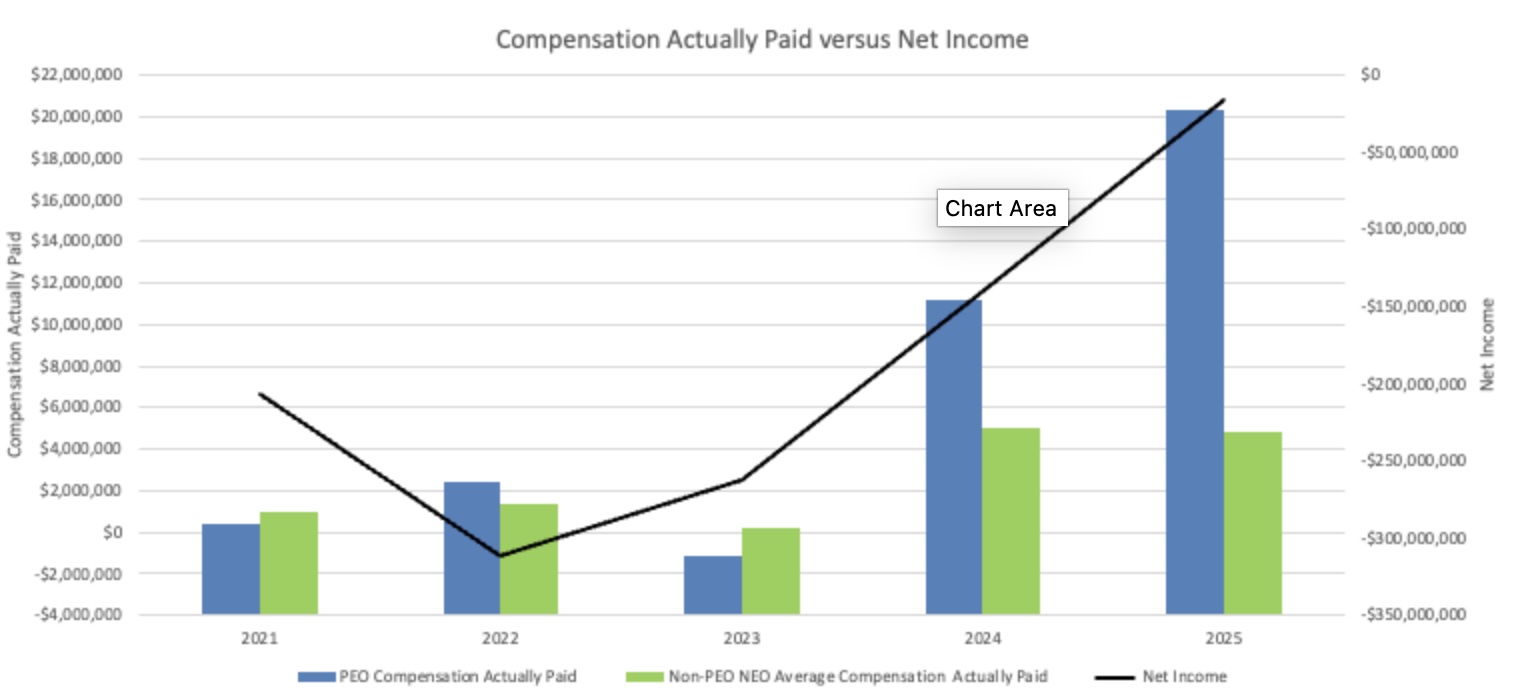
Pay Versus Performance Tabular List
In the years covered by this table, we did not use financial performance measures for our short or long-term incentive compensation for our NEOs. As described in more detail in “Executive Compensation – Compensation Discussion and Analysis,” our executive compensation program reflects a variable “pay-for-performance” philosophy. Since our initial public offering in 2020, we have not used financial or other performance measures to align executive compensation with our performance. Therefore, this analysis only covers the performance measures presented in the Pay-Versus-Performance Table. Moreover, while we generally seek to prioritize long-term performance as our primary incentive for our CEO and our other NEOs, we do not specifically align our performance measures with compensation that is actually paid (as computed in accordance with Item 402(v) of Regulation S-K) for a particular year.