v3.26.1
Pay vs Performance Disclosure - USD ($)
6 Months Ended 12 Months Ended 30 Months Ended
Jun. 30, 2023
Dec. 31, 2025
Dec. 31, 2024
Dec. 31, 2023
Dec. 31, 2022
Dec. 31, 2021
Dec. 31, 2025
Pay vs Performance Disclosure              
Pay vs Performance Disclosure, Table  

Pay Versus Performance

As required by Section 953(a) of the Dodd-Frank Act, and Item 402(v) of Regulation S-K, we are providing the following information about the relationship between executive compensation actually paid and certain financial performance measures of the Company. You should refer to “Compensation Discussion and Analysis” for a complete description of how executive compensation relates to Company performance and how the Talent and Compensation Committee makes its decisions.


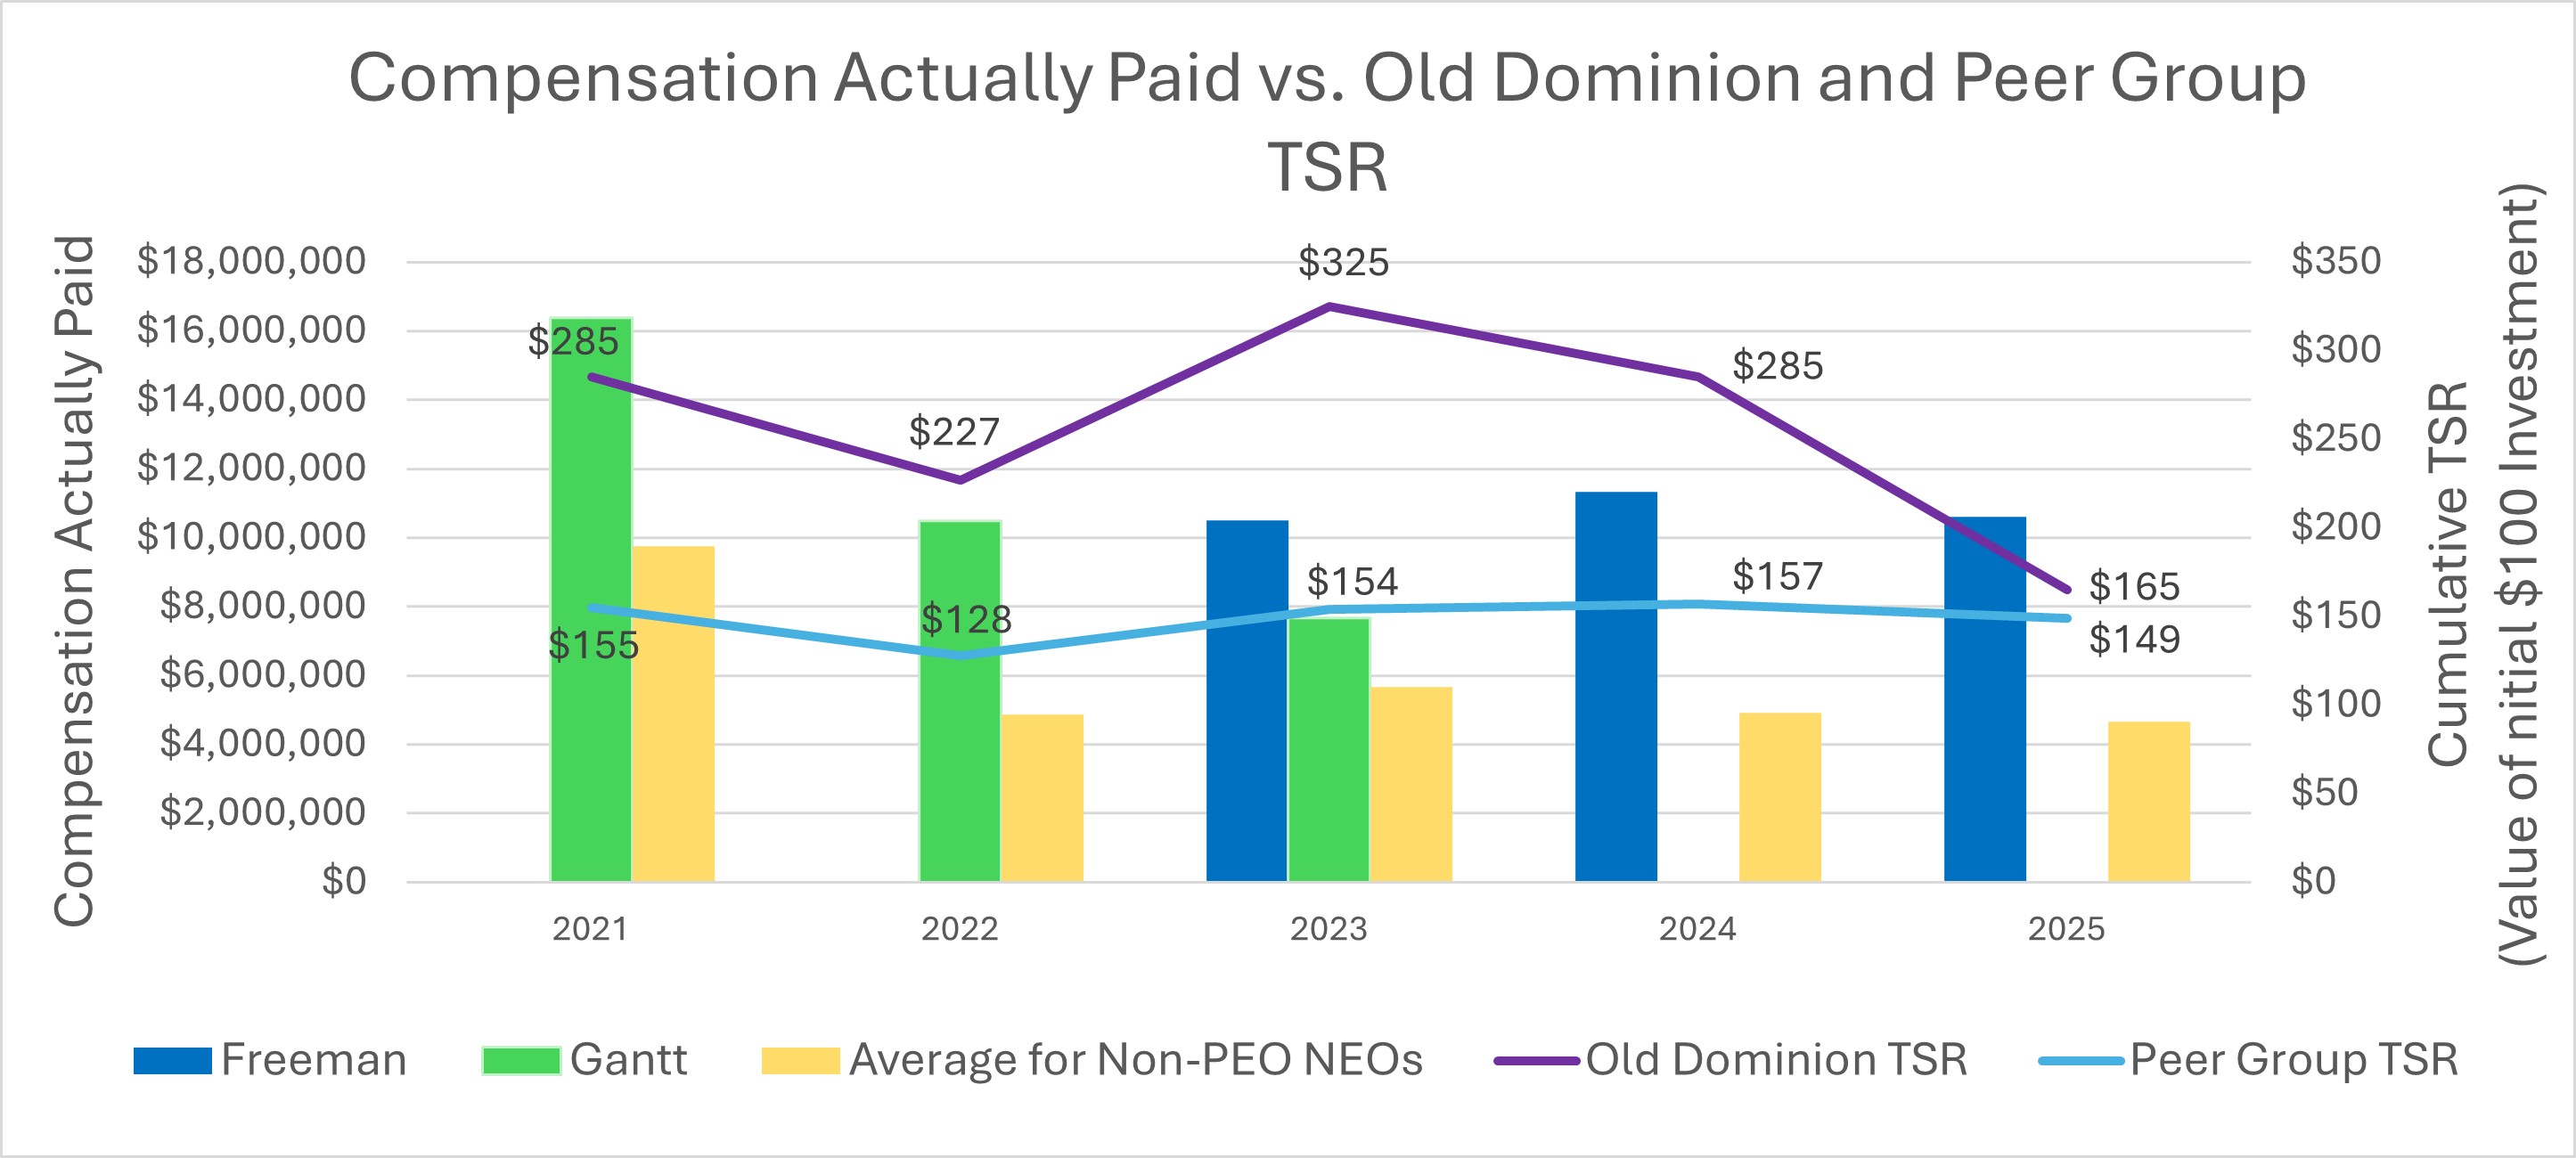
Value of Initial Fixed $100 Investment Based On:


Year

Summary Compensation Table Total for Gantt ($)(1)

Summary Compensation Table Total for Freeman
 ($)
(1)

Compensation Actually Paid to Gantt ($)(2)

Compensation Actually Paid to Freeman ($)(3)

Average Summary Compensation Table Total for Non-PEO Named Executive Officers ($)(4)

Average Compensation Actually Paid to Non-PEO Named Executive Officers ($)(5)

Total Shareholder Return ($)(6)

Peer Group Total Shareholder Return
($)
(7)

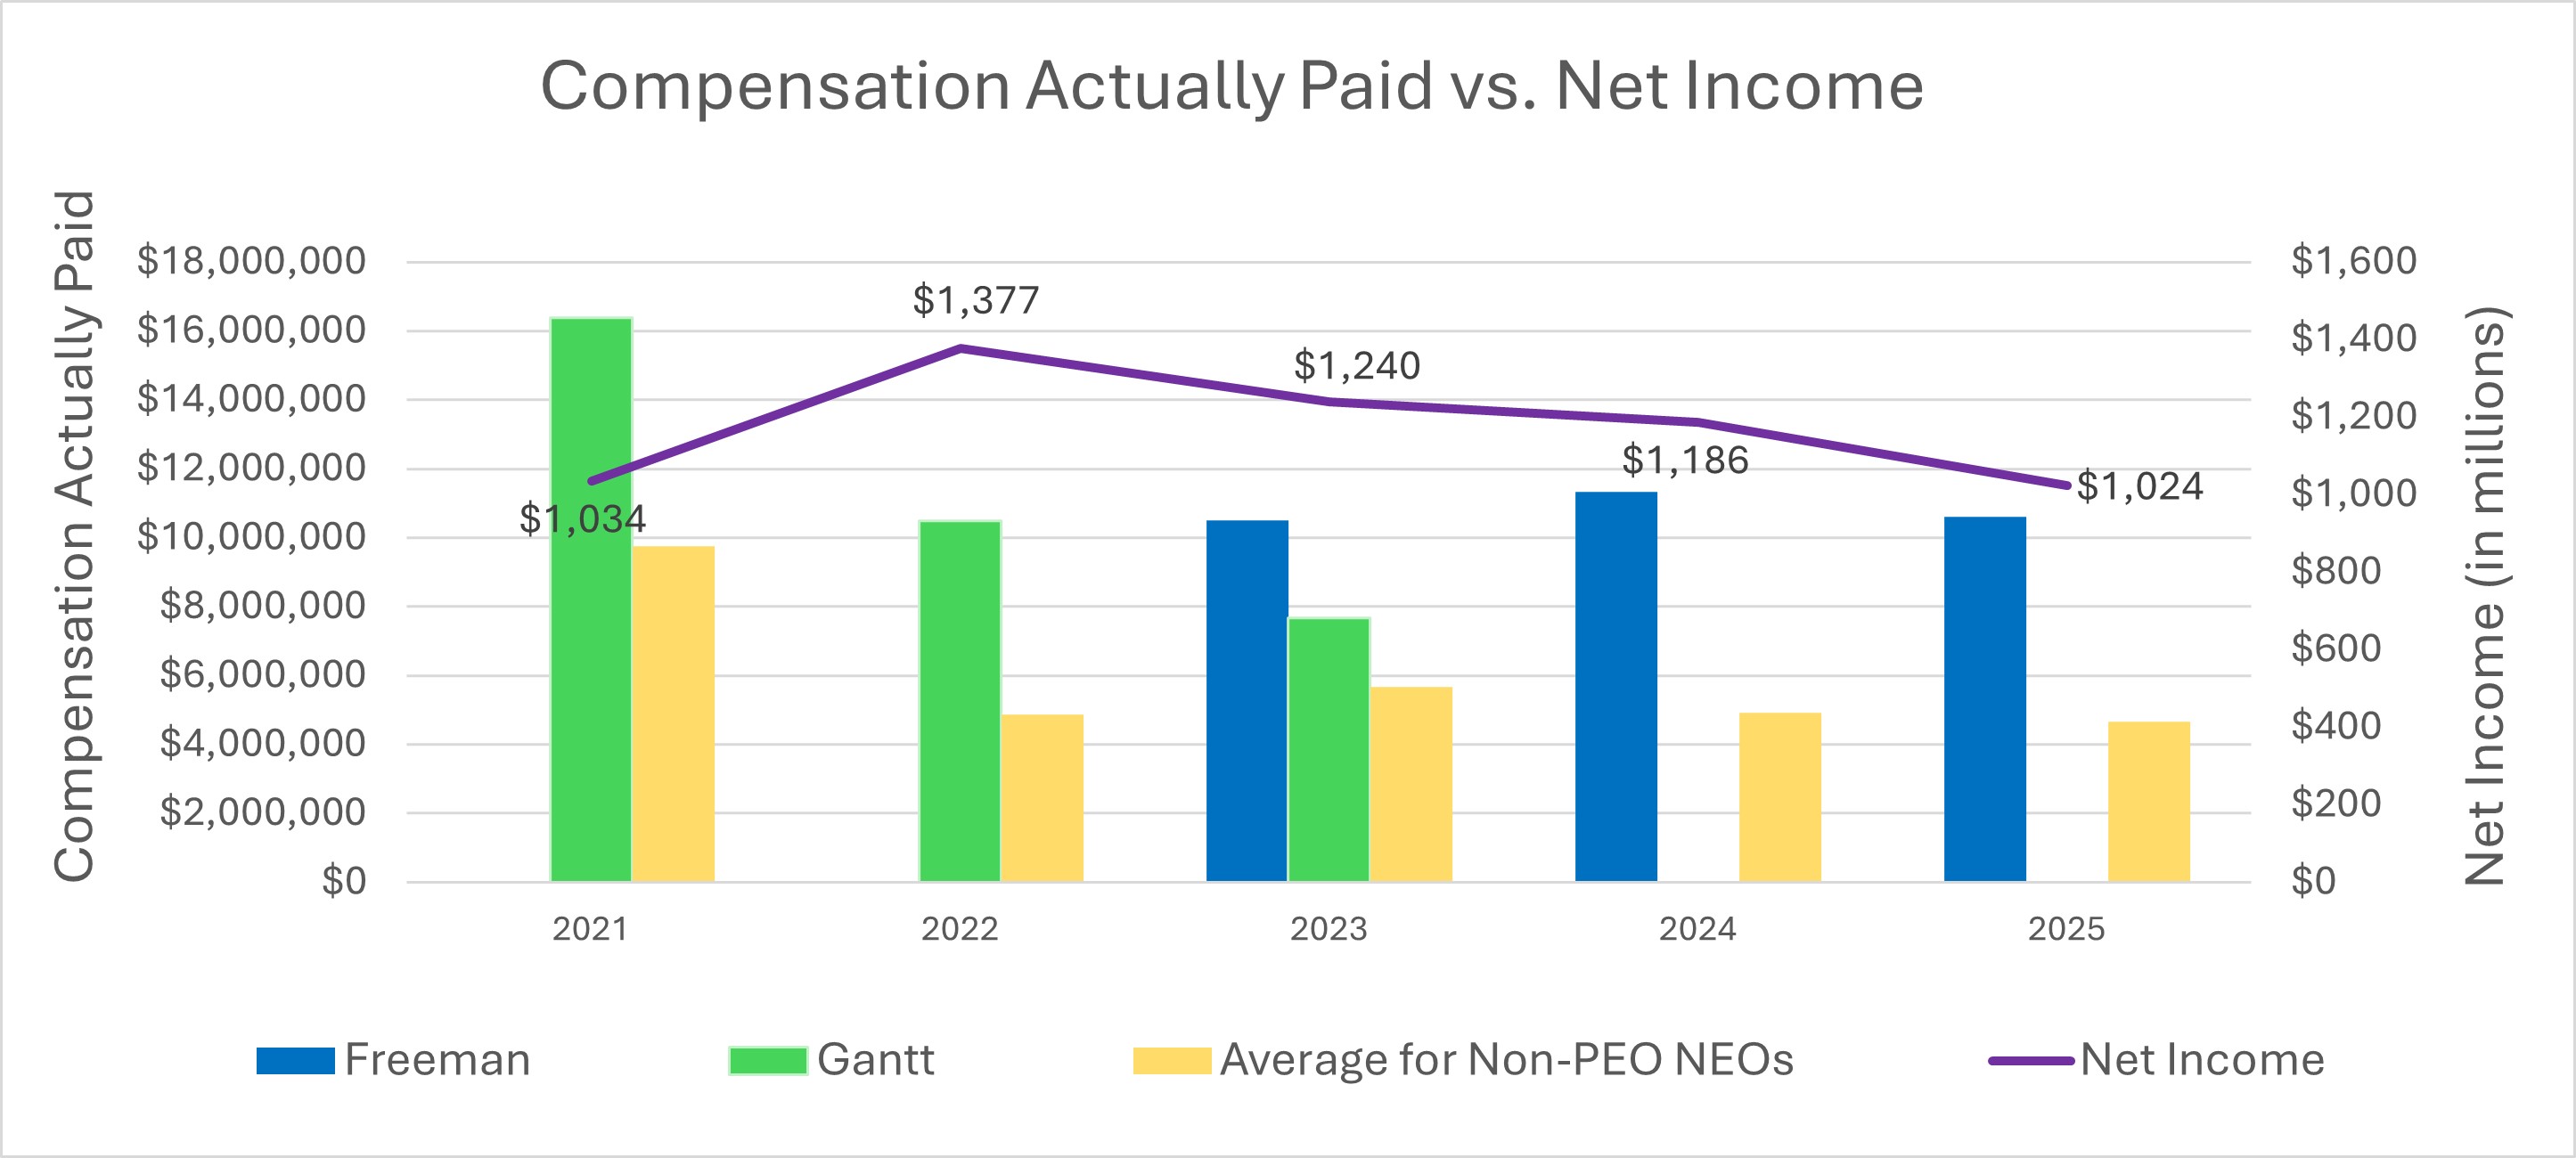
Net Income (in thousands) ($)
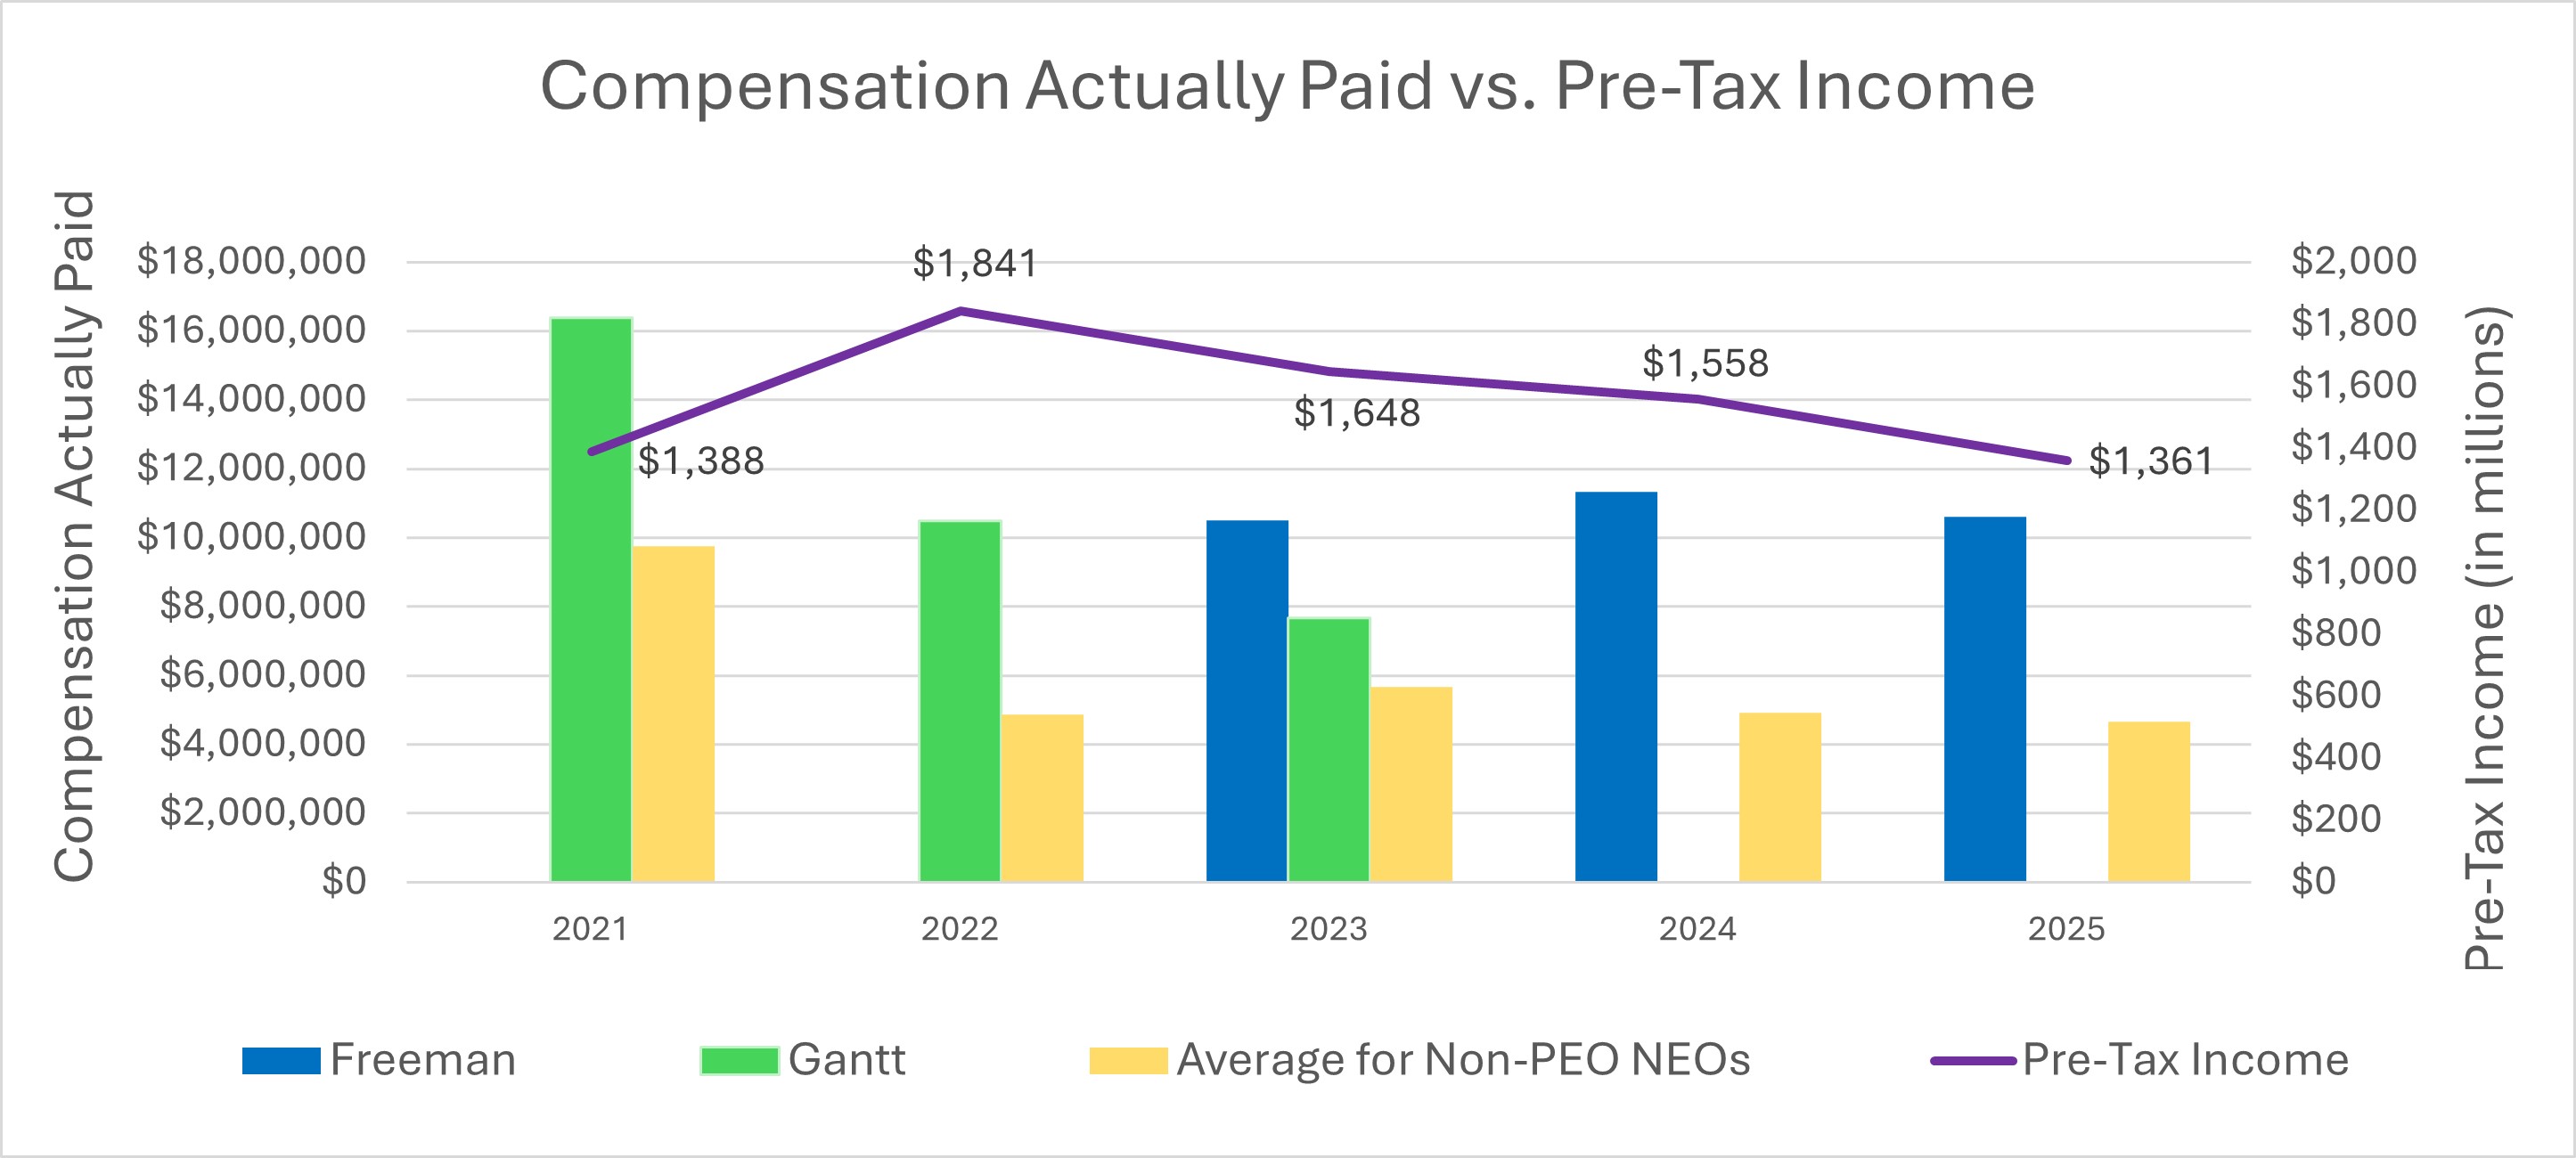
Pre-Tax
Income (in thousands) ($)
(8)

2025


11,615,896


10,595,479


5,150,687


4,657,633


165


149


1,023,703


1,361,308


2024


12,622,664


11,335,630


5,552,588


4,921,341


285


157


1,186,073


1,557,597


2023


11,296,746


9,496,611


7,675,675


10,515,744


4,994,889


5,671,123


325


154


1,239,502


1,647,776


2022


12,828,375


10,494,358


6,184,287


4,864,545


227


128


1,377,159


1,841,349


2021


10,577,833


16,385,495


5,983,437


9,749,517


285


155


1,034,375


1,388,423


Mr. Freeman has served as our Chief Executive Officer since July 1, 2023.
         
Company Selected Measure Name   Pre-Tax Income          
Named Executive Officers, Footnote  
(4)
The dollar amounts reported in this column represent the average of the amounts reported for the Company’s named executive officers as a group (excluding Mr. Gantt for 2021 and 2022 and through June 30, 2023, and Mr. Freeman since July 1, 2023) in the “Total” column of the Summary Compensation Table in each applicable year. The names of each of the named executive officers (excluding Mr. Gantt for 2021 and 2022 and through June 30, 2023, and Mr. Freeman since July 1, 2023) included for purposes of calculating the average amounts in each applicable year are as follows: (i) for 2025, 2024 and 2023, Messrs. Satterfield, Plemmons, Overbey and Parr; and (ii) for 2022 and 2021, Mr. David S. Congdon and Messrs. Satterfield, Freeman and Plemmons.
         
Peer Group Issuers, Footnote  
(7)
Represents the weighted peer group TSR, weighted according to the respective companies’ stock market capitalization at the beginning of each period for which a return is indicated. The peer group used for this purpose was the Dow Jones Transportation Average for all years presented in the table.
         
Adjustment To PEO Compensation, Footnote  
(2)
The dollar amounts reported in this column represent the amount of “compensation actually paid” to Mr. Gantt, as computed in accordance with Item 402(v). The dollar amounts do not reflect the actual amount of compensation earned by or paid to Mr. Gantt during the applicable year. In accordance with the requirements of Item 402(v), the following adjustments were made to Mr. Gantt’s total compensation for each year to determine the compensation actually paid:


Year

Reported
Summary Compensation Table Total for Gantt ($)

Reported
Value of Equity Awards ($)
(a)

Equity
Award Adjustments ($)
(b)

Compensation Actually Paid to Gantt ($)

2025


2024


2023


11,296,746


(5,927,559

)


2,306,488


7,675,675


2022


12,828,375


(2,578,625

)


244,608


10,494,358


2021


10,577,833


(1,975,247

)


7,782,909


16,385,495


(3)
The dollar amounts reported in this column represent the amount of “compensation actually paid” to Mr. Freeman, as computed in accordance with Item 402(v) for his service as CEO during 2023, 2024 and 2025. The dollar amounts do not reflect the actual amount of compensation earned by or paid to Mr. Freeman during his service as CEO in 2023, 2024 and 2025. In accordance with the requirements of Item 402(v), the following adjustments were made to Mr. Freeman’s total compensation for each year to determine the compensation actually paid:


Year

Reported
Summary Compensation Table Total for Freeman ($)

Reported
Value of Equity Awards ($)
(a)

Equity
Award Adjustments ($)
(b)

Compensation Actually Paid to Freeman ($)

2025


11,615,896


(2,377,606

)


1,357,189


10,595,479


2024


12,622,664


(2,251,915

)


964,881


11,335,630


2023


9,496,611


(1,113,075

)


2,132,208


10,515,744


Non-PEO NEO Average Total Compensation Amount   $ 5,150,687 $ 5,552,588 $ 4,994,889 $ 6,184,287 $ 5,983,437  
Non-PEO NEO Average Compensation Actually Paid Amount   $ 4,657,633 4,921,341 5,671,123 4,864,545 9,749,517  
Adjustment to Non-PEO NEO Compensation Footnote  

Year

Average Reported Summary Compensation Table Total for Non-PEO NEOs ($)

Average
Reported
Value of Equity Awards ($)

Average Equity
Award Adjustments ($)
(a)

Average Compensation Actually Paid to Non-PEO NEOs ($)

2025


5,150,687


(1,231,851

)


738,797


4,657,633


2024


5,552,588


(1,189,851

)


558,604


4,921,341


2023


4,994,889


(789,283

)


1,465,517


5,671,123


2022


6,184,287


(1,012,865

)


(306,877

)


4,864,545


2021


5,983,437


(1,237,056

)


5,003,136


9,749,517


Equity Valuation Assumption Difference, Footnote   The amounts deducted or added in calculating the equity award adjustments are as follows:


Year

Year End Fair Value of Equity Awards ($)

Year over Year Change in Fair Value of Outstanding and Unvested Equity Awards ($)

Fair Value as of Vesting Date of Equity Awards Granted and Vested in the Year ($)

Year over Year Change in Fair Value of Equity Awards Granted in Prior Years that Vested in the Year ($)

Fair Value at the End of the Prior Year of Equity Awards that Failed to Meet Vesting Conditions in the Year ($)

Value of Dividends or other Earnings Paid on Stock or Option Awards not Otherwise Reflected in Fair Value or Total Compensation ($)

Total
Equity
Award Adjustments ($)

2025


2024


2023


181,993


(i)


4,066,217


(ii)


708,783


(2,650,505

)

(iii)


2,306,488


2022


2,344,590


(1,459,624

)


(648,995

)


8,637


244,608


2021


4,121,370


3,520,877


134,605


6,057


7,782,909


(i)
The amount reflects a pro rata RSA grant of 898 shares received by Mr. Gantt for his service as a non-employee director beginning July 1, 2023 (following his retirement as our President and Chief Executive Officer effective June 30, 2023).
(ii)
This amount reflects the accelerated vesting on June 23, 2023, of an aggregate of 24,898 shares subject to Mr. Gantt’s outstanding unvested RSAs and outstanding earned and unvested PBRSUs in connection with his retirement from the Company as discussed above.
(iii)
This amount reflects 18,680 shares of outstanding unvested RSAs and outstanding earned and unvested PBRSUs granted in 2021 and 2022 that were forfeited in 2023 due to the accelerated vesting of these shares on June 23, 2023, in connection with Mr. Gantt’s retirement from the Company as discussed above.
(b)
The amounts deducted or added in calculating the equity award adjustments are as follows:


Year

Year End Fair Value of Equity Awards ($)

Year over Year Change in Fair Value of Outstanding and Unvested Equity Awards ($)

Fair Value as of Vesting Date of Equity Awards Granted and Vested in the Year ($)

Year over Year Change in Fair Value of Equity Awards Granted in Prior Years that Vested in the Year ($)

Fair Value at the End of the Prior Year of Equity Awards that Failed to Meet Vesting Conditions in the Year ($)

Value of Dividends or other Earnings Paid on Stock or Option Awards not Otherwise Reflected in Fair Value or Total Compensation ($)

Total
Equity
Award
Adjustments ($)

2025


1,314,050


(98,509

)


141,648


1,357,189


2024


970,200


(166,447

)


161,128


964,881


2023


826,873


790,440


514,895


2,132,208


Compensation Actually Paid vs. Total Shareholder Return  

img45760081_1.jpg

         
Compensation Actually Paid vs. Net Income  

img45760081_2.jpg

         
Compensation Actually Paid vs. Company Selected Measure  

img45760081_3.jpg

         
Total Shareholder Return Vs Peer Group  

img45760081_1.jpg

         
Tabular List, Table  

Financial Performance Measures


As described in greater detail in “Compensation Discussion and Analysis,” our executive compensation program reflects a pay-for-performance philosophy. The metrics that the Company uses for both our long-term and short-term incentive awards are selected based on an objective of incentivizing our named executive officers to increase the value of our enterprise for our shareholders. The most important financial performance measures used by the Company to link executive compensation actually paid to the Company’s named executive officers, for the most recently completed fiscal year, to the Company’s performance are as follows:


Most Important Financial Performance Measures

Pre-Tax Income

Three-Year Relative TSR

Operating Ratio


Total Shareholder Return Amount   $ 165 285 325 227 285  
Peer Group Total Shareholder Return Amount   $ 149 $ 157 $ 154 $ 128 $ 155  
Company Selected Measure Amount   1,361,308,000 1,557,597,000 1,647,776,000 1,841,349,000 1,388,423,000  
PEO Name Mr. Gantt       Mr. Gantt Mr. Gantt Mr. Freeman
Additional 402(v) Disclosure  
(5)
The dollar amounts reported in this column represent the average amount of “compensation actually paid” to the named executive officers as a group (excluding Mr. Gantt for 2021, 2022 and through June 30, 2023, and Mr. Freeman since July 1, 2023), as computed in accordance with Item 402(v). The dollar amounts do not reflect the actual average amount of compensation earned by or paid to the named executive officers as a group (excluding Mr. Gantt for 2021 and 2022 and through June 30, 2023, and Mr. Freeman since July 1, 2023) during the applicable year. The names of each of the named executive officers (excluding Mr. Gantt for 2021, 2022 and through June 30, 2023, and Mr. Freeman since July 1, 2023) included for purposes of calculating the average amounts in each applicable year are as follows: (i) for 2025, 2024 and 2023, Messrs. Satterfield, Plemmons, Overbey and Parr; and (ii) for 2022 and 2021, Mr. David S. Congdon and Messrs. Satterfield, Freeman and Plemmons. In accordance with the requirements of Item 402(v), the following adjustments were made to average total compensation for the named executive officers as a group (excluding Mr. Gantt for 2021 and 2022 and through June 30, 2023, and Mr. Freeman since July 1, 2023) for each year to determine the compensation actually paid, using the same methodology described in footnote 2 above:
         
Net Income   $ 1,023,703,000 $ 1,186,073,000 $ 1,239,502,000 $ 1,377,159,000 $ 1,034,375,000  
Measure:: 1              
Pay vs Performance Disclosure              
Name   Pre-Tax Income          
Measure:: 2              
Pay vs Performance Disclosure              
Name   Three-Year Relative TSR          
Measure:: 3              
Pay vs Performance Disclosure              
Name   Operating Ratio          
Gantt [Member]              
Pay vs Performance Disclosure              
PEO Total Compensation Amount   $ 0 0 11,296,746 12,828,375 10,577,833  
PEO Actually Paid Compensation Amount   0 0 7,675,675 10,494,358 16,385,495  
Freeman [Member]              
Pay vs Performance Disclosure              
PEO Total Compensation Amount   11,615,896 12,622,664 9,496,611      
PEO Actually Paid Compensation Amount   10,595,479 11,335,630 10,515,744      
PEO | Gantt [Member]              
Pay vs Performance Disclosure              
Adjustment Value of Equity Awards   0 0 (5,927,559) (2,578,625) (1,975,247)  
Adjustment Equity Awards   0 0 2,306,488 244,608 7,782,909  
PEO | Gantt [Member] | Year End Fair Value of Equity Awards [Member]              
Pay vs Performance Disclosure              
Adjustment Equity Awards   0 0 181,993 2,344,590 4,121,370  
PEO | Gantt [Member] | Year over Year Change in Fair Value of Outstanding and Unvested Equity Awards [Member]              
Pay vs Performance Disclosure              
Adjustment Equity Awards   0 0 0 (1,459,624) 3,520,877  
PEO | Gantt [Member] | Fair Value as of Vesting Date of Equity Awards Granted and Vested in the Year [Member]              
Pay vs Performance Disclosure              
Adjustment Equity Awards   0 0 4,066,217 0 0  
PEO | Gantt [Member] | Year over Year Change in Fair Value of Equity Awards Granted in Prior Years that Vested in the Year [Member]              
Pay vs Performance Disclosure              
Adjustment Equity Awards   0 0 708,783 (648,995) 134,605  
PEO | Gantt [Member] | Fair Value at the End of the Prior Year of Equity Awards that Failed to Meet Vesting Conditions in the Year [Member]              
Pay vs Performance Disclosure              
Adjustment Equity Awards   0 0 (2,650,505) 0 0  
PEO | Gantt [Member] | Value of Dividends or other Earnings Paid on Stock or Option Awards not Otherwise Reflected in Fair Value or Total Compensation [Member]              
Pay vs Performance Disclosure              
Adjustment Equity Awards   0 0 0 8,637 6,057  
PEO | Freeman [Member]              
Pay vs Performance Disclosure              
Adjustment Value of Equity Awards   (2,377,606) (2,251,915) (1,113,075)      
Adjustment Equity Awards   1,357,189 964,881 2,132,208      
PEO | Freeman [Member] | Year-end Fair Value of Equity Awards Granted in Covered Year that are Outstanding and Unvested              
Pay vs Performance Disclosure              
Adjustment Equity Awards   1,314,050 970,200 826,873      
PEO | Freeman [Member] | Year-over-Year Change in Fair Value of Equity Awards Granted in Prior Years That are Outstanding and Unvested              
Pay vs Performance Disclosure              
Adjustment Equity Awards   (98,509) (166,447) 790,440      
PEO | Freeman [Member] | Vesting Date Fair Value of Equity Awards Granted and Vested in Covered Year              
Pay vs Performance Disclosure              
Adjustment Equity Awards   0 0 0      
PEO | Freeman [Member] | Change in Fair Value as of Vesting Date of Prior Year Equity Awards Vested in Covered Year              
Pay vs Performance Disclosure              
Adjustment Equity Awards   141,648 161,128 514,895      
PEO | Freeman [Member] | Prior Year End Fair Value of Equity Awards Granted in Any Prior Year that Fail to Meet Applicable Vesting Conditions During Covered Year              
Pay vs Performance Disclosure              
Adjustment Equity Awards   0 0 0      
PEO | Freeman [Member] | Dividends or Other Earnings Paid on Equity Awards not Otherwise Reflected in Total Compensation for Covered Year              
Pay vs Performance Disclosure              
Adjustment Equity Awards   0 0 0      
Non-PEO NEO              
Pay vs Performance Disclosure              
Adjustment Value of Equity Awards   (1,231,851) (1,189,851) (789,283) (1,012,865) (1,237,056)  
Adjustment Equity Awards   738,797 558,604 1,465,517 (306,877) 5,003,136  
Non-PEO NEO | Year-end Fair Value of Equity Awards Granted in Covered Year that are Outstanding and Unvested              
Pay vs Performance Disclosure              
Adjustment Equity Awards   711,587 572,595 667,680 920,299 2,559,819  
Non-PEO NEO | Year-over-Year Change in Fair Value of Equity Awards Granted in Prior Years That are Outstanding and Unvested              
Pay vs Performance Disclosure              
Adjustment Equity Awards   (63,925) (115,510) 478,724 (788,746) 2,344,205  
Non-PEO NEO | Vesting Date Fair Value of Equity Awards Granted and Vested in Covered Year              
Pay vs Performance Disclosure              
Adjustment Equity Awards   0 0 0 0 0  
Non-PEO NEO | Change in Fair Value as of Vesting Date of Prior Year Equity Awards Vested in Covered Year              
Pay vs Performance Disclosure              
Adjustment Equity Awards   91,135 101,519 319,113 (444,787) 94,849  
Non-PEO NEO | Prior Year End Fair Value of Equity Awards Granted in Any Prior Year that Fail to Meet Applicable Vesting Conditions During Covered Year              
Pay vs Performance Disclosure              
Adjustment Equity Awards   0 0 0 0 0  
Non-PEO NEO | Dividends or Other Earnings Paid on Equity Awards not Otherwise Reflected in Total Compensation for Covered Year              
Pay vs Performance Disclosure              
Adjustment Equity Awards   $ 0 $ 0 $ 0 $ 6,357 $ 4,264