Pay vs Performance Disclosure - USD ($)
Dec. 31, 2025
Dec. 31, 2024
Dec. 31, 2023
Dec. 31, 2022
Dec. 31, 2021
Pay versus Performance Table
The following table sets forth additional compensation information for our principal executive officer (“PEO”), Mr. Kramer, and our NEOs other than Mr. Kramer
(“Non-PEO
NEOs”), calculated in accordance with applicable SEC rules, for fiscal years 2025, 2024, 2023, 2022 and 2021. | Year |
Summary Compensation Table Total for PEO ($) (1) |
Compensation Actually Paid to PEO ($) (2) |
Average Summary Compensation Table Total for Non-PEO NEOs($) (3) |
Average Compensation Actually Paid to Non-PEO NEOs ($) (2)(3) |
Value of Initial Fixed $100 Investment Based on: |
|||||||||||||||||||||||||||
Total Shareholder Return (BFAM) (4) |
Peer Group Total Shareholder Return (Russell Midcap Growth Index) (4) |
Net Income ($) (5) |
Adjusted EBITDA ($) (6) |
|||||||||||||||||||||||||||||
(in thousands) |
||||||||||||||||||||||||||||||||
| 2025 (*) |
5,303,738 |
4,174,363 |
1,906,755 |
1,587,056 |
$ |
58.58 |
$ |
137.95 |
193,116 |
487,442 |
||||||||||||||||||||||
| 2024 (*) |
5,154,263 |
6,639,460 |
1,833,876 |
2,236,059 |
$ |
64.05 |
$ |
126.96 |
140,191 |
409,286 |
||||||||||||||||||||||
| 2023 (*) |
4,927,814 |
8,111,323 |
1,706,797 |
2,796,763 |
$ |
54.46 |
$ |
103.97 |
74,223 |
352,117 |
||||||||||||||||||||||
| 2022 (*) |
3,258,891 |
(3,276,385 |
) |
1,437,903 |
(519,387 |
) |
$ |
36.47 |
$ |
82.61 |
80,641 |
316,994 |
||||||||||||||||||||
| 2021 |
4,237,306 |
(70,237 |
) |
1,507,741 |
88,941 |
$ |
72.76 |
$ |
112.73 |
70,459 |
272,068 |
|||||||||||||||||||||
(*) |
Amounts reported for Ms. Marshall are converted from British pounds to U.S. dollars using the following average exchange rates: 1.3181 U.S. dollars per 1.00 British pound for 2025; 1.2779 U.S. dollars per 1.00 British pound for 2024; 1.2434 U.S. dollars per 1.00 British pound for 2023; and 1.2374 U.S. dollars per 1.00 British pound for 2022. |
(1) |
Reflects the total compensation reported for our PEO, Mr. Kramer, in the “Summary Compensation Table” for each fiscal year presented. Mr. Kramer served as PEO for each of the covered fiscal years presented. |
(2) |
See below for calculation of “compensation actually paid” or “CAP” to the PEO and Non-PEO NEOs. The dollar amounts reported represent the amount of CAP as computed in accordance with applicable SEC rules. The dollar amounts do not reflect the actual amounts of compensation paid to our PEO or Non-PEO NEOs during the covered fiscal year, but reflect (i) the fair value as of the end of the covered fiscal year of all equity awards granted during the covered fiscal year that are outstanding and unvested as of the end of the covered fiscal year, (ii) the change in fair value as of the end of the covered fiscal year (from the end of the prior fiscal year) of any equity awards granted in any prior fiscal year that were outstanding and unvested at the end of the covered fiscal year, and (iii) the change in fair value as of the vesting date (from the end of the prior fiscal year) of any equity awards granted in any prior fiscal year for which all applicable vesting conditions were satisfied at the end of or during the covered fiscal year. |
(3) |
Reflects the average total compensation reported for our Non-PEO NEOs in the “Summary Compensation Table” for each fiscal year presented. The other NEOs reflected in the columns above represent compensation for the following individuals for each of the years shown: |
• 2025 - Mandy Berman, Elizabeth Boland, Mary Lou Burke Afonso and Rosamund Marshall.
• 2024 - Mandy Berman, Elizabeth Boland, Mary Lou Burke Afonso and Rosamund Marshall.
• 2023 - Mandy Berman, Elizabeth Boland, Mary Lou Burke Afonso and Rosamund Marshall.
• 2022 - Elizabeth Boland, Mary Lou Burke Afonso, John Casagrande and Rosamund Marshall.
• 2021 - Maribeth Bearfield, Elizabeth Boland, Mary Lou Burke Afonso and John Casagrande.
(4) |
Reflects cumulative total shareholder return if $100 was invested as of December 31, 2020. Reflects the total shareholder return of the Russell Midcap Growth Index, as of December 31, 2025, 2024, 2023, 2022 and 2021, respectively, weighted according to the constituent companies’ market capitalization at the beginning of each period for which a return is indicated. The constituent companies of the Russell Midcap Growth Index are attached to this Proxy Statement on Appendix A S-K under the Exchange Act in the Company’s 2025 Annual Report. The Company selected the Russell Midcap Growth Index as a comparable as there is a lack of public company comparables in our industry, with most of our peers operating as private companies or divisions of larger diversified companies, and there are no widely recognized published industry indices. We determined that an equity index for companies with similar market capitalization and growth objectives would provide for an appropriate peer group, and we believe the Russell Midcap Growth Index provides the best means of comparison to the Company. The Russell Midcap Growth Index is a subset of the Russell 1000 Index and is composed of select companies from the 800 smallest companies of the Russell 1000 Index (Russell Midcap Index) that display higher price-to-book Source: Zacks Investment Research, Inc. Used with permission. All rights reserved. Copyright 1980-2026. |
(5) |
Reflects “Net Income” as reported in the Company’s Consolidated Statement of Income included in the Company’s Annual Reports on Form 10-K for each of the years ended December 31, 2025, 2024, 2023, 2022 and 2021. |
(6) |
The Company-Selected Measure is Adjusted EBITDA, which is further described under “Pay versus Performance: Most Important Measures” below. Adjusted EBITDA is a financial measure not calculated in accordance with GAAP, which is commonly referred to as a “non-GAAP measure.” For 2025, Adjusted EBITDA represents EBITDA (which is net income, as determined in accordance with GAAP, before interest expense, income tax expense, depreciation and amortization) adjusted to exclude the impact of stock-based compensation expense and |
| non-recurring costs, such as impairment and net lease termination costs, debt refinance costs and, at times, other non-recurring costs, such as transaction costs. Please see “Item 7. Management’s Discussion and Analysis of Financial Condition—Non-GAAP Financial Measures and Reconciliation” in our Annual Reports on Form 10-K for 2025, 2024, 2023, 2022 and 2021 for additional information on Adjusted EBITDA and a reconciliation of this non-GAAP financial measure to its respective measure determined under GAAP. |
To calculate the amounts in the “Compensation Actually Paid to PEO” column in the table above, the following amounts were deducted from or added to (as applicable) our PEO’s “Total” compensation as reported in the “Summary Compensation Table” for each covered fiscal year:
| Year |
Summary Compensation Table Total for PEO ($) (1) |
Summary Compensation Table Reported Value of Equity Awards for PEO ($) (2)(3) |
Fair Value of Equity Awards Granted in the Covered Year ($) (3)(4)(5) |
Change in Fair Value of Unvested Equity Awards Granted in Prior Years ($) (5) |
Change in Fair Value of Equity Awards from Prior Years that Vested in Covered Year ($) (5) |
Compensation Actually Paid to PEO ($) | ||||||||||||||||||||||||
| 2025 |
5,303,738 |
(3,500,167 |
) |
2,455,713 |
(825,234 |
) |
740,313 |
4,174,363 |
||||||||||||||||||||||
| 2024 |
5,154,263 |
(3,500,011 |
) |
3,189,588 |
1,162,781 |
632,839 |
6,639,460 |
|||||||||||||||||||||||
| 2023 |
4,927,814 |
(3,499,984 |
) |
4,237,093 |
2,035,472 |
410,928 |
8,111,323 |
|||||||||||||||||||||||
| 2022 |
3,258,891 |
(2,300,203 |
) |
179,157 |
(4,458,298 |
) |
44,068 |
(3,276,385 |
) | |||||||||||||||||||||
| 2021 |
4,237,306 |
(3,009,591 |
) |
1,736,085 |
(3,033,614 |
) |
(422 |
) |
(70,237 |
) | ||||||||||||||||||||
(1) |
Reflects the total compensation reported for our PEO, Mr. Kramer, in the “Summary Compensation Table” for each of the years presented. |
(2) |
Represents the grant date fair value of the equity awards to our PEO as reported in the “Stock Awards” and “Option Awards” columns in the “Summary Compensation Table” for each of the years presented. |
(3) |
Equity values are calculated in accordance with FASB ASC Topic 718. For 2022 and 2021, the amounts included related to purchased restricted stock awards represent the grant date fair value or measurement date fair value as of the end of the covered fiscal year, as applicable, of all purchased restricted stock awards granted less the 50% purchase price paid by Mr. Kramer for such awards. There were no purchased restricted stock awards granted in 2025, 2024 or 2023. The following amounts were paid in cash on the grant date by Mr. Kramer upon each award of purchased restricted stock and are excluded from the respective columns consistent with the determination of fair value in accordance with FASB ASC Topic 718: |
| Year |
Purchase Price Paid by PEO ($) |
Shares of Restricted Stock (#) | ||
| 2025 |
— |
— | ||
| 2024 |
— |
— | ||
| 2023 |
— |
— | ||
| 2022 |
1,210,814 |
18,800 | ||
| 2021 |
3,009,591 |
37,700 |
(4) |
Represents the year-end fair value for equity awards to our PEO. No awards vested in the year they were granted. |
(5) |
Stock option fair values are calculated based on the Black-Scholes option pricing model. The stock option fair values, purchased restricted stock fair values, the PRSU fair values and the RSU fair values are calculated using the stock price as of the applicable measurement date. The change in fair value is calculated using the fair value as of the prior year-end and as of each measurement date in the applicable covered year. The application of the underlying assumptions used in calculating the fair value of the stock option awards did not differ in any material respect from that used to calculate the grant date fair value of the awards as reported in the “Summary Compensation Table” for the applicable year. |
To calculate the amounts in the “Average Compensation Actually Paid to
Non-PEO
NEOs” column in the table above, the following amounts were deducted from or added to (as applicable) the average of the “Total” compensation of our other NEOs as reported in the “Summary Compensation Table” for each applicable year: | Year |
Average Summary Compensation Table Total for Non-PEO NEOs ($) (1) |
Average Summary Compensation Table Reported Value of Equity Awards for Non-PEO NEOs ($) (2)(3) |
Average Fair Value of Equity Awards Granted in the Covered Year ($) (3)(4)(5) |
Average Change in Fair Value of Unvested Equity Awards Granted in Prior Years ($) (5) |
Average Change in Fair Value of Equity Awards from Prior Years that Vested in Covered Year ($) (5) |
Average Compensation Actually Paid to Non-PEO NEOs ($) | ||||||||||||||||||||||||
| 2025 (*) |
1,906,755 |
(1,012,539 |
) |
710,399 |
(257,831 |
) |
240,273 |
1,587,056 |
||||||||||||||||||||||
| 2024 (*) |
1,833,876 |
(1,012,522 |
) |
922,723 |
349,357 |
142,625 |
2,236,059 |
|||||||||||||||||||||||
| 2023 (*) |
1,706,797 |
(1,012,473 |
) |
1,225,704 |
701,876 |
174,859 |
2,796,763 |
|||||||||||||||||||||||
| 2022 (*) |
1,437,903 |
(913,202 |
) |
180,437 |
(1,242,662 |
) |
18,136 |
(519,387 |
) | |||||||||||||||||||||
| 2021 |
1,507,741 |
(956,084 |
) |
683,432 |
(1,055,642 |
) |
(90,506 |
) |
88,941 |
|||||||||||||||||||||
(*) |
Amounts reported for Ms. Marshall are converted from British pounds to U.S. dollars using the following average exchange rates: 1.3181 U.S. dollars per 1.00 British pound for 2025; 1.2779 U.S. dollars per 1.00 British pound for 2024; 1.2434 U.S. dollars per 1.00 British pound for 2023; and 1.2374 U.S. dollars per 1.00 British pound for 2022. |
(1) |
Reflects the average total compensation reported for our Non-PEO NEOs in the “Summary Compensation Table” for each of the years presented. |
(2) |
Represents the average of the grant date fair value of the equity awards to our Non-PEO NEOs as reported in the “Stock Awards” and “Option Awards” columns in the “Summary Compensation Table” for each of the years presented. |
(3) |
Equity values are calculated in accordance with FASB ASC Topic 718. For 2022 and 2021, the amounts included related to purchased restricted stock awards represent the average grant date fair value or measurement date fair value as of the end of the covered fiscal year, as applicable, of all purchased restricted stock awards granted to our Non-PEO NEOs less the 50% purchase price paid by each for such awards. There were no purchased restricted stock awards granted in 2025, 2024 or 2023. The following amounts were the total paid in cash on the grant date by our Non-PEO NEOs upon each award of purchased restricted stock and are excluded from the respective columns consistent with the determination of fair value in accordance with FASB ASC Topic 718: |
| Year |
Total Purchase Price Paid by Non-PEO NEOs ($) |
Total Shares of Restricted Stock (#) | ||
| 2025 |
— |
— | ||
| 2024 |
— |
— | ||
| 2023 |
— |
— | ||
| 2022 |
981,210 |
15,235 | ||
| 2021 |
2,196,922 |
27,520 |
(4) |
Represents the average year-end fair value for equity awards to our Non-PEO NEOs. No awards vested in the year they were granted. |
(5) |
Stock option fair values are calculated based on the Black-Scholes option pricing model. The stock option fair values, the purchased restricted stock fair values, the PRSU fair values and the RSU fair values are calculated using the stock price as of the applicable measurement date. The change in fair value is calculated using the fair value as of the prior year-end and as of each measurement date in the applicable covered year. The application of the underlying assumptions used in calculating the fair value of the stock option awards did not differ in any material respect from that used to calculate the grant date fair value of the awards as reported in the “Summary Compensation Table” for the applicable year. |
Relationship between Pay and Performance
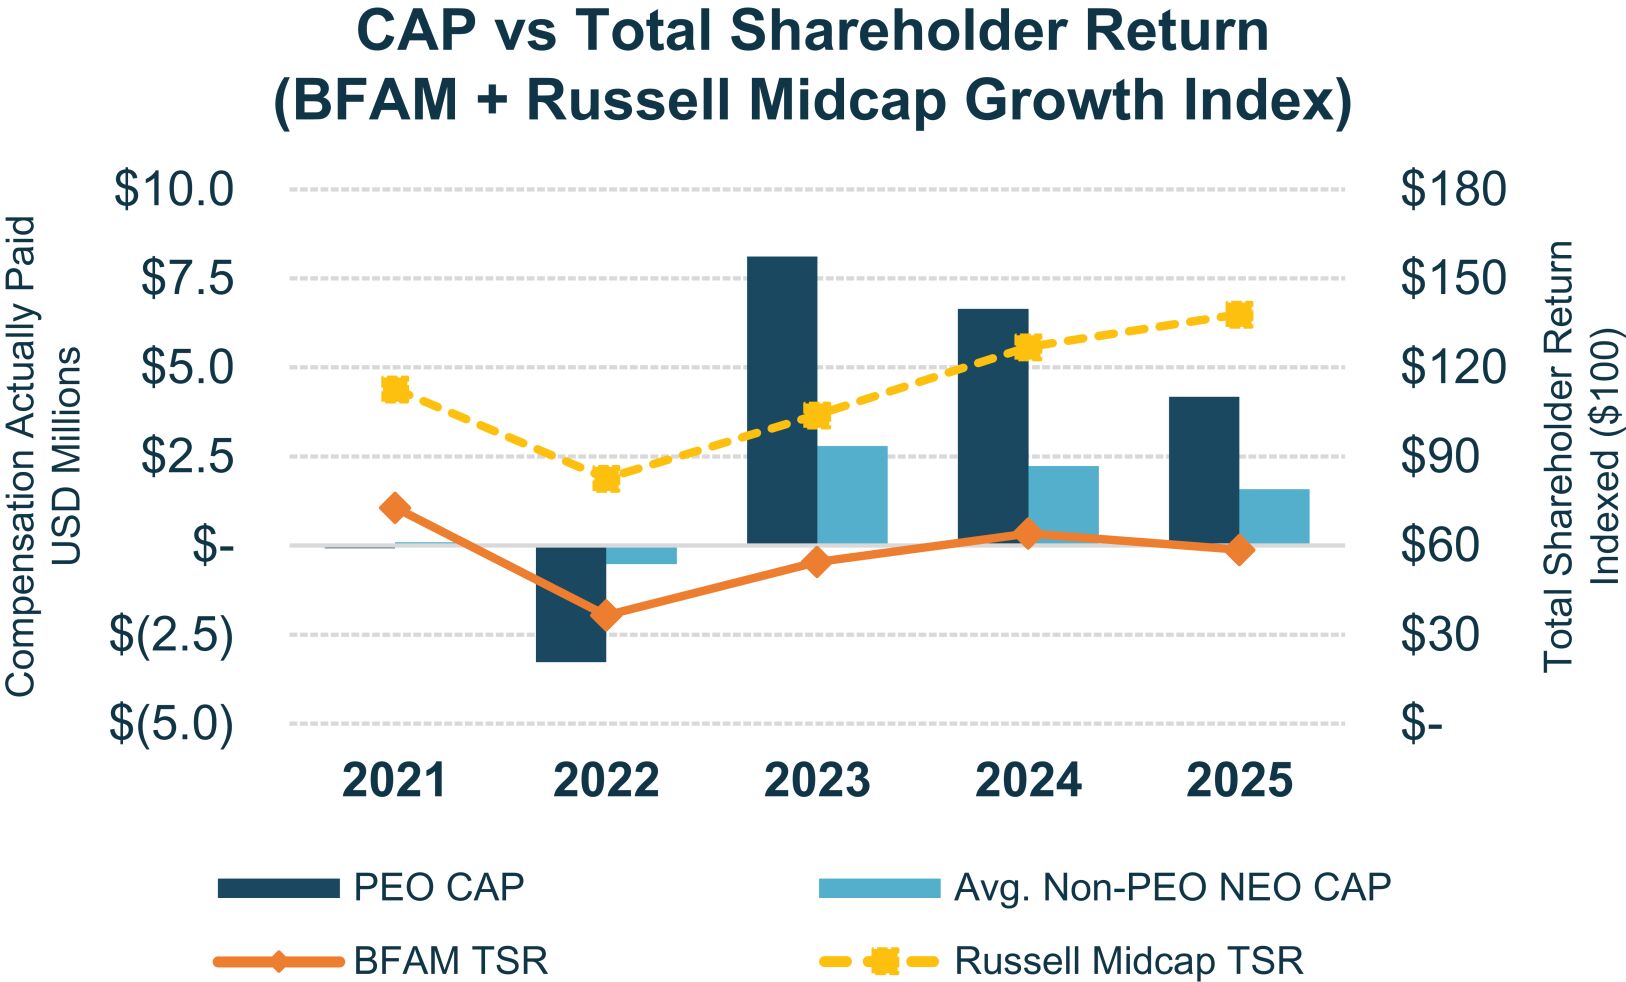
Below are graphs showing the relationship between “compensation actually paid” or “CAP” to our PEO and CAP to our
Non-PEO
NEOs in 2021, 2022, 2023, 2024 and 2025 and to (1) Total Shareholder Return of both the Company and the Russell Midcap Growth Index, (2) the Company’s Net Income, and (3) the Company’s Adjusted EBITDA. CAP, as calculated in accordance with applicable SEC rules, reflects adjusted values for unvested and vested equity awards for the years shown in the table based on year-end
or vest date stock prices, as applicable, and various accounting valuation assumptions. CAP also fluctuates due to changes in the price of the Company’s common stock. Accordingly, CAP does not reflect actual amounts paid. For a discussion of how our Compensation Committee assessed the Company’s performance and our NEOs’ pay each year, see the “Compensation Discussion and Analysis” in this Proxy Statement and in the Proxy Statements for 2021 through 2025. (3) |
Reflects the average total compensation reported for our Non-PEO NEOs in the “Summary Compensation Table” for each fiscal year presented. The other NEOs reflected in the columns above represent compensation for the following individuals for each of the years shown: |
• 2025 - Mandy Berman, Elizabeth Boland, Mary Lou Burke Afonso and Rosamund Marshall.
• 2024 - Mandy Berman, Elizabeth Boland, Mary Lou Burke Afonso and Rosamund Marshall.
• 2023 - Mandy Berman, Elizabeth Boland, Mary Lou Burke Afonso and Rosamund Marshall.
• 2022 - Elizabeth Boland, Mary Lou Burke Afonso, John Casagrande and Rosamund Marshall.
• 2021 - Maribeth Bearfield, Elizabeth Boland, Mary Lou Burke Afonso and John Casagrande.
(4) |
Reflects cumulative total shareholder return if $100 was invested as of December 31, 2020. Reflects the total shareholder return of the Russell Midcap Growth Index, as of December 31, 2025, 2024, 2023, 2022 and 2021, respectively, weighted according to the constituent companies’ market capitalization at the beginning of each period for which a return is indicated. The constituent companies of the Russell Midcap Growth Index are attached to this Proxy Statement on Appendix A S-K under the Exchange Act in the Company’s 2025 Annual Report. The Company selected the Russell Midcap Growth Index as a comparable as there is a lack of public company comparables in our industry, with most of our peers operating as private companies or divisions of larger diversified companies, and there are no widely recognized published industry indices. We determined that an equity index for companies with similar market capitalization and growth objectives would provide for an appropriate peer group, and we believe the Russell Midcap Growth Index provides the best means of comparison to the Company. The Russell Midcap Growth Index is a subset of the Russell 1000 Index and is composed of select companies from the 800 smallest companies of the Russell 1000 Index (Russell Midcap Index) that display higher price-to-book Source: Zacks Investment Research, Inc. Used with permission. All rights reserved. Copyright 1980-2026. |
To calculate the amounts in the “Compensation Actually Paid to PEO” column in the table above, the following amounts were deducted from or added to (as applicable) our PEO’s “Total” compensation as reported in the “Summary Compensation Table” for each covered fiscal year:
| Year |
Summary Compensation Table Total for PEO ($) (1) |
Summary Compensation Table Reported Value of Equity Awards for PEO ($) (2)(3) |
Fair Value of Equity Awards Granted in the Covered Year ($) (3)(4)(5) |
Change in Fair Value of Unvested Equity Awards Granted in Prior Years ($) (5) |
Change in Fair Value of Equity Awards from Prior Years that Vested in Covered Year ($) (5) |
Compensation Actually Paid to PEO ($) | ||||||||||||||||||||||||
| 2025 |
5,303,738 |
(3,500,167 |
) |
2,455,713 |
(825,234 |
) |
740,313 |
4,174,363 |
||||||||||||||||||||||
| 2024 |
5,154,263 |
(3,500,011 |
) |
3,189,588 |
1,162,781 |
632,839 |
6,639,460 |
|||||||||||||||||||||||
| 2023 |
4,927,814 |
(3,499,984 |
) |
4,237,093 |
2,035,472 |
410,928 |
8,111,323 |
|||||||||||||||||||||||
| 2022 |
3,258,891 |
(2,300,203 |
) |
179,157 |
(4,458,298 |
) |
44,068 |
(3,276,385 |
) | |||||||||||||||||||||
| 2021 |
4,237,306 |
(3,009,591 |
) |
1,736,085 |
(3,033,614 |
) |
(422 |
) |
(70,237 |
) | ||||||||||||||||||||
(1) |
Reflects the total compensation reported for our PEO, Mr. Kramer, in the “Summary Compensation Table” for each of the years presented. |
(2) |
Represents the grant date fair value of the equity awards to our PEO as reported in the “Stock Awards” and “Option Awards” columns in the “Summary Compensation Table” for each of the years presented. |
(3) |
Equity values are calculated in accordance with FASB ASC Topic 718. For 2022 and 2021, the amounts included related to purchased restricted stock awards represent the grant date fair value or measurement date fair value as of the end of the covered fiscal year, as applicable, of all purchased restricted stock awards granted less the 50% purchase price paid by Mr. Kramer for such awards. There were no purchased restricted stock awards granted in 2025, 2024 or 2023. The following amounts were paid in cash on the grant date by Mr. Kramer upon each award of purchased restricted stock and are excluded from the respective columns consistent with the determination of fair value in accordance with FASB ASC Topic 718: |
| Year |
Purchase Price Paid by PEO ($) |
Shares of Restricted Stock (#) | ||
| 2025 |
— |
— | ||
| 2024 |
— |
— | ||
| 2023 |
— |
— | ||
| 2022 |
1,210,814 |
18,800 | ||
| 2021 |
3,009,591 |
37,700 |
(4) |
Represents the year-end fair value for equity awards to our PEO. No awards vested in the year they were granted. |
(5) |
Stock option fair values are calculated based on the Black-Scholes option pricing model. The stock option fair values, purchased restricted stock fair values, the PRSU fair values and the RSU fair values are calculated using the stock price as of the applicable measurement date. The change in fair value is calculated using the fair value as of the prior year-end and as of each measurement date in the applicable covered year. The application of the underlying assumptions used in calculating the fair value of the stock option awards did not differ in any material respect from that used to calculate the grant date fair value of the awards as reported in the “Summary Compensation Table” for the applicable year. |
To calculate the amounts in the “Average Compensation Actually Paid to
Non-PEO
NEOs” column in the table above, the following amounts were deducted from or added to (as applicable) the average of the “Total” compensation of our other NEOs as reported in the “Summary Compensation Table” for each applicable year: | Year |
Average Summary Compensation Table Total for Non-PEO NEOs ($) (1) |
Average Summary Compensation Table Reported Value of Equity Awards for Non-PEO NEOs ($) (2)(3) |
Average Fair Value of Equity Awards Granted in the Covered Year ($) (3)(4)(5) |
Average Change in Fair Value of Unvested Equity Awards Granted in Prior Years ($) (5) |
Average Change in Fair Value of Equity Awards from Prior Years that Vested in Covered Year ($) (5) |
Average Compensation Actually Paid to Non-PEO NEOs ($) | ||||||||||||||||||||||||
| 2025 (*) |
1,906,755 |
(1,012,539 |
) |
710,399 |
(257,831 |
) |
240,273 |
1,587,056 |
||||||||||||||||||||||
| 2024 (*) |
1,833,876 |
(1,012,522 |
) |
922,723 |
349,357 |
142,625 |
2,236,059 |
|||||||||||||||||||||||
| 2023 (*) |
1,706,797 |
(1,012,473 |
) |
1,225,704 |
701,876 |
174,859 |
2,796,763 |
|||||||||||||||||||||||
| 2022 (*) |
1,437,903 |
(913,202 |
) |
180,437 |
(1,242,662 |
) |
18,136 |
(519,387 |
) | |||||||||||||||||||||
| 2021 |
1,507,741 |
(956,084 |
) |
683,432 |
(1,055,642 |
) |
(90,506 |
) |
88,941 |
|||||||||||||||||||||
(*) |
Amounts reported for Ms. Marshall are converted from British pounds to U.S. dollars using the following average exchange rates: 1.3181 U.S. dollars per 1.00 British pound for 2025; 1.2779 U.S. dollars per 1.00 British pound for 2024; 1.2434 U.S. dollars per 1.00 British pound for 2023; and 1.2374 U.S. dollars per 1.00 British pound for 2022. |
(1) |
Reflects the average total compensation reported for our Non-PEO NEOs in the “Summary Compensation Table” for each of the years presented. |
(2) |
Represents the average of the grant date fair value of the equity awards to our Non-PEO NEOs as reported in the “Stock Awards” and “Option Awards” columns in the “Summary Compensation Table” for each of the years presented. |
(3) |
Equity values are calculated in accordance with FASB ASC Topic 718. For 2022 and 2021, the amounts included related to purchased restricted stock awards represent the average grant date fair value or measurement date fair value as of the end of the covered fiscal year, as applicable, of all purchased restricted stock awards granted to our Non-PEO NEOs less the 50% purchase price paid by each for such awards. There were no purchased restricted stock awards granted in 2025, 2024 or 2023. The following amounts were the total paid in cash on the grant date by our Non-PEO NEOs upon each award of purchased restricted stock and are excluded from the respective columns consistent with the determination of fair value in accordance with FASB ASC Topic 718: |
| Year |
Total Purchase Price Paid by Non-PEO NEOs ($) |
Total Shares of Restricted Stock (#) | ||
| 2025 |
— |
— | ||
| 2024 |
— |
— | ||
| 2023 |
— |
— | ||
| 2022 |
981,210 |
15,235 | ||
| 2021 |
2,196,922 |
27,520 |
(4) |
Represents the average year-end fair value for equity awards to our Non-PEO NEOs. No awards vested in the year they were granted. |
(5) |
Stock option fair values are calculated based on the Black-Scholes option pricing model. The stock option fair values, the purchased restricted stock fair values, the PRSU fair values and the RSU fair values are calculated using the stock price as of the applicable measurement date. The change in fair value is calculated using the fair value as of the prior year-end and as of each measurement date in the applicable covered year. The application of the underlying assumptions used in calculating the fair value of the stock option awards did not differ in any material respect from that used to calculate the grant date fair value of the awards as reported in the “Summary Compensation Table” for the applicable year. |
Relationship between Pay and Total Shareholder Return.
Relationship between Pay and Net Income.
Non-PEO
NEOs was primarily due to the decline in the price of the Company’s common stock and the mix of compensation comprised of long-term incentive awards. 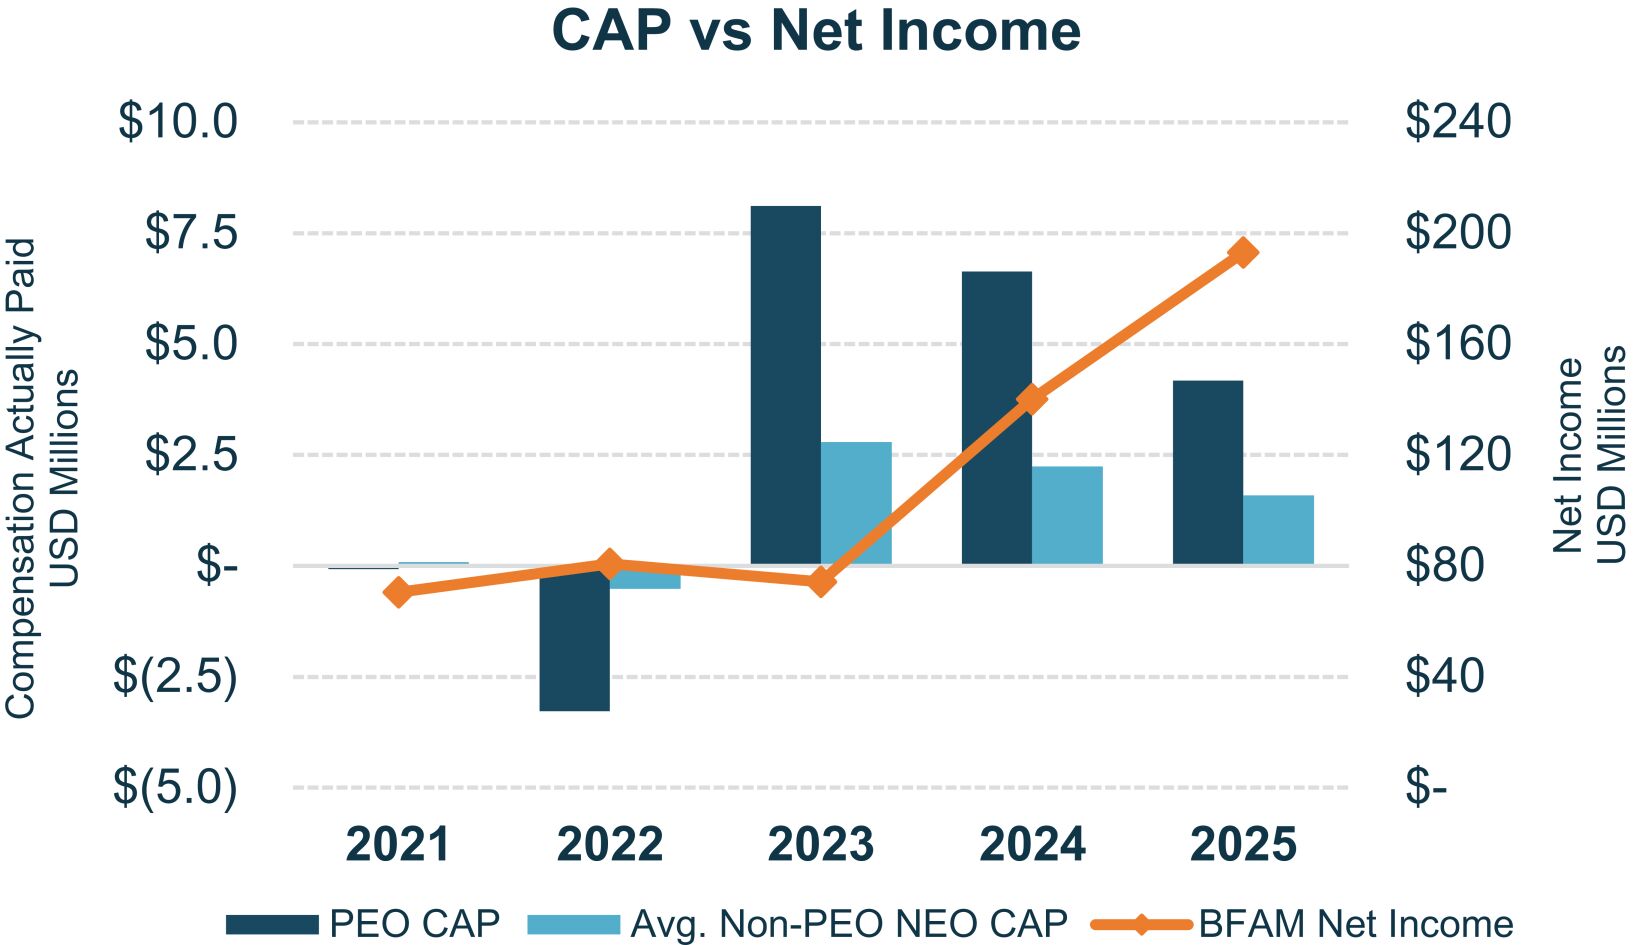
Relationship between Pay and Adjusted EBITDA.
Non-PEO
NEOs was primarily due to the decline in the price of the Company’s common stock. In 2025, the CAP for both the PEO and our Non-PEO
NEOs decreased due in part to a decrease in stock price impacting the value of certain long-term equity incentive awards, while the Company’s Adjusted EBITDA increased over the same period. 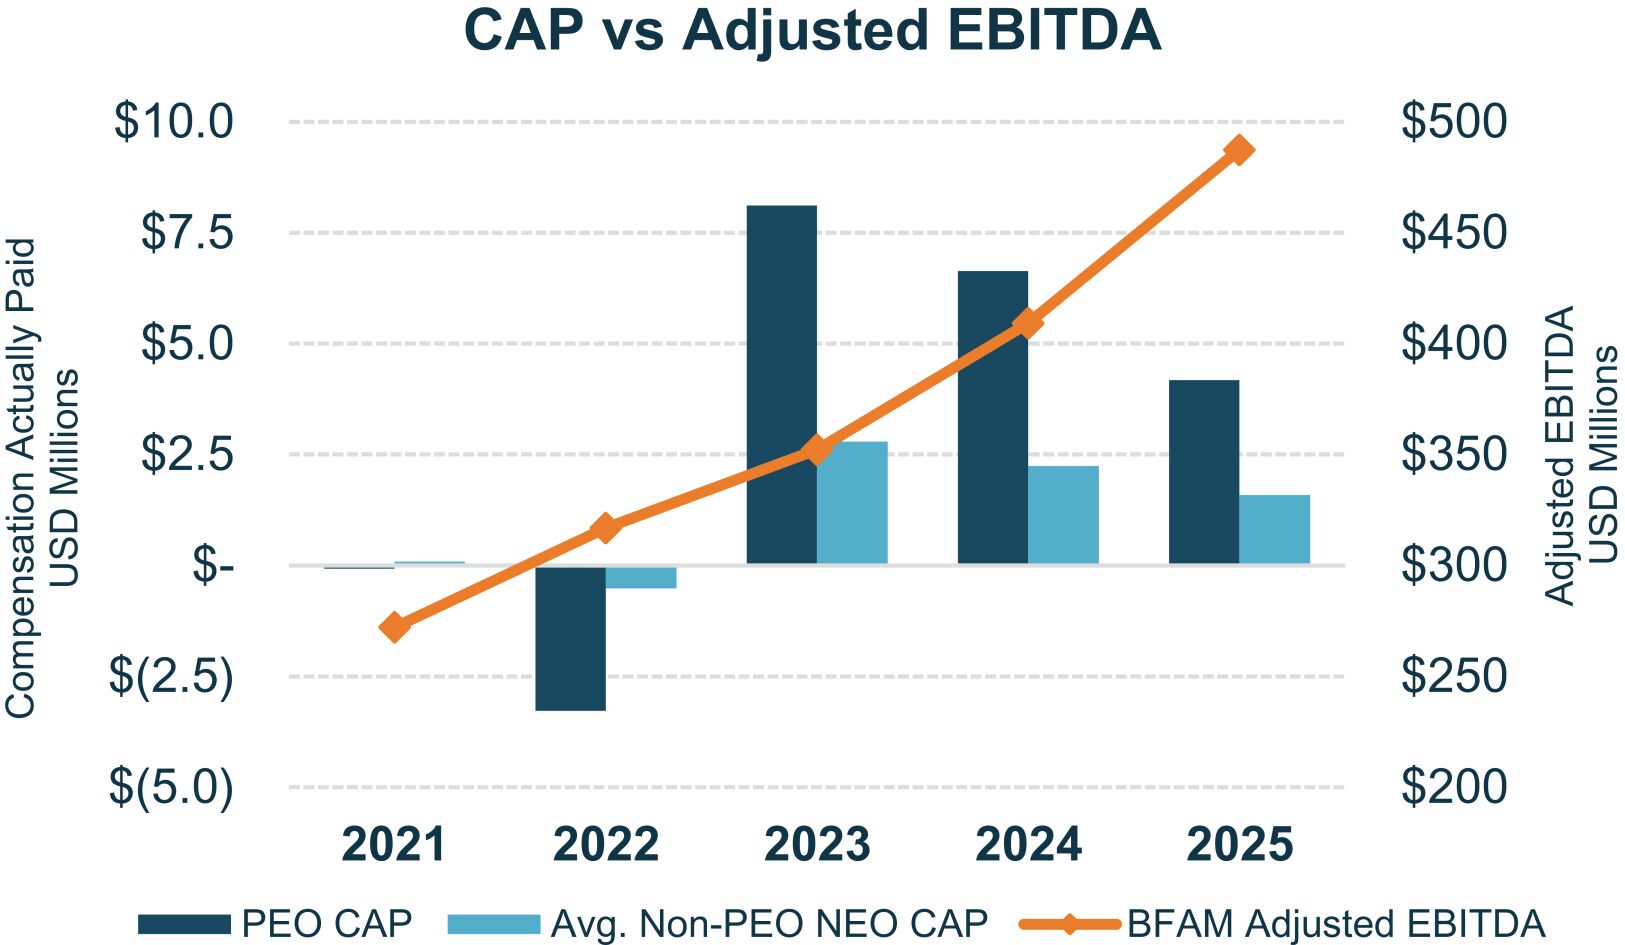
Relationship between Pay and Total Shareholder Return.
Pay versus Performance: Most Important Measures
The following table identifies the three most important financial performance measures to link the CAP to our PEO and
Non-PEO
NEOs in 2025, calculated in accordance with applicable SEC regulations, to Company performance. The measures most important in determining pay during 2025 were those most heavily weighted in our annual bonus programs. | Measure |
Nature |
Explanation | ||
Adjusted EBITDA (*) |
Financial Measure |
A non-GAAP financial measure that consists of adjusted earnings before interest, taxes, depreciation and amortization and other non-recurring items reflects the Company’s cash flow generation on a consistent basis and is a strong overall indicator of the Company’s operational performance. | ||
Adjusted EPS (*) |
Financial Measure |
A non-GAAP financial measure that consists of diluted adjusted earnings per common share reflects the Company’s overall operating and financial achievements adjusted for the impact of certain non-cash charges and non-recurring transactions. | ||
Revenue Growth |
Financial Measure |
A financial measure that consists of our revenue growth year over year. | ||
(*) |
For 2025, Adjusted EBITDA represents EBITDA (which is net income, as determined in accordance with GAAP, before interest expense, income tax expense, depreciation and amortization) adjusted to exclude the impact of stock-based compensation expense and non-recurring costs, such as impairment and net lease termination costs, debt refinance costs, and at times, other non-recurring costs, such as transaction costs. We calculate Adjusted EPS based on adjusted net income, which represents net income determined in accordance with GAAP, adjusted to exclude the impact of stock-based compensation expense, amortization, and non-recurring costs, such as impairment and net lease termination costs, debt refinance costs, interest incurred related to a pre-acquisition obligation, and the income tax provision (benefit) thereon, and at times, other non-recurring costs, such as transaction costs, divided by the diluted weighted average number of our common shares. Please see “Item 7. Management’s Discussion and Analysis of Financial Condition—Non-GAAP Financial Measures and Reconciliation” in our 2025 Annual Report for additional information on Adjusted EBITDA and Adjusted EPS (diluted adjusted earnings per common share) and a reconciliation of these non-GAAP financial measures to their respective measures determined under GAAP. |
(6) |
The Company-Selected Measure is Adjusted EBITDA, which is further described under “Pay versus Performance: Most Important Measures” below. Adjusted EBITDA is a financial measure not calculated in accordance with GAAP, which is commonly referred to as a “non-GAAP measure.” For 2025, Adjusted EBITDA represents EBITDA (which is net income, as determined in accordance with GAAP, before interest expense, income tax expense, depreciation and amortization) adjusted to exclude the impact of stock-based compensation expense and |
| non-recurring costs, such as impairment and net lease termination costs, debt refinance costs and, at times, other non-recurring costs, such as transaction costs. Please see “Item 7. Management’s Discussion and Analysis of Financial Condition—Non-GAAP Financial Measures and Reconciliation” in our Annual Reports on Form 10-K for 2025, 2024, 2023, 2022 and 2021 for additional information on Adjusted EBITDA and a reconciliation of this non-GAAP financial measure to its respective measure determined under GAAP. |