Pay vs Performance Disclosure - USD ($)
Dec. 31, 2025
Dec. 31, 2024
Dec. 31, 2023
PAY VERSUS PERFORMANCE
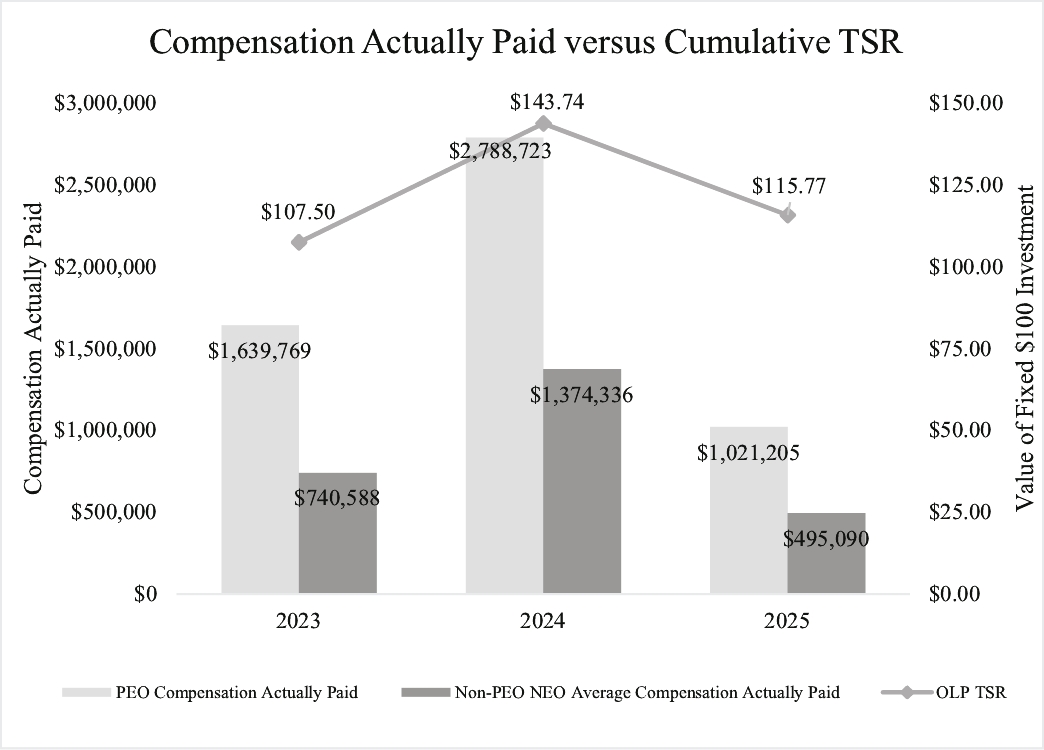
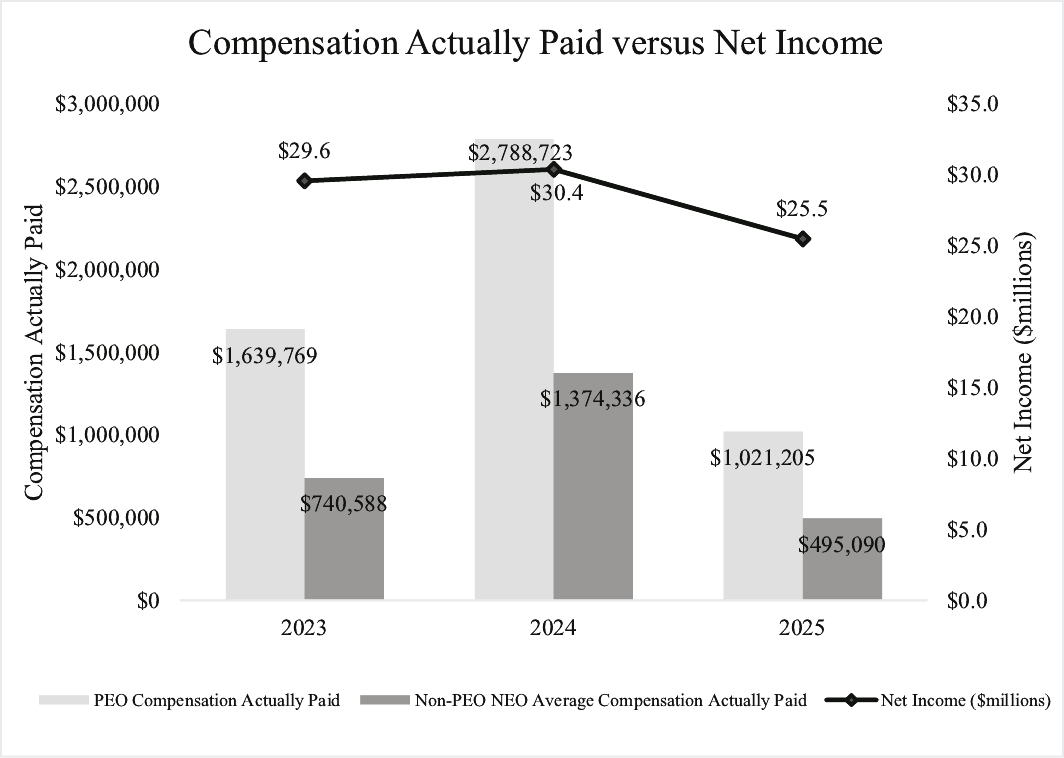
The following table sets forth information concerning the compensation of Patrick J. Callan, Jr., our principal executive officer (“PEO”), and our other named executive officers (i.e., Lawrence G. Ricketts, Jr., Matthew J. Gould, Jeffrey A. Gould, Isaac Kalish and David W. Kalish (for 2023 only), referred to collectively as the “NEOs”) for each of 2025, 2024 and 2023 and our financial and market performance for each such year:
Year | Summary Compensation Table Total for PEO ($)(1) | Compensation Actually Paid to PEO(2) ($) | Average Summary Compensation Table Total for NEOs ($) | Average Compensation Actually Paid to NEOs(1)(3) ($) | Value of Initial Fixed $100 Investment Based On Total Stockholder Return ($) | Net Income (millions) ($)(4) | ||||||||||||
2025 | 2,009,253 | 1,021,205 | 1,001,140 | 495,090 | 115.77 | 25.5 | ||||||||||||
2024 | 1,845,844 | 2,788,723 | 901,954 | 1,374,336 | 143.74 | 30.4 | ||||||||||||
2023 | 1,781,302 | 1,639,769 | 801,776 | 740,588 | 107.50 | 29.6 | ||||||||||||
(1) | See Note 3 to the Summary Compensation Table for information regarding the treatment of dividends and dividend equivalents payable on stock and similar awards. |
(2) | Represents the “compensation actually paid” to Mr. Callan as computed in accordance with SEC requirements. Such amounts do not reflect the actual amount of compensation earned by or paid to Mr. Callan. See table immediately below for a reconciliation showing how “compensation actually paid” was calculated. |
(3) | Represents the average amount of “compensation actually paid” to the NEOs as a group as computed in accordance with SEC requirements. Such amounts do not reflect the actual average amount of compensation earned by or paid to these NEOs as a group. See “— Compensation of NEOs.” |
(4) | Represents net income attributable to One Liberty Properties, Inc. |
In accordance with SEC requirements, the following adjustments were made to Mr. Callan’s total compensation for the applicable year to determine his “compensation actually paid”:
Year | Reported Summary Compensation Table Total for PEO ($) | Reported Value of Equity Awards ($) | Equity Award Adjustments ($) | Compensation Actually Paid to PEO ($) | ||||||||
2025 | 2,009,253 | (776,200) | (211,848) | 1,021,205 | ||||||||
2024 | 1,845,844 | (668,176) | 1,611,055 | 2,788,723 | ||||||||
2023 | 1,781,302 | (652,760) | 511,227 | 1,639,769 | ||||||||
The table below sets forth the manner in which Equity Award Adjustments in the immediately preceding table were calculated (see footnotes (1) – (9) below for the assumptions made in the valuations that differ materially from those disclosed as of the grant date of such equity awards:
Year | Year End Fair Value of Equity Awards ($) | Year over Year Change in Fair Value of Outstanding and Unvested Equity Awards ($) | Year over Year Change in Fair Value of Equity Awards Granted in Prior Years that Vested in the Year ($) | Total Equity Award Adjustments ($) | ||||||||
2025 | 619,291(1) | (652,108)(2) | (179,031)(3) | (211,848) | ||||||||
2024 | 828,862(4) | 771,749(5) | 10,444(6) | 1,611,055 | ||||||||
2023 | 663,011(7) | (127,592)(8) | (24,192)(9) | 511,227 | ||||||||
(1) | With respect to the 2025 RSU-ROCs, assumes that as of (i) the grant date, 73% of such awards would vest and (ii) year-end 2025, 82% of such awards would vest. |
(2) | With respect to the (A) 2024 RSU-ROCs, assumes that as of (i) year-end 2025, 80% of such awards would vest and (ii) year-end 2024, 48% of such awards would vest and (B) 2023 RSU-ROCs, assumes that as of (i) year-end 2025, 76% of such awards would vest and (ii) year-end 2024, 47% of such awards would vest. |
(3) | With respect to the 2022 RSU-ROCs, which vested in 2025, assumes that as of year-end 2024, 72% of such awards would vest, of which only 44% actually vested. |
(4) | With respect to the 2024 RSU-ROCs, assumes that as of (i) the grant date, 44% of such awards would vest and (ii) year-end 2024, 48% of such awards would vest. |
(5) | With respect to the (A) 2023 RSU-ROCs, assumes that as of (i) year-end 2024, 47% of such awards would vest and (ii) year-end 2023, 51% of such awards would vest and (B) 2022 RSU-ROCs, assumes that as of (i) year-end 2024, 72% of such awards would vest and (ii) year-end 2023, 67% of such awards would vest. |
(6) | With respect to the 2021 RSU-ROCs which vested in 2024, assumes that as of year-end 2023, 100% of such awards would vest, of which only 50% actually vested. |
(7) | With respect to the 2023 RSU-ROCs, assumes that as of (i) the grant date, 53% of such awards would vest and (ii) year-end 2023, 51% of such awards would vest. |
(8) | With respect to the (A) 2022 RSU-ROCs, assumes that as of (i) year-end 2023, 67% of such awards would vest and (ii) year-end 2022, 69% of such awards would vest and (B) 2021 RSU-ROCs, assumes that as of (i) year-end 2023, 100% of such awards would vest and (ii) year-end 2022, 100% of such awards would vest. |
(9) | With respect to the 2020 RSU-ROCs which vested in 2023, assumes that as of year-end 2022, 100% of such awards would vest, which is the amount that actually vested. |
Compensation of NEOs
In accordance with SEC requirements, the following adjustments were made to average total compensation for the NEOs for each year to determine the “compensation actually paid” to this group. (Although the vesting of certain NEOs restricted stock would accelerate upon such person’s retirement, as such NEO has not retired nor given us notice of their intention to retire, and consistent with the disclosure elsewhere in this proxy statement (except as otherwise indicated), we have not accelerated the vesting of their awards).
Year | Average Reported Summary Compensation Table Total for NEOs ($) | Average Reported Value of Equity Awards ($) | Average Equity Award Adjustments ($)(1) | Average Compensation Actually Paid to NEOs ($) | ||||||||
2025 | 1,001,140 | (417,928) | (88,122) | 495,090 | ||||||||
2024 | 901,954 | (361,628) | 834,010 | 1,374,336 | ||||||||
2023 | 801,776 | (320,527) | 259,339 | 740,588 | ||||||||
The table below sets forth the manner in which Average Equity Award Adjustments in the immediately preceding table were calculated:
Year | Average Year End Fair Value of Equity Awards ($) | Year over Year Average Change in Fair Value of Outstanding and Unvested Equity Awards ($) | Year over Year Average Change in Fair Value of Equity Awards Granted in Prior Years that Vested in the Year ($) | Total Average Equity Award Adjustments ($) | ||||||||
2025 | 333,355 | (334,611) | (86,866) | (88,122) | ||||||||
2024 | 449,162 | 380,083 | 4,765 | 834,010 | ||||||||
2023 | 325,079 | (58,294) | (7,446) | 259,339 | ||||||||
(2) | Represents the “compensation actually paid” to Mr. Callan as computed in accordance with SEC requirements. Such amounts do not reflect the actual amount of compensation earned by or paid to Mr. Callan. See table immediately below for a reconciliation showing how “compensation actually paid” was calculated. |
In accordance with SEC requirements, the following adjustments were made to Mr. Callan’s total compensation for the applicable year to determine his “compensation actually paid”:
Year | Reported Summary Compensation Table Total for PEO ($) | Reported Value of Equity Awards ($) | Equity Award Adjustments ($) | Compensation Actually Paid to PEO ($) | ||||||||
2025 | 2,009,253 | (776,200) | (211,848) | 1,021,205 | ||||||||
2024 | 1,845,844 | (668,176) | 1,611,055 | 2,788,723 | ||||||||
2023 | 1,781,302 | (652,760) | 511,227 | 1,639,769 | ||||||||
The table below sets forth the manner in which Equity Award Adjustments in the immediately preceding table were calculated (see footnotes (1) – (9) below for the assumptions made in the valuations that differ materially from those disclosed as of the grant date of such equity awards:
Year | Year End Fair Value of Equity Awards ($) | Year over Year Change in Fair Value of Outstanding and Unvested Equity Awards ($) | Year over Year Change in Fair Value of Equity Awards Granted in Prior Years that Vested in the Year ($) | Total Equity Award Adjustments ($) | ||||||||
2025 | 619,291(1) | (652,108)(2) | (179,031)(3) | (211,848) | ||||||||
2024 | 828,862(4) | 771,749(5) | 10,444(6) | 1,611,055 | ||||||||
2023 | 663,011(7) | (127,592)(8) | (24,192)(9) | 511,227 | ||||||||
(1) | With respect to the 2025 RSU-ROCs, assumes that as of (i) the grant date, 73% of such awards would vest and (ii) year-end 2025, 82% of such awards would vest. |
(2) | With respect to the (A) 2024 RSU-ROCs, assumes that as of (i) year-end 2025, 80% of such awards would vest and (ii) year-end 2024, 48% of such awards would vest and (B) 2023 RSU-ROCs, assumes that as of (i) year-end 2025, 76% of such awards would vest and (ii) year-end 2024, 47% of such awards would vest. |
(3) | With respect to the 2022 RSU-ROCs, which vested in 2025, assumes that as of year-end 2024, 72% of such awards would vest, of which only 44% actually vested. |
(4) | With respect to the 2024 RSU-ROCs, assumes that as of (i) the grant date, 44% of such awards would vest and (ii) year-end 2024, 48% of such awards would vest. |
(5) | With respect to the (A) 2023 RSU-ROCs, assumes that as of (i) year-end 2024, 47% of such awards would vest and (ii) year-end 2023, 51% of such awards would vest and (B) 2022 RSU-ROCs, assumes that as of (i) year-end 2024, 72% of such awards would vest and (ii) year-end 2023, 67% of such awards would vest. |
(6) | With respect to the 2021 RSU-ROCs which vested in 2024, assumes that as of year-end 2023, 100% of such awards would vest, of which only 50% actually vested. |
(7) | With respect to the 2023 RSU-ROCs, assumes that as of (i) the grant date, 53% of such awards would vest and (ii) year-end 2023, 51% of such awards would vest. |
(8) | With respect to the (A) 2022 RSU-ROCs, assumes that as of (i) year-end 2023, 67% of such awards would vest and (ii) year-end 2022, 69% of such awards would vest and (B) 2021 RSU-ROCs, assumes that as of (i) year-end 2023, 100% of such awards would vest and (ii) year-end 2022, 100% of such awards would vest. |
(9) | With respect to the 2020 RSU-ROCs which vested in 2023, assumes that as of year-end 2022, 100% of such awards would vest, which is the amount that actually vested. |
Compensation of NEOs
In accordance with SEC requirements, the following adjustments were made to average total compensation for the NEOs for each year to determine the “compensation actually paid” to this group. (Although the vesting of certain NEOs restricted stock would accelerate upon such person’s retirement, as such NEO has not retired nor given us notice of their intention to retire, and consistent with the disclosure elsewhere in this proxy statement (except as otherwise indicated), we have not accelerated the vesting of their awards).
Year | Average Reported Summary Compensation Table Total for NEOs ($) | Average Reported Value of Equity Awards ($) | Average Equity Award Adjustments ($)(1) | Average Compensation Actually Paid to NEOs ($) | ||||||||
2025 | 1,001,140 | (417,928) | (88,122) | 495,090 | ||||||||
2024 | 901,954 | (361,628) | 834,010 | 1,374,336 | ||||||||
2023 | 801,776 | (320,527) | 259,339 | 740,588 | ||||||||
The table below sets forth the manner in which Average Equity Award Adjustments in the immediately preceding table were calculated:
Year | Average Year End Fair Value of Equity Awards ($) | Year over Year Average Change in Fair Value of Outstanding and Unvested Equity Awards ($) | Year over Year Average Change in Fair Value of Equity Awards Granted in Prior Years that Vested in the Year ($) | Total Average Equity Award Adjustments ($) | ||||||||
2025 | 333,355 | (334,611) | (86,866) | (88,122) | ||||||||
2024 | 449,162 | 380,083 | 4,765 | 834,010 | ||||||||
2023 | 325,079 | (58,294) | (7,446) | 259,339 | ||||||||
The table below sets forth the manner in which Equity Award Adjustments in the immediately preceding table were calculated (see footnotes (1) – (9) below for the assumptions made in the valuations that differ materially from those disclosed as of the grant date of such equity awards:
Year | Year End Fair Value of Equity Awards ($) | Year over Year Change in Fair Value of Outstanding and Unvested Equity Awards ($) | Year over Year Change in Fair Value of Equity Awards Granted in Prior Years that Vested in the Year ($) | Total Equity Award Adjustments ($) | ||||||||
2025 | 619,291(1) | (652,108)(2) | (179,031)(3) | (211,848) | ||||||||
2024 | 828,862(4) | 771,749(5) | 10,444(6) | 1,611,055 | ||||||||
2023 | 663,011(7) | (127,592)(8) | (24,192)(9) | 511,227 | ||||||||
(1) | With respect to the 2025 RSU-ROCs, assumes that as of (i) the grant date, 73% of such awards would vest and (ii) year-end 2025, 82% of such awards would vest. |
(2) | With respect to the (A) 2024 RSU-ROCs, assumes that as of (i) year-end 2025, 80% of such awards would vest and (ii) year-end 2024, 48% of such awards would vest and (B) 2023 RSU-ROCs, assumes that as of (i) year-end 2025, 76% of such awards would vest and (ii) year-end 2024, 47% of such awards would vest. |
(3) | With respect to the 2022 RSU-ROCs, which vested in 2025, assumes that as of year-end 2024, 72% of such awards would vest, of which only 44% actually vested. |
(4) | With respect to the 2024 RSU-ROCs, assumes that as of (i) the grant date, 44% of such awards would vest and (ii) year-end 2024, 48% of such awards would vest. |
(5) | With respect to the (A) 2023 RSU-ROCs, assumes that as of (i) year-end 2024, 47% of such awards would vest and (ii) year-end 2023, 51% of such awards would vest and (B) 2022 RSU-ROCs, assumes that as of (i) year-end 2024, 72% of such awards would vest and (ii) year-end 2023, 67% of such awards would vest. |
(6) | With respect to the 2021 RSU-ROCs which vested in 2024, assumes that as of year-end 2023, 100% of such awards would vest, of which only 50% actually vested. |
(7) | With respect to the 2023 RSU-ROCs, assumes that as of (i) the grant date, 53% of such awards would vest and (ii) year-end 2023, 51% of such awards would vest. |
(8) | With respect to the (A) 2022 RSU-ROCs, assumes that as of (i) year-end 2023, 67% of such awards would vest and (ii) year-end 2022, 69% of such awards would vest and (B) 2021 RSU-ROCs, assumes that as of (i) year-end 2023, 100% of such awards would vest and (ii) year-end 2022, 100% of such awards would vest. |
(9) | With respect to the 2020 RSU-ROCs which vested in 2023, assumes that as of year-end 2022, 100% of such awards would vest, which is the amount that actually vested. |
The table below sets forth the manner in which Average Equity Award Adjustments in the immediately preceding table were calculated:
Year | Average Year End Fair Value of Equity Awards ($) | Year over Year Average Change in Fair Value of Outstanding and Unvested Equity Awards ($) | Year over Year Average Change in Fair Value of Equity Awards Granted in Prior Years that Vested in the Year ($) | Total Average Equity Award Adjustments ($) | ||||||||
2025 | 333,355 | (334,611) | (86,866) | (88,122) | ||||||||
2024 | 449,162 | 380,083 | 4,765 | 834,010 | ||||||||
2023 | 325,079 | (58,294) | (7,446) | 259,339 | ||||||||