Year | Summary Compensation Table Total for PEO (1) | Compensation Actually Paid to PEO (2) | Average Summary Compensation Table Total for Non-PEO NEOs (3) | Average Compensation Actually Paid to Non-PEO NEOs (3) | Value of Initial Fixed $100 Investment based on Total Shareholder Return (TSR) (4) | Net Income (Loss) | ||||||
(a) | (b)($) | (c)($) | (d)($) | (e)($) | (f)($) | (g)($ in 000's) | ||||||
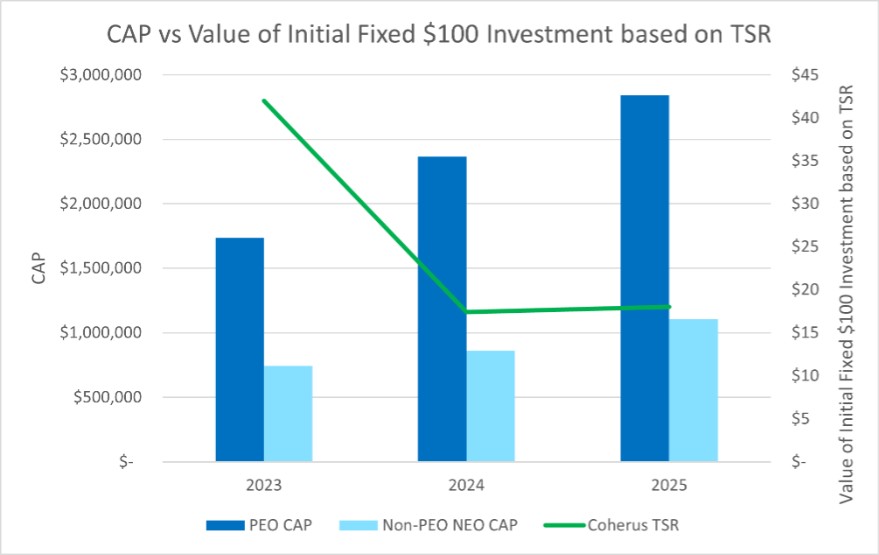
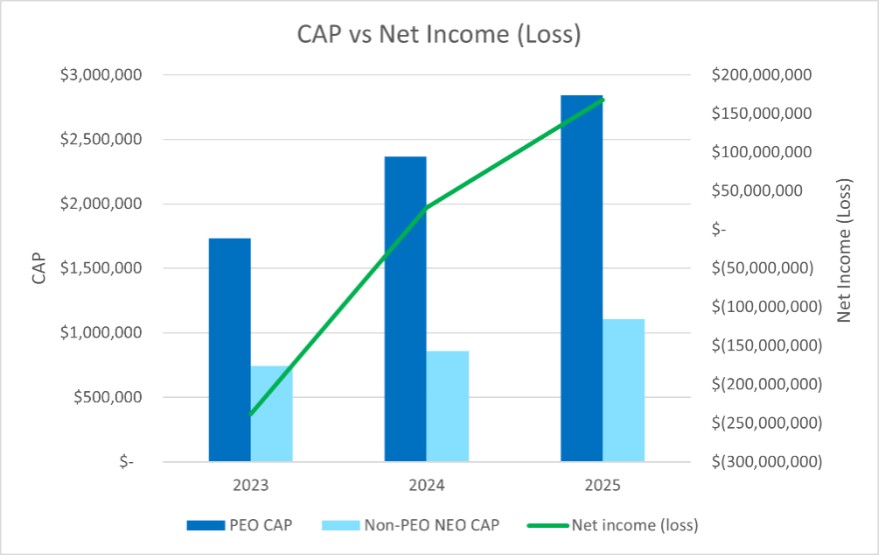
2025 | 2,736,874 | 2,842,870 | 1,165,300 | 1,064,902 | 18 | 168,024 | ||||||
2024 | 4,802,309 | 2,364,913 | 1,345,143 | 860,228 | 17 | 28,507 | ||||||
2023 | 5,897,924 | 1,734,065 | 1,863,540 | 744,699 | 42 | (237,892) |
| (1) | Represents total compensation paid to the principal executive officer, or PEO, Mr. Dennis Lanfear, as reflected in the Summary Compensation Table. |
| (2) | The following table sets forth the adjustments made during each year presented to arrive at CAP to our PEO during each year: |
2025 | 2024 | 2023 | ||||
($) | ($) | ($) | ||||
Summary Compensation Table (SCT) Total Compensation | 2,736,874 | 4,802,309 | 5,897,924 | |||
Deduct for amounts reported under the "Stock Awards" and "Option Awards" in the SCT | (828,130) | (2,873,088) | (4,075,681) | |||
Fair value as of year-end of equity awards granted during the year that remain unvested | 974,599 | 1,112,854 | 1,161,479 | |||
Change in fair value of prior years' equity awards that remain unvested as of year-end | 76,009 | (627,283) | (1,100,382) | |||
Fair value on vesting date for awards granted and vested in the same year | — | 317,940 | 248,745 | |||
Change in fair value from prior year-end to vesting date of prior years' awards that vested during year | (62,482) | (367,819) | (398,020) | |||
Deduct fair value as of end of prior fiscal year of awards granted in any prior year that fail to meet vesting conditions during the fiscal year | (54,000) | — | — | |||
Compensation Actually Paid (CAP) | 2,842,870 | 2,364,913 | 1,734,065 |
| (3) | The following table sets forth the adjustments made during each year presented to arrive at CAP to our non-PEO NEOs during each year: |
2025 | 2024 | 2023 | ||||
($) | ($) | ($) | ||||
Average SCT Total for Non-PEO NEOs | 1,165,300 | 1,345,143 | 1,863,540 | |||
Deduct for amounts reported under the "Stock Awards" and "Option Awards" in the SCT | (330,976) | (526,406) | (963,378) | |||
Fair value as of year-end of equity awards granted during the year that remain unvested | 262,000 | 207,285 | 260,238 | |||
Change in fair value of prior years' equity awards that remain unvested as of year-end | 12,082 | (134,603) | (229,356) | |||
Fair value on vesting date for awards granted and vested in the same year | — | 49,899 | 121,694 | |||
Change in fair value from prior year-end to vesting date of prior years' awards that vested during year | (19,104) | (81,090) | (122,691) | |||
Deduct fair value as of end of prior fiscal year of awards granted in any prior year that fail to meet vesting conditions during the fiscal year | (24,400) | — | (185,348) | |||
Average CAP to Non-PEO NEOs | 1,064,902 | 860,228 | 744,699 |
The non-PEO NEOs included in average compensation shown in columns (d) and (e) above are as follows:
2025 and 2024 | 2023 | |
Paul Reider | McDavid Stilwell | |
Bryan McMichael | Vladimir Vexler, Ph.D. | |
Paul Reider | ||
Bryan McMichael |
| (4) | Total Shareholder Return, or TSR, represents the cumulative value of a hypothetical $100 investment in the Company made as of December 31, 2022, reflected as of the end of each respective year. |
| (1) | Represents total compensation paid to the principal executive officer, or PEO, Mr. Dennis Lanfear, as reflected in the Summary Compensation Table. |
The non-PEO NEOs included in average compensation shown in columns (d) and (e) above are as follows:
2025 and 2024 | 2023 | |
Paul Reider | McDavid Stilwell | |
Bryan McMichael | Vladimir Vexler, Ph.D. | |
Paul Reider | ||
Bryan McMichael |
| (2) | The following table sets forth the adjustments made during each year presented to arrive at CAP to our PEO during each year: |
2025 | 2024 | 2023 | ||||
($) | ($) | ($) | ||||
Summary Compensation Table (SCT) Total Compensation | 2,736,874 | 4,802,309 | 5,897,924 | |||
Deduct for amounts reported under the "Stock Awards" and "Option Awards" in the SCT | (828,130) | (2,873,088) | (4,075,681) | |||
Fair value as of year-end of equity awards granted during the year that remain unvested | 974,599 | 1,112,854 | 1,161,479 | |||
Change in fair value of prior years' equity awards that remain unvested as of year-end | 76,009 | (627,283) | (1,100,382) | |||
Fair value on vesting date for awards granted and vested in the same year | — | 317,940 | 248,745 | |||
Change in fair value from prior year-end to vesting date of prior years' awards that vested during year | (62,482) | (367,819) | (398,020) | |||
Deduct fair value as of end of prior fiscal year of awards granted in any prior year that fail to meet vesting conditions during the fiscal year | (54,000) | — | — | |||
Compensation Actually Paid (CAP) | 2,842,870 | 2,364,913 | 1,734,065 |
| (3) | The following table sets forth the adjustments made during each year presented to arrive at CAP to our non-PEO NEOs during each year: |
2025 | 2024 | 2023 | ||||
($) | ($) | ($) | ||||
Average SCT Total for Non-PEO NEOs | 1,165,300 | 1,345,143 | 1,863,540 | |||
Deduct for amounts reported under the "Stock Awards" and "Option Awards" in the SCT | (330,976) | (526,406) | (963,378) | |||
Fair value as of year-end of equity awards granted during the year that remain unvested | 262,000 | 207,285 | 260,238 | |||
Change in fair value of prior years' equity awards that remain unvested as of year-end | 12,082 | (134,603) | (229,356) | |||
Fair value on vesting date for awards granted and vested in the same year | — | 49,899 | 121,694 | |||
Change in fair value from prior year-end to vesting date of prior years' awards that vested during year | (19,104) | (81,090) | (122,691) | |||
Deduct fair value as of end of prior fiscal year of awards granted in any prior year that fail to meet vesting conditions during the fiscal year | (24,400) | — | (185,348) | |||
Average CAP to Non-PEO NEOs | 1,064,902 | 860,228 | 744,699 |